1. Introduction
Power transformers are vital assets in electrical power systems, enabling voltage transformation, power transfer, and system stability across generation, transmission, and distribution networks
| [1] | Preonto, S., Swarnaker, A., Khan, A. A., Ahmed, H. F., Khan, U. A. How Grid Decarbonization Reshapes Distribution Transformer Life-cycle Impacts: A Forecasting-based Life Cycle Assessment Framework for Hydro-dominated Grids, Energies. 2026, 19(3), 1-30. https://doi.org/10.3390/en19030651 |
[1]
. Their reliable operation is essential for ensuring continuous electricity supply, minimizing technical losses, and maintaining power quality
| [2] | Nazarychev, A., Iliev, I., Manukian, D., Beloev, H., Suslov, K., Beloev, I. Review of Operating Conditions, Diagnostic Methods, and Technical Condition Assessment to Improve Reliability and Develop a Maintenance Strategy for Electrical Equipment, Energies. 2025, 18(21), 1-40.
https://doi.org/10.3390/en18215832 |
[2]
. Given their high cost and strategic importance, unexpected failures can cause extended outages, significant economic losses, and safety risks.
Transformer faults often result from thermal, electrical, mechanical, or chemical stresses, including insulation degradation, partial discharge, arcing, overheating of windings or core materials, and oil contamination
| [3] | Hashemi, M. H. Applications of Feature Selection for Detecting Energy Discharge and Thermal Faults in Transformers Using DGA Data. In 8th International Artificial Intelligence and Data Processing Symposium 2024. IEEE, USA, 2024; pp. 1-5. https://doi.org/10.1109/IDAP64064.2024.10711118 |
[3]
. These faults typically progress gradually and remain unnoticed until they reach a critical stage, highlighting the importance of effective condition monitoring and early diagnosis.
DGA is one of the most widely used diagnostic tools for assessing transformer health
| [4] | Ibrahim, S. A., Ward, S. A., EL-Faraskoury, A., Mansour, D. E. A. Towards Identification of Transformer Oil Faults via Novel Combined DGA Approach, Delta University Scientific Journal. 2024, 7(3), 218-227.
https://doi.org/10.21608/dusj.2024.433464 |
[4]
. It involves extracting and analysing gases dissolved in insulating oil, including hydrogen, methane, ethane, ethylene, acetylene, carbon monoxide, and carbon dioxide. The composition and concentration of these gases provide valuable insights into fault types and severity. Traditional interpretation techniques, such as key gas methods, gas ratio methods, the Duval Triangle, and Roger’s ratios, are extensively applied in industry
| [5] | Nambiar, M. S., Murthy, C. N., Shingne, N. Investigating High Intensity Thermal Faults in Ester-based Transformer Oil: A Dissolved Gas Analysis Approach, Engineering, Technology and Applied Science Research. 2026, 16(1), 31502–31508. https://doi.org/10.48084/etasr.15023 |
[5]
. However, these approaches rely on fixed thresholds, expert judgement, and heuristic rules, which can result in inconsistent diagnoses, particularly under complex or overlapping fault conditions.
The growing availability of operational data and advances in artificial intelligence have driven the adoption of data-driven approaches for transformer fault detection and diagnosis. Among machine learning techniques, Random Forest classifiers are widely recognised for their robustness, ability to capture nonlinear relationships, and resilience to noise and overfitting
| [6] | Suprihadi, E., Danila, N., Ali, Z., Ananta, G. P. Explainable Ensemble Learning for Predicting Stock Market Crises: Calibration, Threshold Optimisation, and Robustness Analysis, Information. 2026, 17(2), 1-29.
https://doi.org/10.3390/info17020114 |
[6]
. As ensembles of decision trees, they deliver strong generalisation and stable predictions. In addition, they provide intrinsic measures of feature importance, enhancing interpretability and supporting engineering insight. These qualities make Random Forest classifiers particularly effective for analysing multidimensional DGA datasets and overcoming the limitations of conventional diagnostic methods
| [7] | Alam, M. A., Alam, M. K., Mahmud, M. A. Deep Learning for Early Detection of Systemic Risk in Interconnected Financial Markets: A US Regulatory Perspective, Journal of Computer Science and Technology Studies. 2025, 7(9), 353-375.
https://doi.org/10.32996/jcsts.2025.7.9.42 |
[7]
.
Despite its widespread use in transformer condition monitoring, Dissolved Gas Analysis has notable limitations in modern power systems
| [8] | Yin, S. Machine Learning Algorithms for Early Warning Systems: Predicting Systemic Financial Crises Through Non-linear Econometric Models. International Journal of Economics and Finance Studies. 2024, 16(4), 286-311.
https://doi.org/10.34109/ijefs.202416414 |
[8]
. Traditional interpretation methods often fail to capture nonlinear interactions among dissolved gases or adapt to variations in transformer design, operating conditions, and ageing profiles
| [9] | Sutikno, H., Prasojo, R. A., Abu-Siada, A. Machine Learning-based Multi-method Interpretation to Enhance Dissolved Gas Analysis for Power Transformer Fault Diagnosis. Heliyon. 2024, 10(4), 1-21.
https://doi.org/10.1016/j.heliyon.2024.e25975 |
[9]
. Consequently, ambiguous diagnoses and fault misclassifications are common, particularly in cases involving mixed or incipient faults
| [10] | Hechifa, A., Lakehal, A., Nanfak, A., Saidi, L., Labiod, C., Kelaiaia, R., Ghoneim, S. S. Improved Intelligent Methods for Power Transformer Fault Diagnosis Based On Tree Ensemble Learning and Multiple Feature Vector Analysis. Electrical Engineering. 2024, 106(3), 1-22.
https://doi.org/10.21203/rs.3.rs-3207776/v1 |
[10]
.
Transformer failures present serious risks to power system reliability, safety, and economic performance. Unexpected breakdowns can cause prolonged outages, expensive repairs or replacements, and cascading effects across interconnected networks
| [11] | Capulong, C. D., Camat, P. K., Gonzales, P., Bunoan, K. G., Tolentino, A., Gomez, R. J., Favorito, R. Analysis of Failure Rate Due to Transformer Loadings of Commonly Used Transformers in Porac Substation. Journal of Science Technology and Engineering Research. 2025, 6(2), 107-117.
https://doi.org/10.53525/jster.1722805 |
[11]
. In many utilities, maintenance strategies remain largely reactive or time-based, failing to harness the predictive value of available condition monitoring data
| [12] | Hoffmann, M. A., Lasch, R. Unlocking the Potential of Predictive Maintenance for Intelligent Manufacturing: A Case Study On Potentials, Barriers, and Critical Success Factors. Schmalenbach Journal of Business Research. 2025, 77(1), 27-55. https://doi.org/10.1007/s41471-024-00204-3 |
[12]
.
Although various machine learning techniques have been proposed for transformer fault diagnosis, systematic investigation into robust, interpretable, and scalable models remains limited. Existing approaches often struggle to process DGA data reliably and deliver accurate fault classification
| [13] | Kumar, D., Dutta, S., Illias, H. A. Streamlining Fault Classification of Dissolved Gases in Transformer Using Data Synthesis and Dimension Reduction. IEEE Transactions on Dielectrics and Electrical Insulation. 2024, 31(5), 2451-2460.
https://doi.org/10.1109/TDEI.2024.3387416 |
[13]
. The potential of Random Forest classifiers to improve diagnostic accuracy while offering transparent decision-making support has not been fully explored. This study addresses that gap by developing a data-driven fault detection and diagnosis framework based on DGA and Random Forest classification.
The anticipated outcomes of this research include the development of a robust data-driven model for transformer fault detection and diagnosis using DGA. The proposed Random Forest classifier is expected to deliver greater diagnostic accuracy and consistency than conventional DGA methods and selected baseline machine learning models.
The study is expected to provide insights into the relative importance of dissolved gas features in fault classification. It will identify key gases and combinations that contribute most to specific fault types by examining feature importance scores from the Random Forest model. This knowledge will enhance model interpretability and support engineering decision-making.
This research is expected to yield practical guidelines for the implementation of machine learning-based DGA diagnostic systems in power utilities. The guidelines will address critical aspects of data preparation, model training, validation, and deployment, thereby facilitating the integration of data-driven methods into established transformer condition monitoring practices.
The research carries considerable academic, industrial, and societal relevance. Academically, it contributes to the expanding body of knowledge on artificial intelligence in power system asset management. It demonstrates the effectiveness of ensemble learning for complex diagnostic tasks and offers a structured framework for integrating machine learning with established condition monitoring practices.
In the industrial context, the proposed approach provides a reliable and cost-effective tool for improving transformer condition assessment and predictive maintenance. Greater fault detection accuracy enables utilities to prioritise maintenance, minimise unplanned outages, and extend service life. Early identification of incipient faults supports informed decision-making and optimised asset management strategies.
From a societal perspective, enhanced transformer reliability supports continuous electricity supply, reduces energy losses, and strengthens system resilience. The research aligns with broader sustainability goals, including lowering environmental impacts linked to equipment failure, oil leakage, and premature asset replacement by enabling predictive maintenance and efficient resource use.
The scope of this research is limited to fault detection and diagnosis in oil-immersed power transformers using Dissolved Gas Analysis data. It examines commonly monitored gases and their relevance to typical fault categories, including overheating faults, partial discharge, and arcing (electrical discharges).
The research employs Random Forest classifiers as the primary machine learning technique, with performance assessed using standard metrics including accuracy, precision, recall, F1-score, and confusion matrices. Comparative analyses may be carried out against traditional DGA methods and alternative machine learning models to benchmark performance. The datasets used in this study comprise historical, labelled DGA records sourced from standard databases.
1.1. Review of Related Literature on Power Transformers Diagnosis
A study addressing data imbalance and catastrophic neglect to enhance nuclear power plant diagnostics was carried out
| [14] | Liu, Z., Zhou, Q., Liu, H. A Time-frequency Fusion Fault Diagnosis Framework for Nuclear Power Plants Oriented to Class-incremental Learning Under Data Imbalance. Computers. 2026, 15(1), 22. https://doi.org/10.3390/computers15010022 |
[14]
. Using SHAP-XGBoost for feature evaluation and an LSTM-Transformer with frequency-domain analysis, the proposed ATFNet performed well compared with traditional and deep learning models.
An evaluation of power transformer health was conducted when diagnostic data were insufficient
| [15] | Lee, S. Y., Oh, J. S., Park, J. D., Lee, D. H., Park, T. S. Autoencoder-based Missing Data Imputation for Enhanced Power Transformer Health Index Assessment. Energies. 2026, 19(1), 244. https://doi.org/10.3390/en19010244 |
[15]
. The researchers employed an autoencoder to reconstruct gaps, preserving relationships among diagnostic factors. Compared with mean or mode imputation, this method enhanced health index accuracy, enabling utilities to prioritise maintenance effectively and reduce operational risks despite incomplete data.
A hybrid CNN-Transformer model for predictive fault detection and real-time optimisation in smart grids using synthetic data was developed
| [16] | Kamara, G. D., Marrah, S. A., Koroma, A. B., Sheku, N., Cole, M. E., Kargbo, S. I., Mani, E. K. F. AI-powered Grid Resilience: Hybrid CNN Transformer for Predictive Fault Detection and Real Time Optimization. Journal of Scientific Reports. 2026, 12(1), 163-176. https://doi.org/10.58970/JSR.1162 |
[16]
. The research unified spatial and temporal analysis. The model demonstrated fault classification, interpretability, and potential for proactive grid management to improve resilience.
The integration of machine learning with spectroscopy for condition monitoring of energy infrastructure was explored
| [17] | Zhu, H., Zong, C., Fang, L., Zhang, H., Sun, Y., Tian, Y., Zhang, S., Wang, X. Intelligent Machine Learning-Based Spectroscopy for Condition Monitoring of Energy Infrastructure: A Review Focused on Transformer Oils and Hydrogen Systems. Processes. 2026, 14(2), 1-23. https://doi.org/10.3390/pr14020255 |
[17]
. The study focused on transformer oil ageing and hydrogen systems. It aimed to enable predictive maintenance despite challenges such as data scarcity and model interpretability.
A deep learning model for fault classification in industrial settings was presented
| [18] | Ranjani, K., Baranidharan, T., Ramal, J. Intelligent Deep Learning Based Fault Classification Using Dual-stream Transformer-CNN with Self-Supervised Feature Refinement for Industrial Applications. Tehnički Vjesnik. 2026, 33(1), 159-165. https://doi.org/10.17559/TV-20250321002502 |
[18]
. The researchers integrated Transformer and CNN architectures to capture spatial and temporal features from sensor data. Self-supervised learning further enhanced feature refinement, enabling the model to achieve high accuracy in fault detection. The approach strengthened monitoring and maintenance in complex industrial environments.
The use of machine learning models, specifically Decision Trees and Subspace KNN, integrated with Frequency Response Analysis data to improve fault detection in power transformers was investigated
| [19] | Maseko, N. S., Thango, B. A., Mabunda, N. Fault detection in power transformers using frequency response analysis and machine learning models. Applied Sciences. 2025, 15(5), 1-20.
https://doi.org/10.3390/app15052406 |
[19]
. The study achieved classification accuracies of 80% to 100% across eight frequency bands for faults such as insulation breakdown and core-related issues. It also identified the need for further model refinement to address challenges in detecting contamination-related faults.
A new approach for monitoring oil-immersed transformers was presented
| [20] | Tamakloe, E., Kommey, B., Kponyo, J. J., Tchao, E. T., Agbemenu, A. S., Klogo, G. S. Predictive AI Maintenance of Distribution Oil immersed Transformer via Multimodal Data Fusion: A New Dynamic Multiscale Attention CNN LSTM Anomaly Detection Model for Industrial Energy Management. IET Electric Power Applications. 2025, 19(1), 1-25.
https://doi.org/10.1049/elp2.70011 |
[20]
. An intelligent model was employed to integrate multimodal data using a hybrid CNN-LSTM architecture. The model detected incipient faults at an early stage, thereby reducing unplanned failures and operational downtime. The framework supported real-time deployment in industrial energy management systems.
A systematic literature review on the integration of AI techniques for fault diagnosis and predictive maintenance in power transformers was reported
| [21] | Nuruzzaman, M., Limon, G. Q., Chowdhury, A. R., Khan, M. M. Predictive Maintenance in Power Transformers: A Systematic Review of AI and IoT Applications. ASRC Procedia: Global Perspectives in Science and Scholarship. 2025, 1(01), 34-47. https://doi.org/10.63125/r72yd809 |
[21]
. The research analysed 126 peer-reviewed articles. The research also highlighted dominant trends, model performance, system architectures, and implementation challenges in the field. The findings emphasised the significant role of AI-driven models in enhancing predictive maintenance strategies.
Condition monitoring of power transformers using intelligent techniques was conducted
| [22] | Ajith, S., Malik, G. R., Sajith, S., Sivakumar, J., Jayasree, K. R. Reimagining Transformer Diagnostics: Synergizing Classical and Deep Learning Models for Health Evaluation. In 8th International Conference on Circuit, Power and Computing Technologies 2025. IEEE, India, 2025; pp. 1365-1370.
https://doi.org/10.1109/ICCPCT65132.2025.11176725 |
[22]
. Machine learning models and linear regression were applied to analyse real world data, such as dissolved gas concentrations and power factor. The objective of the research was to predict faults at an early stage and prevent power outages. In addition, principal component analysis was used to improve data interpretation, and an IoT based framework supported real time monitoring.
The combination of wavelet transforms with LSTM deep learning for detecting internal defects in power transformers was investigated
| [23] | Atiyah, W. A., Karimi, S., Moradi, M. Real-time Revolutionising Internal Defect Detection in Power Transformers by Leveraging Wavelet Transform and Deep Learning LSTM in Cascading Application. J. Electr. Eng. Technol. 2024, 19, 5273-5292. https://doi.org/10.1007/s42835-024-02048-7 |
[23]
. The researchers detected faults within a quarter of a cycle of the fundamental frequency. They also addressed the effects of current transformer saturation on relay operations. The approach was tested on a three phase 33/11 kV transformer and significantly enhanced power system reliability.
A study investigated the use of deep learning, particularly neural networks, to predict faults in electrical transformers
| [24] | Hadiki, H., Hasnaoui, F. S., Georges, S. Enhancing Electrical Transformer Fault Prediction with Deep Learning: A Focus on ANN-based Classification. In International Conference on Circuit, Systems and Communication 2024. 2024; pp. 1-6.
https://doi.org/10.1109/ICCSC62074.2024.10617006 |
[24]
. Two datasets were analysed. One dataset contained three-phase current and voltage measurements, while the other comprised key transformer health indicators. The proposed approach improved fault detection accuracy and reliability. The objective was to support maintenance teams in early fault identification and to enhance reliable power system operation.
Traditional methods for diagnosing faults in mineral oil immersed power transformers using dissolved gas analysis were reviewed
| [25] | Nanfak, A., Samuel, E., Fofana, I., Meghnefi, F., Ngaleu, M. G., Hubert Kom, C. Traditional Fault Diagnosis Methods For Mineral Oil Immersed Power Transformer Based On Dissolved Gas Analysis: Past, Present and Future. IET Nanodielectrics. 2024, 7(3), 97-130. https://doi.org/10.1049/nde2.12082 |
[25]
. The study highlighted the importance of dissolved gas analysis for early fault detection to prevent transformer failures and costly outages. Both conventional techniques and advanced approaches for improving diagnostic accuracy were examined. The review also acknowledged challenges related to methodological complexity and limited replicability.
The use of machine learning to predict faults in distribution transformers, which are critical for stable electricity supply, was investigated
| [26] | Biradar, V., Kakeri, D., Agasti, A. Machine Learning Based Predictive Maintenance in Distribution Transformers. In 8th International Conference on Computing, Communication, Control and Automation 2024. IEEE, USA, 2024; pp. 1-5.
https://doi.org/10.1109/ICCUBEA61740.2024.10774993 |
[26]
. The study collected historical data and Internet of Things sensor measurements, including oil levels and temperatures. Machine learning models were trained to identify early signs of transformer degradation before major failures occurred. The approach reduced costly downtime and maintenance expenses by shifting from reactive to proactive strategies. The research also addressed data preprocessing and visualisation to enhance feature understanding and evaluated multiple machine learning algorithms to improve fault diagnosis accuracy.
Research that examined how Backpropagation Neural Networks (BPNN) could diagnose and predict the lifespan of cellulose paper insulation in oil-immersed transformers was conducted
| [27] | Ngwenyama, M. K., Gitau, M. N. Application of Back Propagation Neural Network in Complex Diagnostics and Forecasting Loss of Life of Cellulose Paper Insulation in Oil Immersed Transformers. Scientific Reports. 2024, 14(1).
https://doi.org/10.1038/s41598-024-56598-x |
[27]
. Twenty-six transformers were analysed using dissolved gas analysis and oil integrity checks. Two BPNN models were developed: one predicted the degree of polymerisation from 2-Furaldehyde levels, and the other forecasted loss of life using DP and 2-Furaldehyde.
A transformer fault diagnosis method that integrates Improved Particle Swarm Optimisation (IPSO) with XGBoost to improve predictive accuracy and reliability in power systems was performed
| [28] | Zheng, Y., Rao, C., Wang, F., Zou, H. Transformer Fault Diagnosis Method Based on Improved Particle Swarm Optimization and XGBoost in Power System. Processes. 2025, 13(10), 1-16. https://doi.org/10.3390/pr13103321 |
[28]
. The study emphasised that conventional DGA techniques often struggle to identify complex or multiple faults. In contrast, machine learning methods, particularly boosting algorithms, demonstrated superior diagnostic performance and greater robustness under varied fault conditions.
A predictive maintenance strategy for power transformers, combining fuzzy logic with a multilayer perceptron neural network using dissolved gas analysis data, was developed
| [29] | Mateus, B. C., Farinha, J. T., Mendes, M. Fault Detection and Prediction for Power Transformers Using Fuzzy Logic and Neural Networks. Energies. 2024, 17(2), 1-18.
https://doi.org/10.3390/en17020296 |
[29]
. This integrated model improved fault classification accuracy across several fault types and supported more informed maintenance decisions, although its performance declined for fault categories with fewer samples.
An integrated diagnostic framework for transformer winding faults, combining discrete wavelet transform, logistic regression with the Lindeman, Merenda and Gold metric, and artificial neural networks, was developed
| [30] | Baroumand, S., Abbasi, A. R., Mahmoudi, M. Integrative fault diagnostic analytics in transformer windings: Leveraging logistic regression, discrete wavelet transform, and neural networks. Heliyon. 2025, 11(4), 1-16.
https://doi.org/10.1016/j.heliyon.2025.e42872 |
[30]
. Logistic regression identified the most informative wavelet features, thereby reducing data complexity, while the neural networks carried out fault detection and classification with improved accuracy.
1.2. Synthesis of Prior Work and Contribution of This Study
Recent advances in transformer fault diagnosis increasingly employ artificial intelligence and deep learning to address the limitations of rule-based Dissolved Gas Analysis (DGA). Hybrid architectures such as CNN–Transformer and CNN–LSTM models have proven effective in capturing spatial and temporal features from multimodal and synthetic datasets
| [16] | Kamara, G. D., Marrah, S. A., Koroma, A. B., Sheku, N., Cole, M. E., Kargbo, S. I., Mani, E. K. F. AI-powered Grid Resilience: Hybrid CNN Transformer for Predictive Fault Detection and Real Time Optimization. Journal of Scientific Reports. 2026, 12(1), 163-176. https://doi.org/10.58970/JSR.1162 |
| [20] | Tamakloe, E., Kommey, B., Kponyo, J. J., Tchao, E. T., Agbemenu, A. S., Klogo, G. S. Predictive AI Maintenance of Distribution Oil immersed Transformer via Multimodal Data Fusion: A New Dynamic Multiscale Attention CNN LSTM Anomaly Detection Model for Industrial Energy Management. IET Electric Power Applications. 2025, 19(1), 1-25.
https://doi.org/10.1049/elp2.70011 |
[16, 20]
. Likewise, wavelet–LSTM frameworks and Transformer-based diagnostic models have achieved high classification accuracy under controlled conditions
| [18] | Ranjani, K., Baranidharan, T., Ramal, J. Intelligent Deep Learning Based Fault Classification Using Dual-stream Transformer-CNN with Self-Supervised Feature Refinement for Industrial Applications. Tehnički Vjesnik. 2026, 33(1), 159-165. https://doi.org/10.17559/TV-20250321002502 |
| [23] | Atiyah, W. A., Karimi, S., Moradi, M. Real-time Revolutionising Internal Defect Detection in Power Transformers by Leveraging Wavelet Transform and Deep Learning LSTM in Cascading Application. J. Electr. Eng. Technol. 2024, 19, 5273-5292. https://doi.org/10.1007/s42835-024-02048-7 |
[18, 23]
. In addition, boosting methods, including XGBoost and optimisation-enhanced variants, have further enhanced predictive performance in complex fault scenarios
| [28] | Zheng, Y., Rao, C., Wang, F., Zou, H. Transformer Fault Diagnosis Method Based on Improved Particle Swarm Optimization and XGBoost in Power System. Processes. 2025, 13(10), 1-16. https://doi.org/10.3390/pr13103321 |
[28]
.
Despite these advances, several limitations remain. Many studies rely on synthetic or laboratory datasets, which restrict generalisability to real operational DGA records. Deep learning models, although accurate, often lack interpretability, demand high computational resources, and face deployment challenges in utility environments. Approaches that integrate Frequency Response Analysis or multimodal sensing
| [19] | Maseko, N. S., Thango, B. A., Mabunda, N. Fault detection in power transformers using frequency response analysis and machine learning models. Applied Sciences. 2025, 15(5), 1-20.
https://doi.org/10.3390/app15052406 |
| [22] | Ajith, S., Malik, G. R., Sajith, S., Sivakumar, J., Jayasree, K. R. Reimagining Transformer Diagnostics: Synergizing Classical and Deep Learning Models for Health Evaluation. In 8th International Conference on Circuit, Power and Computing Technologies 2025. IEEE, India, 2025; pp. 1365-1370.
https://doi.org/10.1109/ICCPCT65132.2025.11176725 |
[19, 22]
increase implementation costs and reduce scalability for utilities that primarily depend on historical DGA data. Moreover, issues such as class imbalance and multicollinearity are frequently noted but rarely addressed systematically, resulting in biased fault recognition, particularly for incipient or minority fault types.
Studies on neural networks for insulation ageing prediction
| [27] | Ngwenyama, M. K., Gitau, M. N. Application of Back Propagation Neural Network in Complex Diagnostics and Forecasting Loss of Life of Cellulose Paper Insulation in Oil Immersed Transformers. Scientific Reports. 2024, 14(1).
https://doi.org/10.1038/s41598-024-56598-x |
[27]
and fuzzy–neural hybrids for maintenance planning
| [29] | Mateus, B. C., Farinha, J. T., Mendes, M. Fault Detection and Prediction for Power Transformers Using Fuzzy Logic and Neural Networks. Energies. 2024, 17(2), 1-18.
https://doi.org/10.3390/en17020296 |
[29]
provide valuable predictive insights, yet they emphasise performance optimisation over transparency and practical deployment. Systematic reviews confirm the growing influence of AI in transformer diagnostics but also underline persistent challenges in interpretability, data quality, and real-world application
| [21] | Nuruzzaman, M., Limon, G. Q., Chowdhury, A. R., Khan, M. M. Predictive Maintenance in Power Transformers: A Systematic Review of AI and IoT Applications. ASRC Procedia: Global Perspectives in Science and Scholarship. 2025, 1(01), 34-47. https://doi.org/10.63125/r72yd809 |
[21]
.
In contrast to previous studies, this work introduces an interpretable and computationally efficient Random Forest diagnostic framework built on real, labelled DGA data. Unlike deep learning models that demand extensive training datasets and complex tuning, the proposed ensemble approach achieves a balance of robustness, transparency, and scalability. Multicollinearity is explicitly reduced through feature selection, while class imbalance is systematically managed using the Synthetic Minority Over-sampling Technique. Furthermore, Gini-based feature importance analysis offers clear engineering insight into the relative influence of key dissolved gases, directly supporting maintenance decisions.
The key research gap addressed in this study is the limited integration of interpretability, imbalance handling, and robust ensemble learning in practical DGA-based transformer diagnostics. By combining rigorous preprocessing, ensemble classification, and transparent feature evaluation, this work advances a deployable and diagnostically reliable framework that bridges the divide between high-accuracy machine learning models and the operational needs of power utilities.
2. Materials and Methods
2.1. Data Collection and Description
Historical Dissolved Gas Analysis data were sourced from a publicly available transformer condition monitoring database containing expert-labelled fault records. The dataset comprised oil-immersed power transformers operating under routine service conditions across transmission and distribution networks. Each entry represented a laboratory DGA test conducted in line with established industry practices for oil sampling, gas extraction, and chromatographic analysis.
Four dissolved gases were selected as primary diagnostic features: hydrogen (H
2), carbon monoxide (CO), ethylene (C
2H
4), and acetylene (C
2H
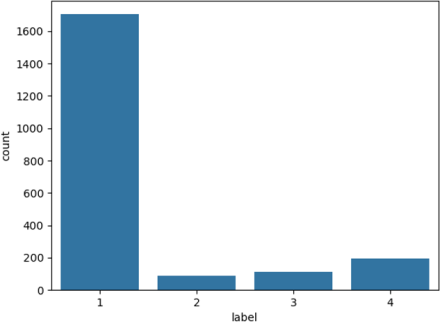
2). These gases were chosen for their established relevance to partial discharge, overheating (thermal) faults, and arcing. Each sample was labelled according to fault category: Normal Operation, Partial Discharge (Fault A), Overheating (Fault B), and Arcing (Fault C). The original dataset comprised 2,100 labelled samples distributed as follows: 1,705 Normal, 89 Partial Discharge, 113 Overheating, and 193 Arcing cases. This distribution reveals a pronounced class imbalance, as shown in
Table 1. Before modelling, the data were screened for missing values and outliers. Records with incomplete gas measurements were removed to preserve label integrity. Gas concentration features were standardised to ensure a comparable scale across variables. To reduce multicollinearity, highly correlated descriptors such as minimum and maximum values were excluded following correlation matrix analysis. The final feature set retained the mean and standard deviation of each gas concentration, preserving diagnostic variability while minimising redundancy. Class imbalance was addressed using the Synthetic Minority Over-sampling Technique, with synthetic samples generated only within the training set to prevent information leakage.
Table 1. Label Description.
Labels | Fault Classes | Count |
Class 1 | Normal Operation (Healthy) | 1705 |
Class 2 | Fault Type A (Partial Discharge) | 89 |
Class 3 | Fault Type B (Overheating) | 113 |
Class 4 | Fault Type C (Arcing) | 193 |
2.2. Sample Size Determination and Justification
The dataset comprised 2,100 labelled observations, which was sufficient for ensemble tree-based classification. Random Forest models are non-parametric and do not rely on strict distributional assumptions; however, adequate representation of each class is required to ensure statistical reliability. Although minority classes were under-represented in the raw dataset, oversampling was applied exclusively during training to balance class distribution while preserving the original validation structure. Performance metrics were calculated on unseen data to provide unbiased estimates. In addition, out-of-bag error estimation offered an internal cross-validation mechanism, enhancing reliability without reducing the effective training sample size. The combined use of bootstrap aggregation, cross-validation, and out-of-bag evaluation ensured statistically sufficient sample utilisation for stable model generalisation.
2.3. Experimental Setup and Model Development
2.3.1. Data Partitioning
The dataset was divided into training and testing subsets using an 80:20 split. Stratified sampling ensured that the class distribution was maintained in both subsets. Oversampling was applied exclusively to the training data.
2.3.2. Random Forest Algorithm Implementation
A Random Forest classifier was implemented using bootstrap aggregation of decision trees. Hyperparameters were optimised through grid search with five-fold cross-validation on the training set. The parameters tuned included:
1) Number of trees;
2) Maximum tree depth;
3) Minimum samples required for node splitting;
4) Minimum samples required at leaf nodes; and
5) Number of features considered at each split.
The optimal configuration was selected based on the mean cross-validated F1-score, ensuring balanced performance across imbalanced classes.
Gini impurity was used to select splits that best separate gas concentrations into fault categories, as depicted in:
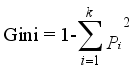 (1)
(1) where k represents the total number of fault classes, i represents the index of a fault class (1, 2, 3, 4), Pi represents the proportion of samples at a given node belonging to class i.
Ensemble Voting ensured majority decisions across trees, reducing bias from noisy gas readings, and it is expressed as:
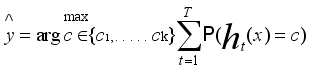 (2)
(2) where

represents the final predicted fault class for the transformer oil sample,
c represents the candidate fault class (among Normal, Fault A, Fault B, and Fault C),
C1,…, C
k represents the set of all possible fault classes,
T represents the total number of decision trees in the Random Forest,
t represents the index of an individual decision tree,
ht (x) represents the prediction made by the t-th tree for input sample
x, input feature vector representing DGA measurements (H
2, CO, C
2H
4, C
2H
2) is represented by
x,

represents the indicator function (returns 1 if the condition is true, or returns 0 otherwise).
Out-of-Bag (OOB) Error evaluates accuracy using bootstrap samples. It is critical for imbalanced DGA data, as it avoids overfitting to normal samples, and is expressed as:
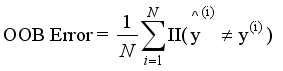 (3)
(3) where
N represents the total number of DGA samples evaluated using OOB prediction,
i represents the index of the transformer oil sample,

represents the predicted fault label for the i-th sample using only trees where the sample was out-of-bag,

represents the true fault label of the i-th sample obtained from expert-labelled DGA data,
represents the indicator function used to count classification errors (equals 1 if the sample is misclassified, otherwise 0).
Feature Importance (Gini-based) was used to identify the overall contribution of gas feature f to fault classification, expressed as:
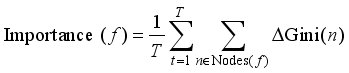 (4)
(4) where f represents a specific DGA gas feature (H2, CO, C2H4, C2H2), t represents the total number of trees in the Random Forest, t represents the index of an individual tree, n represents a specific node within a decision tree, ΔGini(n) represents the reduction in Gini impurity achieved at node n by splitting on feature f.
Class Probability Estimation was employed to generate confidence levels for each fault type, thereby enabling threshold tuning to minimise false negatives, and is expressed as:
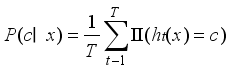 (5)
(5) where P(c ∣ x) represents the estimated probability that input sample x belongs to fault class c, the specific fault class (Normal, A, B, or C) is represented by c, the DGA feature vector for a transformer oil sample is represented by x, T represents the total number of trees in the Random Forest, ht(x) represents the prediction of the t-th tree for sample x. II(ht (x) = c) returns 1 if tree t predicts class c, otherwise 0.
2.3.3. Training Procedure
Each tree was trained on a bootstrap sample drawn with replacement from the training data. Approximately one third of the samples were excluded from each bootstrap subset and used as out-of-bag observations for internal validation. Final class predictions were derived through majority voting across all trees.
Class probabilities were estimated as the proportion of trees voting for each fault class, providing a basis for confidence assessment and threshold analysis.
3. Results and Discussion
3.1. Class Distribution in Original Dataset
Figure 1 illustrates the distribution of samples across classes in the original dataset. The plot shows a clear imbalance, with Class 1 containing far more samples than Classes 3 and 4. Such disparity hinders model training, as classifiers tend to favour the majority class while performing poorly on minority classes. The visualisation highlights the importance of balancing techniques such as SMOTE to ensure fair representation and enhance the model’s ability to detect minority faults accurately.
Figure 1. Original Dataset Class Distribution.
3.2. Pre-processing Correlation Heatmap
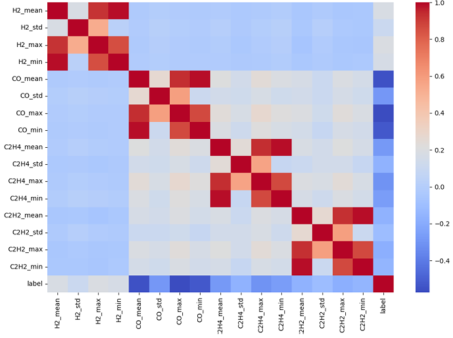
Figure 2 presents a correlation heatmap showing relationships between numerical variables. Strong positive correlations are observed among several features, with variables such as H
2_mean and H
2_max, CH
4_mean and CH
4_max, and others exhibiting pairwise correlation coefficients close to 1.0. This indicates multicollinearity, which may distort feature importance and lead to unstable predictions in tree-based models.
Figure 2. Correlation Heatmap Before Multicollinearity Correction.
3.3. Distribution of Mean C2H2 Concentrations
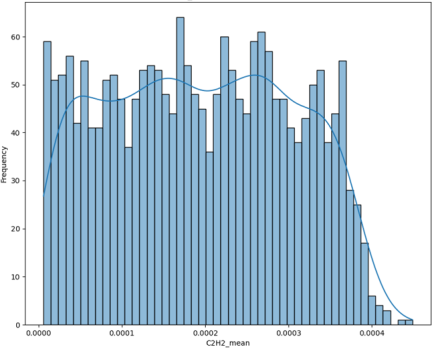
Figure 3. Frequency Distribution of Mean C2H2 Concentration.
Figure 3 shows the frequency distribution of mean acetylene (C
2H
2) concentration. In fault detection and diagnosis, C
2H
2 is a key indicator of high-energy electrical discharges, typically arcing faults. The x-axis represents mean C
2H
2 concentration, while the y-axis shows frequency. The distribution is strongly skewed towards very low concentrations, with a pronounced peak near zero, indicating that most transformers used operated without severe arcing. At much lower frequencies, the distribution extends to higher C
2H
2 levels. Any significant presence of C
2H
2 warrants immediate diagnosis, as it signals serious high-energy discharges and imminent failure risk. The clear separation between very low and elevated concentrations highlights the critical diagnostic value of C
2H
2.
3.4. Distribution of Mean H2 Concentrations
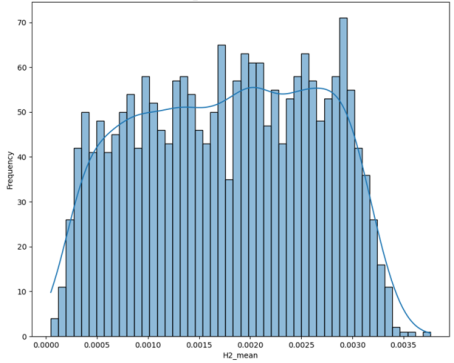
Figure 4. Frequency Distribution of Mean H2 Concentration.
Figure 4 shows the frequency distribution of mean hydrogen (H
2) concentration. In fault detection and diagnosis, H
2 is a key indicator of faults such as partial discharges, cellulose degradation, and certain overheating conditions. The x-axis represents mean H
2 concentration, while the y-axis indicates transformer frequency within specific ranges. The blue line depicts a Kernel Density Estimate curve that smooths the distribution. The pattern is broad and potentially multi-modal. Many transformers exhibit relatively low H
2 concentrations, reflecting healthy states or incipient faults. However, the distribution extends to higher concentrations with noticeable frequencies in the mid-to-high range, suggesting that a significant number of transformers generate hydrogen through degradation processes or active faults such as partial discharge. This spread highlights diverse fault conditions, from minor to severe hydrogen-producing issues requiring diagnostic attention.
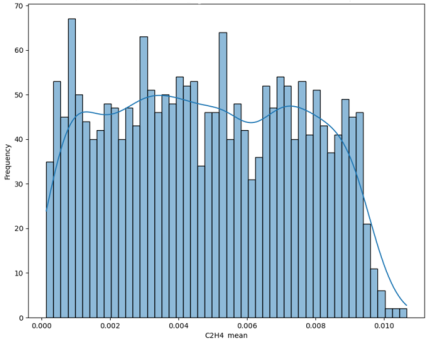
3.5. Distribution of Mean C2H4 Concentrations
Figure 5 shows the frequency distribution of mean ethylene (C
2H
4) concentration. In fault detection and diagnosis, C
2H
4 is a key indicator of localised hot metal overheating. The x-axis represents mean C
2H
4 concentration, and the y-axis represents frequency. The distribution is concentrated at very low values, suggesting that the transformers used operated without notable hot spots. At higher concentrations, the frequencies form a broader pattern, indicating varying degrees of localised overheating across the transformer population. The extended tail towards higher values reveals a subset of transformers with significant hot spots that require diagnosis and possible intervention.
Figure 5. Frequency Distribution of Mean C2H4 Concentration.
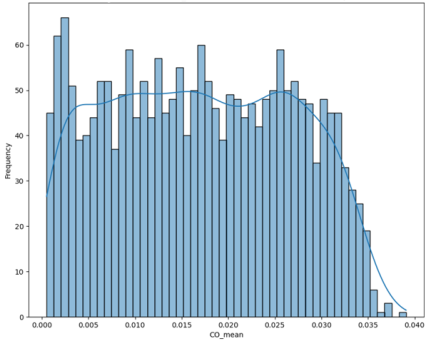
3.6. Distribution of Mean CO Concentrations
Figure 6 shows the frequency distribution of mean carbon monoxide (CO) concentration. In fault detection and diagnosis, CO is a key indicator of thermal degradation in cellulose insulation. The x-axis represents mean CO concentration, while the y-axis indicates the number of transformers at each level. The distribution is broad and potentially multi-modal, with a distinct peak at very low concentrations, reflecting transformers with sound insulation or minimal ageing. At higher concentrations, the distribution extends markedly, revealing a significant proportion of transformers experiencing varying degrees of cellulose degradation. This pattern demonstrates that thermal ageing of insulation is widespread across the transformer fleet, ranging from mild to severe. Elevated CO levels activate diagnostic protocols to determine the extent of paper degradation.
Figure 6. Frequency Distribution of Mean CO.
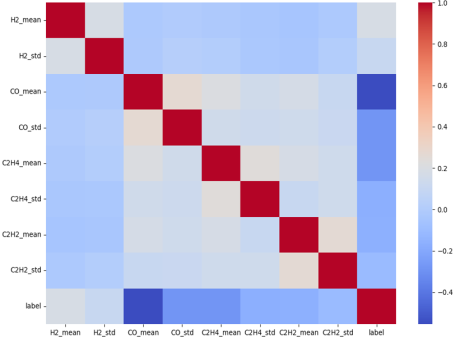
3.7. Post-processing Correlation Heatmap
Figure 7 presents the correlation heatmap after multicollinearity was addressed, confirming the effectiveness of feature selection in removing redundant variables, particularly minimum and maximum gas readings, while retaining meaningful attributes such as mean and standard deviation of gas concentrations. The heatmap shows low to moderate correlations among the retained features, ensuring that each contributes distinct diagnostic information. This refinement reduces model complexity, prevents inflated importance rankings, and improves interpretability. Although Random Forests can manage multicollinearity, eliminating redundancy simplifies the learning process and enhances model clarity. The heatmap also confirms that essential fault-related variations are preserved, enabling the classifier to identify complex fault patterns with greater accuracy. Consequently, the dataset is structured for robust and reliable fault detection and diagnosis modelling.
Figure 7. Correlation Heatmap After Multicollinearity.
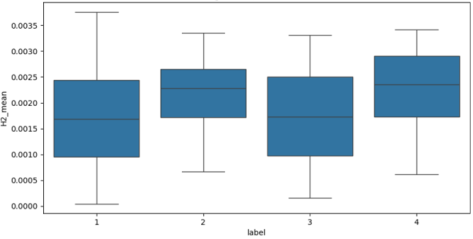
3.8. H2 Concentration Distribution Across Fault Classes
Figure 8. H2 Mean Concentration Distribution by Fault Type.
Figure 8 shows the distribution of mean hydrogen (H
2) concentration by fault type. The boxplot illustrates how mean H
2 values vary across four fault categories. Categories 1 and 3 have similar low median values with narrow spreads, indicating comparable baseline conditions. In contrast, Categories 2 and 4 display much higher median values, reflecting elevated H
2 concentrations under these fault conditions. However, the considerable overlap between them suggests that mean H
2 alone cannot fully distinguish these categories. The plot demonstrates that mean H
2 clearly separates the low-concentration group (Categories 1 and 3) from the high-concentration group (Categories 2 and 4), while offering limited discrimination within each group.
3.9. Performance Evaluation of the Random Forest Fault Diagnosis Model
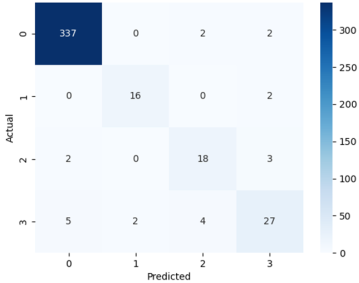
To evaluate the performance of the proposed fault detection and diagnosis model, a confusion matrix was used. It compares the actual fault categories with the model’s predictions, allowing assessment of correct classifications and misclassification patterns.
Figure 9 shows the confusion matrix for the transformer fault classification, with rows indicating actual classes and columns representing predicted classes.
Figure 9. Transformer Fault Classification Confusion Matrix.
The diagnostic performance of the proposed Random Forest-based transformer fault classification model was evaluated using the extracted values from the confusion matrix of actual versus predicted fault classes, as presented in
Table 2, and the class-wise precision, recall, and F1-score metrics summarised in
Table 3, with fault categories defined in accordance with IEC 60599.
Table 2 presents a detailed comparison between the actual operating conditions and the predicted diagnostic classes, namely Class 0 (Normal Operation), Class 1 (partial discharge), Class 2 (overheating faults), and Class 3 (arcing fault), while
Table 3 summarises the corresponding classification performance.
As shown in
Table 2, Normal Operation (Class 0) is identified with high accuracy, with 337 of 341 samples correctly classified as normal. Only 4 samples are misclassified, 2 as thermal faults and 2 as arcing. This very low rate of false positives demonstrates clear distinction between healthy and faulty states. Accordingly,
Table 3 records excellent precision of 0.980, recall of 0.988, and F1-score of 0.984 for the normal class, confirming the model’s reliability in recognising healthy operating conditions.
For Partial Discharge (Class 1),
Table 2 shows that 16 of 18 samples are correctly classified, with two misidentified as arcing. None are confused with normal operation or overheating, highlighting the model’s strong sensitivity to partial discharge-related gas signatures. This is confirmed by the balanced precision and recall values of 0.889 in
Table 3, demonstrating consistent and reliable detection of low-energy electrical discharge faults.
The classification performance for Overheating Faults (Class 2) is moderate.
Table 2 shows that 18 of 23 samples are correctly identified, with 2 misclassified as Normal Operation and 3 as arcing fault. Misclassification as Normal indicates that early or moderate thermal faults may produce gas patterns resembling normal operation, while confusion with Class 3 reflects overlapping thermal and electrical gas generation. These factors account for the reduced precision of 0.750, recall of 0.783, and F1-score of 0.766 for overheating faults reported in
Table 3.
The most difficult category to classify is Overheating fault (Class 3).
Table 2 shows that 27 of 38 arcing-related samples are correctly identified, while the rest are spread across Normal Operation, Partial Discharge, and Overheating Fault classes. Notably, 5 of Class 3 samples are misclassified as Normal Operation, representing critical false negatives. This spread reflects the complex and variable dissolved gas patterns linked to arcing faults, particularly under mixed or evolving fault conditions. Consequently,
Table 3 records a lower recall of 0.711 and an F1-score of 0.750 for Class 3, despite a reasonable precision of 0.794. The combined analysis of
Tables 2 and 3 shows that the proposed model delivers strong diagnostic reliability for Normal Operation and Partial Discharge faults, but reduced sensitivity for Overheating Faults and Arcing Faults. These results highlight the need for improved feature engineering, including gas ratio analysis and temporal trend modelling, to enhance discrimination across key IEC 60599 fault categories.
Table 2. Extracted Values form the Confusion Matrix of Actual versus Predicted Fault Classes.
Actual \ Predicted | Normal Operation (Class 0) | Fault Type A-Partial Discharge (Class 1) | Fault Type B-Overheating (Class 2) | Fault Type C-Arcing (Class 3) | Total Actual |
0 (Normal) | 337 | 0 | 2 | 2 | 341 |
1 (Fault A) | 0 | 16 | 0 | 2 | 18 |
2 (Fault B) | 2 | 0 | 18 | 3 | 23 |
3 (Fault C) | 5 | 2 | 4 | 27 | 38 |
The performance of the Random Forest classifier was assessed using Precision, Recall, and F1-score metrics derived from the confusion matrix, as summarised in
Table 3.
The classifier achieved excellent performance in identifying normal operating conditions, with a precision of 0.980, recall of 0.988, and an F1-score of 0.984. The high recall indicates a very low false-negative rate for healthy transformers, which is critical for avoiding unnecessary maintenance.
For partial discharge faults, balanced precision and recall values of 0.889 demonstrate reliable detection of low-energy electrical discharges. The close alignment between precision and recall reflects stable discrimination without bias towards false positives or false negatives.
Performance was moderate for overheating and arcing faults. The overheating class recorded an F1-score of 0.766, while arcing achieved 0.750. The reduced Recall for arcing (0.711) suggests some false negatives, attributable to overlapping gas generation mechanisms between thermal and high-energy electrical faults.
Table 3. Class-wise Precision, Recall, and F1-Score Performance of the Fault Classification Model.
Class | Precision | Recall | F1-Score | Support |
0 (Normal) | 0.980 | 0.988 | 0.984 | 341 |
1 (Fault A) | 0.889 | 0.889 | 0.889 | 18 |
2 (Fault B) | 0.750 | 0.783 | 0.766 | 23 |
3 (Fault C) | 0.794 | 0.711 | 0.750 | 38 |
To provide a comprehensive evaluation, both macro and weighted averages were computed from
Table 3 as follows:
1) Macro-average precision: 0.853;
2) Macro-average recall: 0.843;
3) Macro-average F1-score: 0.847;
4) Weighted F1-score: 0.936; and
5) Overall accuracy (from confusion matrix): 0.942.
The macro-average F1-score of 0.847 indicates balanced performance across all fault categories, including minority classes. The higher weighted F1-score reflects the predominance of normal samples in the dataset.
To assess statistical reliability, 95% confidence intervals (CI) were estimated using binomial proportion assumptions based on class support:
1) Normal class F1-score: 0.984 (95% CI: 0.972-0.996)
2) Partial discharge: 0.889 (95% CI: 0.748-0.971)
3) Overheating: 0.766 (95% CI: 0.590-0.886)
4) Arcing: 0.750 (95% CI: 0.593-0.863)
The narrow confidence interval for the normal class indicates high statistical stability. Wider intervals for minority fault classes are expected due to smaller sample sizes rather than model instability.
A hypothesis test was conducted to determine whether the model performed significantly better than random classification (baseline accuracy of 0.25 for four classes). A one-sample proportion test yielded p < 0.001, confirming that the observed overall accuracy of 0.942 is statistically significant.
The evaluation aligns with internationally recognised DGA interpretation standards, including:
1) IEC 60599; and
2) IEEE C57.104.
Traditional ratio-based methods under these standards rely on fixed gas concentration thresholds and predefined ratios, which often struggle when fault gas signatures overlap. The macro F1-score of 0.847 and strong class-wise precision values demonstrate improved discrimination compared with rule-based threshold interpretation, particularly for partial discharge faults. The model maintains categorisation consistent with IEC 60599 fault classes while enhancing sensitivity in mixed or borderline cases. However, the recall of 0.711 for arcing faults suggests that high-energy discharge detection could benefit from further feature engineering, such as gas ratio augmentation or temporal trend analysis, to meet the high sensitivity expected under IEEE guidance.
The evaluation highlights three principal diagnostic characteristics. First, the model shows high reliability in identifying healthy operating conditions. The very high F1-score for the normal class substantially reduces false alarms, supporting efficient maintenance planning and avoiding unnecessary inspections.
Second, the classifier provides balanced detection of partial discharge faults. The equal precision and recall values indicate consistent recognition of incipient electrical discharges, without bias towards false positives or false negatives.
Third, sensitivity for overheating and arcing faults is moderate. The observed misclassification between these categories reflects the known physical overlap in dissolved gas generation mechanisms, as outlined in IEC 60599. This limitation arises from similarities in gas chemistry under evolving thermal and electrical fault conditions, rather than instability or weakness in the learning algorithm.