Research Article | | Peer-Reviewed

The Threat of Climate Change to Vegetation Health and Land Degradation in Iraq's Diverse Climatic Environment

Received: 23 June 2025     Accepted: 8 July 2025     Published: 15 August 2025
Views:       Downloads:
Abstract

The fifth-ranking position determines that Iraq is one of the nation’s facing extreme climate difficulties. Iraq fights against the increase in heat while coping with a lack of precipitation and intensifying dry spells, in addition to facing water shortages and land degradation, along with recurring dust storms. Extreme climate changes have a major impact on environmental stability and farming output, as well as the overall sustainability of the system. This study uses global meteorological data combined with satellite imagery to study the climatic parameter transformations in Iraq from 1981 to 2020, as well as their consequences on water balance, vegetation growth, and land degradation. The research analyses MODIS Vegetation Indices (MOD13) together with 252 satellite images throughout Iraq, starting from 2000 to 2020. Research data helped determine spatial-temporal changes regarding land degradation and vegetation density alongside their relationship to climatic elements. Key climatic variables demonstrate both time-dependent and geographic changes across Iraq between 1981 and 2020, which impact vegetation maintenance while leading to land degradation. The research findings demonstrate concerning temperature growth that average of 0.97°C/decade, because this rapid temperature increase worsens environmental destruction. Rain levels in Iraq have been decreasing throughout the years, until more than 70% of the country receives between 100 to 300mm of annual rainfall. The reduced precipitation has led to rising evapotranspiration losses that amounted to 14,732.18 million m3 in the second decade, followed by 25,459.13 million m3 in the third decade, and finally reaching 32,390.20 million m3 in the fourth decade compared to the first decade. The increased aridity index forces greater adverse impacts on vegetation density, which leads to faster land degradation. The widespread destruction of Iraq's natural lands has reached more than 68% because of desertification processes. The rising climate change dangers to Iraqi ecosystems require immediate adaptations for combating desertification and enhancing land administration methods.

Published in American Journal of Agriculture and Forestry (Volume 13, Issue 4)
DOI 10.11648/j.ajaf.20251304.14
Page(s) 198-217
Creative Commons

This is an Open Access article, distributed under the terms of the Creative Commons Attribution 4.0 International License (http://creativecommons.org/licenses/by/4.0/), which permits unrestricted use, distribution and reproduction in any medium or format, provided the original work is properly cited.

Copyright

Copyright © The Author(s), 2025. Published by Science Publishing Group

Keywords

Climate Change, Rainfall, Air Temperature, Evapotranspiration, Land Degradation

1. Introduction
Climate change ranks as a globally urgent environmental challenge that science identifies as the most formidable issue for our current century . The ecological systems and agricultural productivity, along with water resources and human health and socio-economic development on Earth, face severe impacts from these adverse consequences, which extend beyond their regional boundaries . The Intergovernmental Panel on Climate Change (IPCC) reports that global temperatures exceed pre-industrial norms by 1.1°C, which causes intensifying extreme weather conditions and glacier retreats, and increases in sea levels, and intensifies droughts and floods . The effects of climate change from these disturbances affect developed and developing nations through disruptions to food security and freshwater supply, and reductions in biodiversity and economic incomes . Research needs to answer how variations in environmental climate elements, including precipitation and temperature, and evapotranspiration rates produce effects on land vegetation density and rate of degradation. How do these environmental events evolve in time and space throughout the countries of the Iraqi arid and semi-arid zones?
Research on climate change effects for vegetation and land quality has gained importance because scientific and policy-making communities now agree about escalating ecological outcomes from global warming . Multiple continental empirical studies have examined the role of rising temperatures combined with erratic rainfall systems in creating extensive modifications to soil humidity alongside plant vitality and surface vegetative patterns . The IPCC (warns that exceeding 2°C of global temperature rise will cause widespread natural ecosystem destruction. The World Bank reports Iraq will face a 9% annual rain reduction up to 2050, alongside a maximum 17% reduction happening throughout crucial agricultural seasons . Climate models predict that extreme heat occurrences will grow more common across regions where temperatures will rise above 50°C during daytime hours. The modifications in climate bring about desertification processes and reduced agricultural yields, along with higher water requirements, while causing land degradation. Ideologically, such research plays an essential role because it supports two primary Sustainable Development Goals known as SDG 13 (Climate Action) and SDG 15 (Life on Land), which emphasize urgent climate measures together with sustainable terrestrial ecosystem management.
The existing international studies form a large basis that explains how climate change affects land system transformations. According to (12) scientists created an international framework to measure vegetation degradation from acidification, while traced major vegetation losses in sub-Saharan Africa because of rain shortage and temperature rise. Eckert et al. , together with other scholars, showed that MODIS and NDVI remote sensing datasets provide a valuable method to monitor greenness dynamics and land degradation at various geographical levels. Research by different authors establishes concrete methodological and factual knowledge of vegetation index applications to evaluate environmental changes linked with climate. International climate assessments stress that sustained ecological monitoring enables scientists to detect changes and create management strategies for countering environmental deterioration.
Multiple research papers show that Iraq faces severe climate vulnerability because of its arid and semi-arid terrain. The combination of desertification threats with dust storms and water scarcity places Iraq among the most globally endangered nations. The reduction in flow from the Tigris and Euphrates Rivers, totaling 30-40%, stems from both climatic changes and upstream dam construction, according to . These two rivers supply more than 98% of the surface water to Iraq. The region that receives less than 300mm of annual rainfall accounts for more than 70% of Iraq, according to , which makes agricultural cultivation increasingly impractical. examined the expanding empty lands along with the breakdown of natural plant systems and worsened landscape conditions, which are caused by recurrent sandstorms damaging human health. The current lack persists in research that combines long-term assessments of climate variables with vegetation data to reveal the persistent state of degradation over time.
This study addresses an important knowledge deficit in academic and policy areas through its detailed investigation of climatic changes and their direct consequences on vegetation density and land degradation, which affected all of Iraq between 1981 and 2020. This research distinguishes itself from previous work by combining meteorological data with MODIS MOD13 products satellite imagery to calculate quantitative indicators for aridity, together with evapotranspiration levels, rainfall volatility, and vegetation health status. This research stands apart from other investigations by conducting an organized examination that spans the entire Iraqi territory in 252 images from 1981 to 2020. The study executes innovative data-collection methods to establish new environmental degradation insights regarding climate-vulnerable Iraq. The study's target is to provide vital data that will guide the creation of climate adaptation policies directed at sustainable land management while contributing to global academic insights about desertification solutions.
2. Materials and Methodology
2.1. Geographic Location and Climatic Conditions of Iraq
Iraq is in the southwest of Asia and the northeastern part of the Arab world, lying between two latitude circles, 37° - 29° north and 48° - 38° east longitude. Consistently, its extension from east to west is approximately equal in length from north to south. Iraq is classified as a dry and semi-arid region, which increases its environmental fragility, ecosystems, and biodiversity. The climate is characterized by hot and dry summers and rainy and cold winters. There is a significant difference between hot and cold temperatures from day to night, and notable variation between summer and winter temperatures. Precipitation amounts vary widely, ranging from more than 800mm in the northern regions to less than 100mm in the southern regions. Due to Iraq's geographical location, topography, and distance from large water bodies, its climate presents substantial challenges to various sectors, including industry. Most countries experience a continental and subtropical semi-arid to dry climate, with a Mediterranean climate prevalent except in the mountainous areas in the north and northeast. The average annual temperature in Iraq varies between 19.3°C in the north and 26.4°C in the alluvial plains of southern Iraq .
2.2. Datasets
2.2.1. Meteorological Data
A vital component for this investigation was the Climate Research Time (CRU-TS) dataset that delivered essential, detailed meteorological information to research climate change effects in Iraq. The CRU-TS dataset, with its 250 gridded stations operating at a 0.5-degree interval, permitted thorough climate investigations of Iraq from 1981 through 2020. A thorough quality control procedure was applied to this dataset, which established data reliability needed for accurate climate modelling, together with trend analysis . The researchers obtained essential climate variables, including monthly average maximum temperature, mean rainfall, and potential evapotranspiration (PET) from the CRU-TS dataset during the specific period. The data went through ArcGIS spatial analytical processes that resulted in the creation of yearly averages for each climatic variable. Results from spatial processing showed each parameter activity, including temperature changes and rainfall patterns, and PET measurements throughout Iraq over time. All analyses conducted on spatial variables (temperature, rainfall, evapotranspiration, and vegetation cover) covered Iraq on pixel maps. However, several points were selected to plot the graphs, and the trend value was determined. The maps generated help scientists understand the changes climate change creates across different regions while permitting identification of zones affected by droughts and other environmental stressors. The analysis of climate data through time series evaluation revealed the identification of growing temperatures plus diminishing precipitation, combined with accelerated evapotranspiration water loss. The data for the first decade (1981-1990) were used as a base line to calculate the differences of climate parameter between the decades as it was the moistest decade. The country experiences critical effects on vegetation density and land degradation, especially in its arid and semi-arid regions, because of these observed trends.
One essential element of this examination used the Aridity Index (AI) as an established United Nations Development Programme (UNDP) metric to evaluate dryness levels in regional areas . The Aridity Index represents a calculation that measures precipitation (P) against potential evapotranspiration (PET) rates and produces values from zero to one. A region shows greater humidity when its AI value is elevated because precipitation rates surpass evapotranspiration amounts, which allows for sufficient water resources to exist. A region presents an arid climate with water scarcity when its evapotranspiration exceeds precipitation, resulting in potential desertification according to a lower Aridity Index value.
This study effectively classified Iraq’s climate distribution by analyzing AI values, which offered detailed information about its aridity regions. A region with an AI value that exceeds 0.65 belongs to the humid category, which grants enough water resources to support plant life and agricultural growth. Places that have an AI value between 0.50 and 0.65 fall under semi-humid and semi-arid zones, which present average water supply yet still operate under rainfall variability. Arid regions exist within the AI scale of 0.20 to 0.50 because these areas suffer from severe water shortages, which are worsened by intense evapotranspiration rates. Regions show extreme dryness when their AI measurement equals 0.20 or below, thus experiencing extensive desertification along with scarce vegetation cover.
These categories help detect areas with high risk for desertification and land degradation since they show how rainfall interacts with plant moisture loss against water accessibility within ecosystems and agricultural activities. The study allows essential spatial understanding of climate impacts by creating aridity zone maps, which help define priority areas that need adaptation measures. The most arid regions of Iraq should have their land management practices sustainably promoted, along with vegetation restoration initiatives and improvements in water conservation methods.
Table 1. Aridity Index (AI) and its classifications.

Classification

Aridity Index

Hyper arid

AI < 0.05

Arid

0.05 < AI < 0.20

Semi-arid

0.20 < AI < 0.50

Dry sub-humid

0.50 < AI < 0.65

2.2.2. Satellite Data
The MODIS Vegetation Indices (MOD13) products were used with 252 satellite images that covered all Iraqi territory from 2000 to 2020 for thorough research to evaluate plant density evolution patterns nationwide. The analysis tracked vegetation changes throughout a lengthy period necessary for tracking land degradation patterns. NDVI stands as a common remote sensing index that the researchers used to precisely measure vegetation density in the study area. NDVI represents the difference between satellite imagery obtained from near-infrared (NIR) and red bands, which generates numerical values from -1 to +1. The NDVI measurement produces better results in healthy vegetation areas but shows poor values in places where vegetation is absent, and degenerates or land becomes barren. The research created a vegetative density distribution map of Iraq through NDVI analysis, which revealed different vegetative density zones, and the change in vegetation cover was calculated using a Mann-Kendall significance test. The research examined seasonal together with long-term plant changes via NDVI-based evaluation, which revealed vegetation health deterioration across areas suffering from serious desertification and land degradation. The NDVI is a normalized transformation of the ratio between near-infrared (NIR) and red reflectance, expressed as :
NDVI= NIR-RedNIR+Red(1)
A simple linear trend approach was applied to analyze possible trends in mean annual temperature, rainfall, and potential PET following the statistical significance tests or confidence limits, of Mann-Kendall, during the study period. This methodology allows for an assessment of how climatic factors have influenced vegetation dynamics and land degradation over time.
3. Results
3.1. Spatial and Temporal Changes of Annual Temperature in Iraq for the Period 1981-2020
Temperatures in Iraq exhibit substantial daily, seasonal, and long-term variations due to the country's geographical location. This positioning results in pronounced continental climatic conditions, ranging from extreme continental to very arid climates . The temperature distribution across Iraq is strongly influenced by topographical features, with elevation playing a significant role in shaping local climate conditions. Additionally, the type of air masses affecting the region contributes to temperature variations, further impacting the country's overall climate dynamics .
Table 2. Average Mean annual temperature in Iraq for the period 1981-2020.

Period

Min ºC

Max º

RANGE

Mean ºC

STD

Change Rate ºC/Decade

1981-1990

9.35

25.16

15.81

21.76

2.76

0.00

1991-2000

9.47

25.58

16.12

22.17

2.82

0.41

2001-2010

10.31

26.22

15.91

22.88

2.83

1.12

2011-2020

10.53

26.66

16.13

23.13

2.85

1.37

Generally, the results indicate a slight increase in the average mean annual temperatures over time for the period 1981-2020. As shown in Table 2, the average annual temperatures for the minimum, maximum, and range have increased significantly at 95% confidence according to the Mann-Kendall statistical test over the last four decades. Additionally, temperatures exhibit a spatial trend, increasing from the southern parts to the northern parts of Iraq. The total area with a high mean annual temperature (above 24°C) decreases from the Southern to the Northern regions of Iraq.
It is also observed that the range of mean annual temperature gradually decreases from the southwest toward the north and northeast of Iraq. These variations can be attributed to Iraq's absolute geographical location and topographical influences. Rising temperatures due to climate change negatively affect several soil properties and soil formation processes. These impacts include an accelerated decomposition of organic matter, a decline in soil moisture levels leading to soil degradation, and an increase in erosion activity, particularly in arid regions.
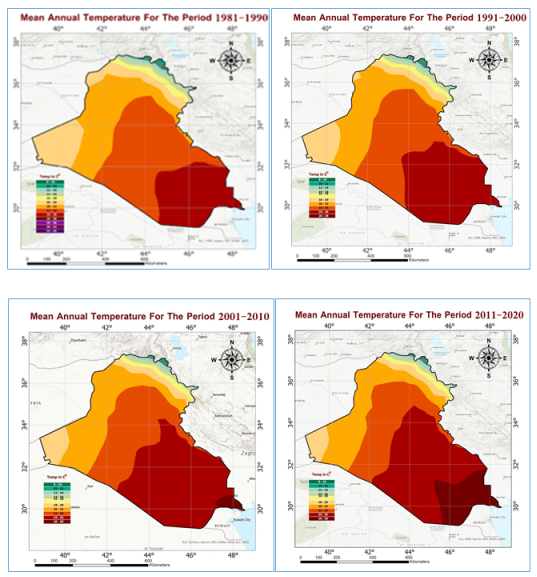
Figure 1. Spatial and Temporal Distribution of Average Mean Annual Temperature in Iraq from 1981 to 2020.
To calculate the average increase in mean annual temperature from 1981 to 2020, meteorological data from 1981 to 1990 were used as the baseline for comparison. This approach enabled an assessment of temperature variations over the four decades. Overall, the rate of increase in mean annual temperature indicates both temporal and spatial differences, ranging from 0.3°C to 1.7°C, with an average mean annual rise of 0.97 ºC/ decade (Table 3). The results (Figure 2) show a consistent decline in mean annual temperature from the southeast to the northwest. This trend is primarily due to higher relative humidity levels in northwestern Iraq, which is influenced by its proximity to the Mediterranean Sea and the related climatic conditions. The analysis confirms significant variations in both space and time regarding the rate of temperature increase throughout the study period, with notable differences observed among the three decades examined. The most recent decade (2011-2020) shows the highest temperature increase, ranging from 1.2°C to 1.7°C. In contrast, the period from 1991 to 2000 experienced the lowest increase, ranging from 0.3°C to 1.0°C. These findings emphasize the combined effects of natural and human-related factors that contribute to global warming and rising temperature across Iraq.
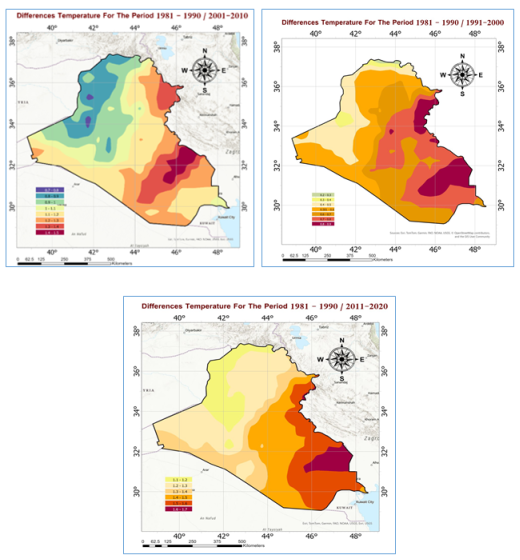
Figure 2. Temporal and Spatial distribution of temperature rise rate from 1981 to 2020.
Table 3. Temporal and spatial temperature rising rate for the last three decades.

1991-2000

2001-2010

2011-2020

Rising Rate ºC

Area (km²)

Rising Rate ºC

Area (km²)

Rising Rate ºC

Area%

0.30

1448.1

0.80

1838.3

1.2

12.22

0.40

9142.8

0.90

47577.7

1.3

28.02

0.50

64013.4

1.00

71791.3

1.4

14.43

0.60

104142.0

1.10

51418.0

1.5

20.65

0.70

105108.6

1.20

116930.6

1.6

19.91

0.80

108533.8

1.30

89096.0

1.7

4.77

0.90

43803.4

1.40

43639.5

1.00

208.9

1.50

14109.5

A straightforward statistical analysis shows both positive and negative trends in the increasing mean annual temperature over time (Figure 3). Some periods display a consistent rise in temperature, while others show only minor fluctuations. These trends reflect the impact of regional climatic factors and the larger dynamics of global climate change on Iraq's temperature patterns.
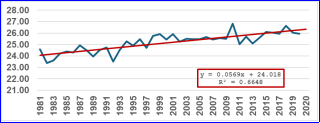
Figure 3. Statistical trend in mean annual temperature changes with time in Iraq from 1981 to 2020.
Additionally, projections from the World Meteorological Organization . suggest that global mean near-surface temperatures for the period from 2024 to 2028 are expected to be between 1.1°C and 1.9°C above the 1850-1900 baseline. This reinforces the urgent need for climate adaptation and mitigation strategies in the region. Given these trends, Iraq is likely to continue experiencing intensified heatwaves, prolonged droughts, and desertification. Therefore, it is essential to implement policy interventions, adopt sustainable land-use practices, and invest in climate resilience.
3.2. Analysis of the Spatial and Temporal Distribution of Mean Annual Rainfall from 1981 to 2020
Precipitation levels in Iraq show spatial and temporal variability, primarily due to the Mediterranean climate and the effect of geographic location. Rainfall typically starts in October, reaching its peak in December, January, and February. The results presented in Table 4 indicate a declining trend in the mean annual minimum, maximum, and average rainfall from 1981 to 2020. The mean annual minimum rainfall decreased slightly from 91.42mm in the first decade to 85.74mm in the last decade. In contrast, the mean annual maximum rainfall dropped from 736.16mm in the third decade to 671.33mm, before increasing again to 734.45mm in the final decade. Similarly, the average mean annual rainfall showed a pattern like that of the maximum rainfall amounts. These findings underscore the ongoing changes in Iraq's precipitation patterns, which have important implications for water resource management, agriculture, and efforts to control desertification. Additional research is needed to identify the main factors driving these changes, including climate change, shifts in regional atmospheric circulation, and human-induced environmental alterations.
Table 4. Changes in average annual rainfall in Iraq from 1981 to 2020.

Period

Minmm

Maxmm

RANGE

Meanmm

STD

Change Ratemm/decade

1981-1990

91.99

735.15

643.16

207.55

133.74

0.00

1991-2000

88.67

716.04

627.37

205.41

131.19

-0.14

2001-2010

89.17

658.67

569.50

189.41

118.33

-18.15

2011-2020

87.25

734.54

647.29

203.19

138.69

-4.37

Meteorological data (Table 5 and Figure 4) show the spatial distribution of average mean annual rainfall for the baseline period of 1981 to 1990, highlighting notable regional variations. During this time, Iraq's mean annual rainfall varied between 100mm and 800mm, with rainfall levels increasing as one moves north and northeast. The mountainous regions of Iraq receive over 700mm of rainfall annually, while the undulating areas average around 300mm. In contrast, Basra records an average of only 100mm. The western desert, including Rutba in western Iraq, receives less than 100mm of rainfall each year. More than 65% of Iraq's total land area receives less than 250mm of rainfall annually, particularly in the central and southern regions. Only 3.5% of the country, located in the central and southern regions. Only 3.5% of the country, located in the north, receives over 600mm of rainfall each year. According to , Iraq's rainfall is highly variable both seasonally and regionally. The northern and northeastern regions of Iraq receive the highest amounts of rainfall, ranging from 400 to 1,000mm per year, primarily between November and March. In contrast, the steppe region has an average annual precipitation of 200 to 400mm, while the southern areas receive only 40 to 60mm, mainly from October to December. These findings highlight the significant differences in precipitation patterns across Iraq, emphasizing the challenges of water scarcity faced by the central and southern regions
Table 5. Mean Annual Rainfall distribution in Iraq during the period 1981-1990.

Mean Rainfall (mm) 1981-1990

Area%

100

3.82

150

50.24

200

11.69

250

7.64

300

6.12

350

4.68

400

4,68

500

7/56

600

2.18

700

1.11

800

0.28

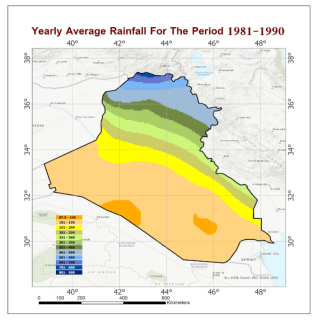
Figure 4. Spatial distribution of the average annual rainfall during 1981-1990.
A statistical analysis using a of rainfall data comparing the baseline period of 1981-1990 with subsequent decades shows both temporal and spatial variations in rainfall. The finding indicated an insignificant decline in the mean rainfall over time. The rates of change range from -9mm per year to +5mm per year. These variations differ from decade to decade throughout the period from 1981 to 2020 (Table 6 and Figure 5).
Table 6. Differences in the average annual rainfall for the period 1991-2020/1981-1990.

1991-2000

2001-2010

2011-2020

Rainfall

Area%

Water

Rainfall

Area%

Water

Rainfall

Area%

Water

Changes mm/y

Balance m.m³

Changes mm/y

Balance m.m³

Changes mm/y

Balance m.m³

-4

0.08

-13.61

-9

0.01

-2.22

-3

2.21

-288.76

-3

0.55

-71.71

-8

0.28

-98.51

-2

14.03

-1223.76

-2

5.75

-502.18

-7

2.31

-704.63

-1

22.62

-986.59

-1

28.84

-1258.84

-6

2.65

-695.33

0

47.55

0.00

0.0

28.39

0.00

-5

3.93

-858.69

1

10.42

454.51

1

13.14

573.43

- 4

4.22

-737.63

2

3.17

276.49

2

8.82

769.81

-3

5.68

-744.07

3

0.01

1.53

3

5.95

779.03

-2

16.38

-1430.42

4

8.25

1441.10

-1

26.45

-1154.50

5

0.23

50.78

0

24.36

0.00

1

13.71

599.09

Total

100

+1767.81

100

-5826.91

100

- 1766.58

The mean annual rainfall decreased insignificantly at 95% confidence according to Mann-Kendall statistical test over the periods 1991-2000, 2001-2010, and 2011-2020, with rates ranging from -4.0mm/year to +5.0mm/year, -9.0mm/year to +1.0mm/year, and -3.0mm/year to +3.0mm/year, respectively, with average mean decline rate of 7.55mm/decade. The results indicate that between 1991 and 2000, there was an increase in mean rainfall volume compared to the baseline, totaling +1,767.81 million m³ of water. However, during the periods from 2001 to 2010 and from 2011 to 2020, there were decreases of -5,826.91 million m³ and -1,766.58 million m³, respectively. This resulted in a total water loss of -7,593.49 million m³ due to declining rainfall, likely influenced by climate change over the past two decades. This significant reduction in water availability has substantial implications for the region. The mean annual rainfall trends show a decrease from 1991-2020, with rates ranging from -4.0mm/year to +5.0mm/year for 1991-2000, -9.0mm/year to +1.0mm/year for 2001-2010, and -3.0mm/year to +3.0mm/year for 2011-2020. The results show that from 1991 to 2000, there was an increase in mean rainfall volume compared to the baseline, with a gain of +1,767.81 million m³. However, the periods from 2001 to 2010 and from 2011 to 2020 experienced significant losses of -5,826.91 million m³ and -1,766.58 million m³, respectively. This led to a total water loss of -7,593.49 million m³, likely influenced by climate change over the past two decades. The substantial reduction in water availability poses significant implications for the region.
The southern part of Iraq exhibits positive precipitation change rates, but the northeastern areas demonstrate negative change rates according to Figure 5. The research demonstrates Iraq's precipitation pattern variations based on space and time, which demonstrates the comprehensive effects of climate change on regional water availability. The collected data shows different sections of Iraq are following diverse precipitation patterns due to opposing localized weather trends, which include minor growth in some zones yet substantial decrease in others. Senay demonstrated that Iraq experienced a reduction in its average yearly precipitation amount from 2003 to 2016, equivalent to 10mm, through findings that differed across Iraqi geographic zones. The data pattern matches those already found in prior research examinations. The World Bank has recorded major environmental changes in Iraq between the 1950s and the present, while reporting a wide range of rainfall patterns across its geographical areas. The northeastern part of Iraq showed rainfall elevation at 2.4mm per month over a century, while the southeast region had precipitation reduction at 0.88mm per month over a century. The western part of Iraq has witnessed substantial rainfall reduction at a rate of 5.93mm per month per century. The statistical analysis presented through Figure 6 confirms that Iraq's annual precipitation levels tend to decrease insignificantly at 95% confidence from 1981 to 2020. According to this figure, the total amount of rainfall steadily decreased during the studied period. The supplementary impacts of climate change have led to reduced precipitation because of changing weather patterns. Iraq faces additional difficulties in rainfall predictions because its geography consists of desert regions and semi-arid areas combined with various land altitudes. Located in the Middle East region, which shows maximum vulnerability to climate change, Iraq faces precipitation changes that affect different parts of the country at different levels.
The ongoing effects of global climate change have changed weather systems in Iraq by causing more dry seasons as well as unusual precipitation patterns. The changing rain patterns throughout semi-arid and arid zones worsen existing problems, including water shortage, together with land destruction and desertification. The decline of precipitation in certain areas leads to dual effects of diminished agricultural yields while intensifying water resource demand, which impacts all communities, including farmers and urban residents. Different regions throughout Iraq face unique climate challenges, which demand localized adaptation strategies to address their specific needs because rainfall reductions vary between areas.
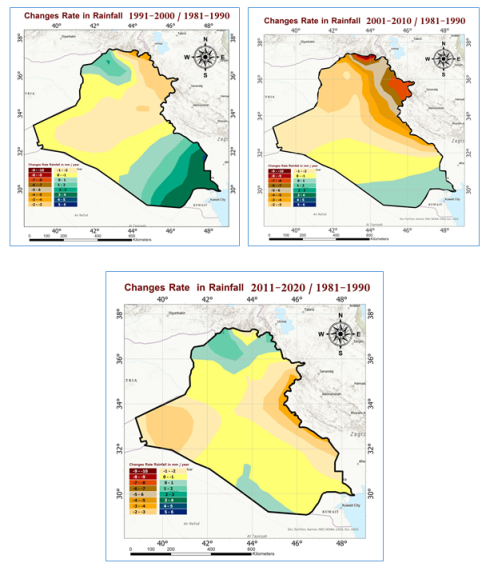
Figure 5. Spatial distribution of Differences in the average mean annual rainfall during the last three decades.
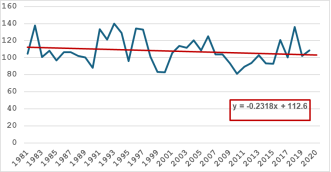
Figure 6. Statistical trend in mean annual rainfall changes with time in Iraq from 1981 to 2020.
3.3. Changes in the Temporal and Spatial Distribution of Mean Annual Evapotranspiration Rates from 1981 to 2020
Evapotranspiration (ET) contributes to the loss of a substantial amount of rainfall globally, with the percentage of loss varying by location . ET refers to the total evaporation that results from both soil evaporation and vegetation transpiration . It is essential for the energy and mass exchange among soil, water, plants, and the atmosphere, making it a critical factor in the hydrogeological budget . Evapotranspiration causes water and moisture loss from water, soil, and vegetation surfaces. It is a key component of any region's water balance and irrigation planning . Generally, 57% of precipitation returns to the atmosphere through evapotranspiration, and this amount may reach 90 to 100% in arid and hyper-arid regions .
The main climatic factors influencing evapotranspiration (ET) are solar radiation, wind speed, relative humidity, and temperature. Additionally, the type of vegetation and soil moisture levels play significant roles in determining ET rates . Evapotranspiration leads to the loss of water and moisture from water bodies, soil, and the surfaces of vegetation. As such, it is a crucial component of the water balance and essential for irrigation planning in any region. The average annual potential evapotranspiration (PET) in Iraq has shown a consistent increase over four decades, as indicated in Table 7. Specifically, the average annual PET rose from 1,995.37mm during the first decade (1981-1990) to 2,064.57mm in the last decade (2011-2020). This increase is primarily attributed to the rise in the mean annual temperature, as previously discussed. Moreover, the rise in actual evapotranspiration (ET) is affected by the growth of vegetation cover and surface water during hotter seasons, especially summer, when elevated temperatures lead to increased water loss.
Table 7. The average annual values of the minimum, maximum, and mean of PET in Iraq from 1981 to 2020.

Period

Minmm

Maxmm

Range

Mean mm

STD

Change Rate mm/decade

1981-1990

1032.60

2518.50

1485.90

1995.37

357.50

0.00

1991-2000

1040.40

2511.00

1470.60

2024.15

353.18

28.78

2001-2010

1061.10

2555.70

1494.60

2049.02

360.52

53.65

2011-2020

1080.90

2559.90

1479.00

2064.57

355.36

69.20

Table 8. Average mean annual values for PET in Iraq during the period 1981-2020.

1981-1990

1991 - 2000

2001 -2010

2011 - 2020

PET (mm)

Area (km²)

Total water lost (m.m³)

PET (mm)

Area (km²)

Total water lost (m.m³)

PET (mm)

Area (km²)

Total water lost (m.m³)

PET (mm)

Area (km²)

Total water lost (m.m³)

1200

6994.3

8393.1

1200

5578.0

6693.6

1200

4579.2

5495.1

1200

37245

4469.4

1400

24695.2

34573.3

1400

21416.6

29983.2

1400

19914.1

27879.7

1400

19129.0

26780.6

1600

32494.9

51991.8

1600

30619.5

48991.1

1600

30629.0

49006.4

1600

29118.0

46588.9

1800

39575.4

71235.7

1800

37636.5

67745.8

1800

37193.3

66947.9

1800

35190.8

63343.4

2000

96900.4

193800.8

2000

90404.8

180809.5

2000

84908.3

169816.6

2000

70453.2

140906.4

2200

89589.1

197095.9

2200

90552.8

199216.3

2200

87907.4

193396.3

2200

99733.0

219412.7

2400

85568.4

205364.1

2400

90456.4

217095.4

2400

85890.6

206137.5

2400

92836.6

222807.8

2600

60583.4

157516.9

2600

69736.4

181314.7

2600

85379.1

221985.6

2600

86215.9

224161.2

919971.6

931849.5

940665.0

948470.3

The results presented in Table 8 indicate that during the period from 1981 to 1990, less than 24% of Iraq's total area had a potential evapotranspiration (PET) value below 1,800mm, and this area decreased over time. In contrast, more than 61% of Iraq's total area had PET values ranging from 2,000 to 2,400mm during the same period. Additionally, areas with PET values exceeding 2,600mm accounted for 13.88% of the total land area in 1981-1990, which increased to 19.76% in the last decade.
The rising trend in water loss due to PET (Potential Evapotranspiration) spans from the northern regions to the southern parts of Basra Governorate. This variation is influenced by several factors, including temperature, vegetation density, soil moisture, wind speed, and the availability of surface water. Each of these parameters plays a significant role in determining the total water loss through soil evaporation and vegetation transpiration.
Generally, the results of statistical analysis using a Mann- Kendall statistical test indicated that the PET increases significantly at 95% confidence over time. The overall rising rate of average annual potential evapotranspiration (PET) ranges is 5054mm/decade during the period 1981-2020, with some variation across the four decades. These variations reflect differences in the total amount of water lost during each decade. When comparing the PET increase in the last three decades to the baseline data of the first decade (1981-1990), the rate of increase over time. Specifically, the rates ranged from 0-6mm/year, 3-9mm/year, and 4 to 10mm/year for the last three decades, respectively (Table 9 and Figure 7)
Table 9. Changes in the average annual PET for three decades from 1991 to 2020.

1991 -2000

2001 - 2010

2011 - 2020

Rising rate of PET (mm/y)

Area (km²)

Total amount water lost (m.m³)

Rising rate of PET (mm/y

Area (km²)

Total amount water lost (m.m³)

Rising rate of PET (mm/y

Area (km²)

Total amount water lost (m.m³)

0

10845.5

0

3

2246.0

67.4

4

5515.4

220.6

1

17167.7

171.6

4

53415.4

2136.6

5

27200.8

1360.0

2

51496.1

1029.6

5

116478.9

5824.0

6

84037.5

5042.3

3

136148.4

4083

6

138543.6

8312.6

7

107497.5

7524.8

4

159045.3

6359.5

7

98649.8

6905.4

8

107874.9

8630.0

5

61230.6

3060.4

8

23615.6

1889.3

9

81501.8

7335.2

6

467.4

28.0

9

3599.0

323.1

10

22773.1

2277.3

14732.2

25459.1

32390.2

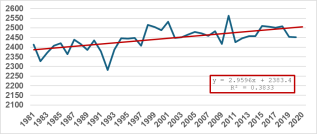
Figure 7. Statistical trend in mean annual PET changes with time in Iraq from 1981 to 2020.
The increase in potential evapotranspiration (PET) is evident from the differences in total water loss recorded during each decade. The amounts of total water loss are as follows: 14732.18 million m³, 25459.13 million m³, and 32390.20 million m³ for the last three decades, respectively. This significant loss of water through PET has adversely affected water availability in Iraq. The areas experiencing the highest levels of water loss are in the central governorates and their surrounding regions (Figure 8).
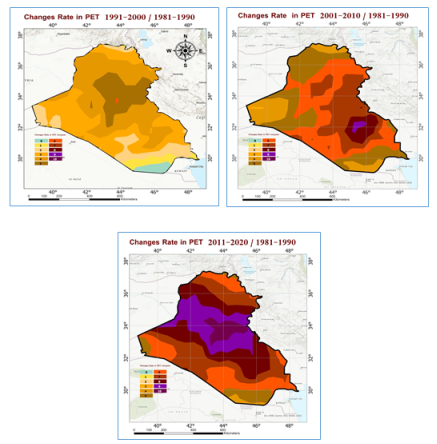
Figure 8. Spatial distribution of Differences in the average mean PET and water lost from 1981-2020.
3.4. Aridity Status in Iraq for the Period 1981-2020
Iraq is one of the countries significantly impacted by increasing aridity. Aridity is defined as a lack of moisture, often accompanied by a consistent shortage of rainfall. It describes a situation in which a region experiences a severe lack of available water, particularly due to the permanent absence of rainfall or extreme dryness resulting from insufficient precipitation. Aridity is measured by the Aridity Index (AI), which quantifies the level of dryness in a specific location. Recently, aridity events, exacerbated by climate change, have emerged as significant socio-environmental challenges. These events harm ecosystems and human livelihoods across various regions worldwide. Aridity continues to present a major and persistent challenge for many global regions. Four aridity classes were identified using gridded climatic data to calculate the AI for the period from 1981 to 2020, following the methodology outlined by . The results (Figure 9 and Table 10) indicate that Iraq predominantly experiences an arid climate, except for a small northern region classified as sub-humid. The dominant aridity zones are arid, hyper-arid, and semi-arid, encompassing more than 98% of Iraq's total area. Furthermore, the findings indicate temporal variations in the area covered by each aridity class, driven by changes in climatic conditions.
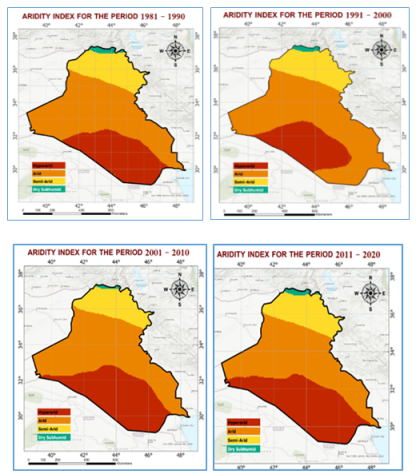
Figure 9. Spatial distribution of Aridity index in Iraq for the period 1981-2020.
Table 10. Change in Aridity classes in Iraq during the period 1981-2020.

Aridity class

1981-1990 Area%

1991-2000 Area%

2001-2010 Area%

2011-2020 Area%

Arid

54.47

60.44

51.43

47.09

Hyper Arid

28.00

23.00

34.11

36.73

Semi-Arid

16.33

15.65

14.04

15.22

Dry Sub humid_

1.20

0.91

0.42

0.97

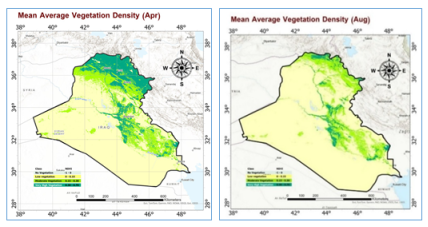
Figure 10. Spatial changes of the mean NDVI values in April (A) and August (B) during the period 2001-2020.
3.5. Impact of Climate Change on Vegetation Density and Land Degradation (2001-2020)
The Normalized Difference Vegetation Index (NDVI) is the most used method to assess vegetation cover, serving as an indicator of green biomass. The interaction between the Land surface and the atmosphere involves multiple processes and feedback mechanisms, all of which can vary simultaneously. Precipitation and temperature influence the potential distribution of terrestrial vegetation, play a crucial role in soil formation and evolution, and affect the timing of grazing, which historically supports a nomadic lifestyle. The study utilised NDVI measurements from the MODIS sensor to study vegetation densities and land degradative patterns throughout Iraq. A thorough examination of Iraq's vegetation development was achieved through satellite data acquisition from 2001 to 2020, monthly. Researchers computed NDVI values every month within the study period, emphasising April and August since these months let them analyse two main agricultural systems: winter cultivation through dry farming in the northern regions and irrigated farming in the southern regions and summer cultivation through primarily irrigated farming. Mean NDVI values between 2001 and 2020 confirmed extensive vegetation changes across different months through data presented in Figure 10 and Table 11. The seasonal agricultural methods employed by farmers create various changes that affect vegetation development alongside land condition degradation. The NDVI range from -1.0 to 0.70 permitted researchers to distinguish four vegetation density classes that categorised the land areas. Wetlands and water bodies, along with other non-vegetated land areas, account for 0.78% of Iraq's total land territory, even though they exist within the NDVI range of -1.0 to 0.0. The areas without substantial vegetation occur naturally because of flooding, along with human-caused bare land and water-filled regions. Most of Iraq (65.80%) constitutes the second category, which includes areas with low vegetation density and degradation over a wide extent. This zone contains territories with little vegetation because land degradation runs rampant within these regions. The detrimental combination of droughts that extend over long periods and desertification processes, together with damaging agricultural methods, prevents vegetation from growing sufficiently. The area containing moderate vegetation density amounts to 17.99% of Iraq's total landmass and falls within NDVI ranges from 0.15 to 0.30. Areas of moderate vegetation quantity fall under this class, which suggests agricultural lands or ecological restoration zones that need further development. Approximately 15.43% of Iraq’s land area falls within the NDVI range of 0.30 to 0.70, which indicates dense vegetation. The areas show solid vegetation growth, which stems from well-functioning ecosystems or appropriate land management approaches or because they possess climate conditions suitable for farming activities.
Table 11. Spatial changes in average mean annual NDVI values for April and August during the period 2001-2020.

NDVI class

April

August

Area (km²)

Area%

Area (km²)

Area%

- 1.0 to 0.0 (No vegetation)

3387.885847

0.78

3143.33

0.72

0.0 to 0.15 (V. low vegetation- degraded land)

287049.4562

65.80

352560.43

80.78

0.15 to 0.3 (Moderate Vegetation)

78494.53991

17.99

62433.10

14.31

0.3 to 0.7 (High Vegetation)

67327.11367

15.43

18295.16

4.19

Total

436.89

100

436.89

100

Overall, the total vegetated land area (moderate and high vegetation classes) in April (winter cultivation) was nearly double that of August (summer cultivation), covering 33.45% and 18.50% of Iraq's total area, respectively. The increase in vegetated land during the winter season is mainly attributed to higher soil moisture availability, increased rainfall, and reduced water loss through potential evapotranspiration (PET), which supports greater vegetation growth. The results show that much of Iraq's land undergoes temporary degradation, which can be alleviated by sufficient water availability. This is supported by seasonal variations in degraded land, with a greater percentage occurring in summer (August) due to reduced rainfall, increased water loss driven by potential evapotranspiration (PET), and drought conditions. The average annual changes in vegetation status and land degradation since the baseline year of 2000 (Figure 11 and Table 12) reveal seven distinct categories of change: no change, negative change, and positive change.
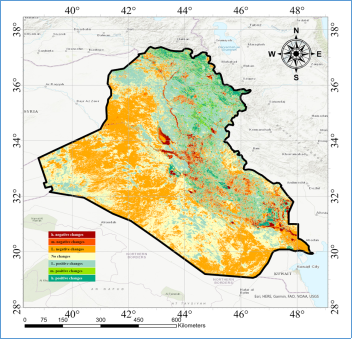
Figure 11. Spatial distribution of Average mean vegetation density-land Degradation changes from the mean of 2000 during the period 2000-2020.
Table 12. Average means of Vegetation density and land degradation change classes from the mean of 2000 in Iraq from 2000 to 2020.

Vegetation classes

Area (km)

Area%

H. Negative changes

7.624

1.75

M. Negative changes

10.953

2.51

L. Negative changes

156.698

35.91

No Changes

125.489

28.76

L. positive changes

100.770

23.09

M. positive changes

16.572

3.80

H. positive changes

18.294

4.19

Total

436.401

100.00

The results indicate that negative changes in vegetation were the dominant trend in vegetated areas during the study period, affecting 40.17% of Iraq's total land area. This decline is primarily attributed to reduced rainfall and prolonged drought conditions, which have accelerated the loss of vegetation and the processes of land degradation. In contrast, positive change classes represented 31.08% of the total land area, demonstrating the influence of agricultural practices, including both irrigated and dry farming, which led to an overall increase in vegetated land cover. The findings reveal that more than two-thirds (68.93%) of Iraq's total area has been affected by varying degrees of degradation due to climate change, resulting in increasingly arid conditions. The data confirm that Iraq's land is experiencing multiple forms of degradation, including physical, chemical, and biological deterioration. This is attributed to reduced rainfall, rising temperatures, and increased moisture loss due to potential evapotranspiration (PET). The findings (Figure 11) suggest that most degraded lands are primarily located in western Iraq, with other regions also experiencing water scarcity. This highlights the ongoing environmental crisis in Iraq, as desertification and land degradation continue to pose a threat to agricultural productivity.
4. Discussion
This research demonstrates that climate change rapidly impacts Iraq’s natural systems, creating significant challenges for agricultural practices, water resources, and biological stability throughout the region. The findings provide valuable insights into how increased temperatures coincide with decreased precipitation, intensified evapotranspiration, and expanding desertification that harm vegetation and land quality. These environmental changes reflect ongoing conditions in the Middle East and North Africa (MENA) region as well as in dryland and semi-arid ecosystems worldwide.
Iraq has experienced a rising annual mean temperature pattern that matches worldwide temperature increases during the past four decades (34). According to the Intergovernmental Panel on Climate Change , global warming develops from atmospheric greenhouse gas buildup that triggers extensive climate-related disruptions. The MENA region, alongside vulnerable areas including South Asia and sub-Saharan Africa, has demonstrated similar warming patterns, which resulted in reduced crop production, together with increased water loss through evapotranspiration and serious water shortages . The speed of temperature growth that Iraq experiences displays a clear southern bias, which expresses wider regional trends influenced by landforms and water bodies, plus atmospheric movements.
Precipitation variability serves as a crucial factor in this study, which strengthens the worries regarding hydrological stability in the region. Studies from India to China and the Sahel have confirmed that rainfall patterns are now more unpredictable and produce less rainfall during each wet season and throughout the year . The Mediterranean climate signature in Iraq demonstrates that rainfall arranges rainfalls into fewer frequent events while creating long dry periods between them. The effects of this situation negatively impact both soil fertility levels and groundwater recharge potential alongside conventional agricultural management.
The study reveals elevated evapotranspiration levels as the key indicator of worsening water balance deficit that scientists worldwide have started to recognize as a common pattern among affected regions. The Murray-Darling Basin of Australia and the United States share the same finding that increasing PET leads to lower soil moisture storage and causes agricultural harm through crop damage and worsening land conditions . The situation in Iraq demands urgent attention regarding these changes since the country depends on scarce water supplies, which will worsen due to increased PET rates and reduced precipitation levels.
The aridity study shows that dry and extremely dry areas have expanded during the decades, which supports previous global desertification model predictions. The United Nations Convention to Combat Desertification (UNCCD) identifies the widespread expansion of drylands as an acute and continuing effect of climate change, which endangers food systems alongside biodiversity and livelihood sustainability . Multiple studies have identified the same semi-arid to hyper-arid environmental transition, which affects large Iraqi territories as well as North African regions and Central Asian territories and western North American lands . The ecological situation in Iraq has become dangerous because the baseline remains weak despite previous damage from grazing animals and tree clearing, and ill-advised land management activities.
NDVI-based vegetation assessments reveal the extensive decline of vegetation along with rising degraded areas through seasonal changes in the data that highlight the sensitivity of rainfed and irrigated agriculture systems . Research from the Sahel and southern Europe, along with parts of the Indian subcontinent, displays verified evidence using satellite images over extended periods, which shows decreasing vegetation productivity because of rising temperatures combined with declining rainfall and human-caused environmental pressures . The elevated summer degradation in Iraq supports the development of seasonal discrepancies leading to problems for food security and crop scheduling, and agricultural resilience.
Researchers now agree that comprehensive land degradation models merge climate indicators with remote maps to analysis dynamic environments, although this study serves as an example of this developing thinking. Scientific research worldwide activates interdisciplinary methods to track complicated feedback patterns that link between environmental factors and land management practices, and ecosystem conditions . Iraq's circumstances provide essential attention to academic concepts because multiple interrelated natural conditions and human activities quickly destroy major environmental systems.
The study findings integrate with an increasing body of evidence which demonstrates proof of a global environmental crisis. Iraq demonstrates in the present day how climate change manifests its effects directly in dryland areas while producing sequential negative impacts on the management of water systems alongside agricultural production and local economies. Research outcomes show that immediate climate adaptation methods need to be developed through better water management systems and forest establishment projects and drought-resistant farming methods, and territory use coordination plans. Research investigations in the future must focus on developing forecast models that will predict future change patterns and create warning systems for climate-caused land degradation. The Iraqi case demonstrates crucial environmental trends which arid regions should prepare for during the next several decades, thus granting this study both national importance and international significance.
5. Conclusions and Recommendations
Iraq is experiencing rapid climate change, with an annual temperature increase rate of 0.95ºC/decade, making it one of the fastest-warming regions in the world. This temperature rise, coupled with decreased rainfall and increased soil moisture loss due to rising potential evapotranspiration (PET), has caused a significant decline in water availability, severely impacting vegetation health and reducing vegetation cover density. These climatic conditions are further accelerating desertification and land degradation, with disruptions to local water cycles intensifying the environmental challenges. Variability in rainfall patterns and rising temperatures have disturbed tghe balance between water inflow and outflow, leading to higher rates of evaporation and evapotranspiration, thereby worsening the effects of water scarcity and land degradation throughout the country. To address these challenges, preserving and restoring vegetative cover is essential. Greenbelt projects designed to prevent soil erosion and land degradation are crucial for maintaining soil fertility and ecosystem integrity. Furthermore, creating oases in desert and arid regions can play a pivotal role in mitigating the impacts of climate change on biodiversity by establishing microenvironments that sustain both vegetation and wildlife. Assisting farmers in areas vulnerable to desertification is also a key strategy to combat rural migration through the provision of drought-resistant crops, advanced irrigation technologies, and financial support to improve agricultural resilience. Additionally, constructing wastewater treatment systems for rural communities would ensure a sustainable source of irrigation-quality water, decreasing reliance on increasingly limited freshwater resources. However, it is important to acknowledge the limitations in the availability and accuracy of long-term climate data, which can hinder comprehensive assessments and predictions. Future research should focus on enhancing climate modelling and data collection in Iraq, particularly in the context of localised impacts and adaptation strategies, to better inform policy-making and improve the effectiveness of climate resilience initiatives in the region.
Abbreviations

AGC

Arab Gulf Countries

Acknowledgments
The authors would like to express their gratitude to the Kuwait Fund for Arab Economic Development (KFAED) for their financial contribution and their keen interest in fostering a better understanding of climate change and finding solutions to mitigate its impacts. This working paper is an output of the project titled “Improved Resilience against Transboundary Sand and Dust Storms in Kuwait and Southern Iraq.” The support provided by KFAED has been instrumental in advancing research and initiatives aimed at addressing the challenges posed by climate change in the region.
Author Contributions
Ahmad Salih Muhaimeed: Data curation, Formal Analysis, Investigation, Methodology, Resources, Supervision, Validation, Writing - original draft, Writing - review & editing
Mohamed Sobhi Nassar: Project administration, Writing - review & editing
Basem Ahmad Katalan: Data curation, Formal Analysis, Investigation, Methodology
Conflicts of Interest
The authors declare no conflicts of interest.
References
[1] Omenn GS (2006) Grand Challenges and Great Opportunities in Science, Technology, and Public Policy. Science 314: 1696-1704.
[2] Klare MT (2019) All hell breaking loose: The Pentagon’s perspective on climate change. Metropolitan Books.
[3] Tachiiri K, Su X, Matsumoto K (2021) Identifying key processes and sectors in the interaction between climate and socio-economic systems: a review toward integrating Earth-human systems. Prog Earth Planet Sci 8: 24.
[4] Mitigation CC (2011) IPCC special report on renewable energy sources and climate change mitigation. Renewable Energy 20.
[5] Muluneh MG (2021) Impact of climate change on biodiversity and food security: a global perspective-a review article. Agric & Food Secur 10: 36.
[6] Dadrass Javan F, Samadzadegan F, Toosi A, TousiKordkolaei H (2025) Spatial-temporal patterns of agricultural drought severity in the Lake Urmia Basin Iran: A cloud-based integration of multi-temporal and multi-sensor remote sensing data. DYSONA Appl Sci 6:.
[7] Monteverde C, Quandt A, Gilberto de Souza Ribeiro J, De Sales F (2024) Changing climates, changing lives: Voices of a Brazilian Amazon farming community in a time of climate crisis. PLOS Climate 3: e0000522.
[8] Seneviratne SI, Corti T, Davin EL, et al (2010) Investigating soil moisture-climate interactions in a changing climate: A review. Earth-Science Reviews 99: 125-161.
[9] Mulder VL, van Eck CM, Friedlingstein P, et al (2019) Controlling factors for land productivity under extreme climatic events in continental Europe and the Mediterranean Basin. Catena 182: 104124.
[10] IPCC (2021). Climate Change 2021: The Physical Science Basis.
[11] Hameedmm, Khalaf SM (2025) Climate Changes and Societal Stability in Iraq: Proposed Measures. Journal of Ecohumanism 4: 4712-4723.
[12] Yan Z, Guo Y, Sun B, et al (2024) Combating land degradation through human efforts: Ongoing challenges for sustainable development of global drylands. Journal of Environmental Management 354: 120254.
[13] Eckert S, Hüsler F, Liniger H, Hodel E (2015) Trend analysis of MODIS NDVI time series for detecting land degradation and regeneration in Mongolia. Journal of Arid Environments 113: 16-28.
[14] Al-Ansari N, Jawad S, Adamo N, Sissakian V (2019) Water quality and its environmental implications within Tigris and Euphrates rivers. Journal of earth sciences and geotechnical engineering 9: 57-108.
[15] Adamo N, Al-Ansari N, Sissakian V, et al (2022) Climate change: Droughts and increasing desertification in the Middle East, with special reference to Iraq. Engineering 14: 235-273.
[16] Hamad S, Alsanousi A (2024) Characterization of Post-uprising Impacts on Landcover and Land Use: Al Wasita-Satish-Area Northeast Libya Case Study. In: Al-Quraishi AMF, Mustafa YT (eds) Natural Resources Deterioration in MENA Region. Springer International Publishing, Cham, pp 73-91.
[17] Kihder SA (2014) Variation in the degree of Continentality climate of Iraq. Journal of the College of Education for Women 25.
[18] Awadh SM, Ahmad LM (2012) Climatic prediction of the terrestrial and coastal areas of Iraq. Arabian Journal of Geosciences 5: 465.
[19] Kumar A, Scaife AA, Merryfield WJ, et al (2024) World Meteorological Organization (WMO)-Accredited Infrastructure to Support Operational Climate Prediction. Bulletin of the American Meteorological Society 105: E2126-E2143.
[20] Haugevik KM, Kuusik P, Raik K, Schia NN (2021) Small States, Different Approaches Estonia and Norway on the UN Security Council. International Centre for Defence and Security; Estonian Foreign Policy Institute.
[21] Adamo N, Al-Ansari N, Sissakian VK, et al (2018) Climate change: consequences on Iraq’s environment. Journal of earth sciences and geotechnical engineering 8: 43-58.
[22] Rouse, J. W. Jr., R. H. Haas, D. W. Deering, J. A. Schell, and J. C. Harlan, 1974. Monitoring the Vernal Advancement and Retrogradation (Green Wave Effect) of Natural Vegetation, NASA/GSFC Type III Final Report, Greenbelt, MD., 371 p.
[23] IOM, Iraq (2022) Migration, environment, and climate change in Iraq. International Organization for Migration (IOM).
[24] Abtew W, Melesse A (2012) Evaporation and evapotranspiration: measurements and estimations. Springer Science & Business Media.
[25] Running SW, Mu Q, Zhao M, Moreno A (2017) MODIS global terrestrial evapotranspiration (ET) product (NASA MOD16A2/A3) NASA earth observing system MODIS land algorithm. NASA: Washington, DC, USA.
[26] Senay GB, Leake S, Nagler PL, et al (2011) Estimating basin scale evapotranspiration (ET) by water balance and remote sensing methods. Hydrological Processes 25: 4037-4049.
[27] Bastiaanssen WGM, Noordman EJM, Pelgrum H, et al (2005) SEBAL Model with Remotely Sensed Data to Improve Water-Resources Management under Actual Field Conditions. J Irrig Drain Eng 131: 85-93.
[28] Agnew C, Anderson E (2024) Water resources in the arid realm. Routledge.
[29] Huang J, Li Y, Fu C, et al (2017) Dryland climate change: Recent progress and challenges. Reviews of Geophysics 55: 719-778.
[30] Alam A, Bhat MS, Maheen M (2020) Using Landsat satellite data for assessing the land use and land cover change in Kashmir valley. GeoJournal 85: 1529-1543.
[31] Granger RJ (2000) Satellite-derived estimation of evapotranspiration in the Gedis basin. J Hydrol 229: 70-76.
[32] Heidarnejad M, Zare Arani M, Pakparvar M (2013) Determining the accuracy of the SEBS model for evapotranspiration in Yazd. J Geographic Explorations of Desert Areas. 1: 1-16.
[33] MacPherson R (2019) Land Degradation Neutrality Target Setting Project-Report of the terminal evaluation. < bound method Organization. get_name_with_acronym of< Organization: United.
[34] Seyuba K, O’Driscoll D, Tarif K, et al (2023) Climate, Peace and Security Fact Sheet: Iraq (Updated).
[35] Salman SA, Shahid S, Ismail T, et al (2019) Characteristics of Annual and Seasonal Trends of Rainfall and Temperature in Iraq. Asia-Pacific J Atmos Sci 55: 429-438.
[36] Alrteimei HA, Ash’aari ZH, Muharram FM (2022) Last decade assessment of the impacts of regional climate change on crop yield variations in the Mediterranean region. Agriculture 12: 1787.
[37] Moisa M, Karuppannan S, Wong Y, Khaddour L (2025) Urban agriculture land suitability assessment using AHP and geospatial analysis in Gondar Zuria Ethiopia. DYSONA Appl Sci 6:.
[38] Zhang Q, Singh VP, Sun P, et al (2011) Precipitation and streamflow changes in China: changing patterns, causes and implications. Journal of Hydrology 410: 204-216.
[39] Turner BL, Lambin EF, Reenberg A (2007) The emergence of land change science for global environmental change and sustainability. Proc Natl Acad Sci USA 104: 20666-20671.
[40] Roy P, Pal SC, Chakrabortty R, et al (2022a) Climate change and groundwater overdraft impacts on agricultural drought in India: Vulnerability assessment, food security measures and policy recommendation. Science of The Total Environment 849: 157850.
[41] Chakrabortty R, Pramanik M, Ali T, et al (2025) Advanced Neural Network Approaches for Optimal Check Dam Site Selection in Sub-Tropical Climates. Advances in Space Research S0273117725003734.
[42] Al-Kaisimm, Elmore RW, Guzman JG, et al (2013) Drought impact on crop production and the soil environment: 2012 experiences from Iowa. Journal of Soil and Water Conservation 68: 19A-24A.
[43] Dadzie FA, Egidi E, Stewart J, et al (2023) Agricultural Soil Degradation in Australia. In: Pereira P, Muñoz-Rojas M, Bogunovic I, Zhao W (eds) Impact of Agriculture on Soil Degradation I. Springer International Publishing, Cham, pp 49-68.
[44] Jain S, Srivastava A, Khadke L, et al (2024) Global-scale water security and desertification management amidst climate change. Environ Sci Pollut Res 31: 58720-58744.
[45] Lioubimtseva E, Cole R, Adams JM, Kapustin G (2005) Impacts of climate and land-cover changes in arid lands of Central Asia. Journal of Arid Environments 62: 285-308.
[46] Prăvălie R (2016) Drylands extent and environmental issues. A global approach. Earth-Science Reviews 161: 259-278.
[47] Pal SC, Chakrabortty R, Malik S, Das B (2018) Application of forest canopy density model for forest cover mapping using LISS-IV satellite data: a case study of Sali watershed, West Bengal. Model Earth Syst Environ 4: 853-865.
[48] Malik S, Pal SC, Das B, Chakrabortty R (2019) Intra-annual variations of vegetation status in a sub-tropical deciduous forest-dominated area using geospatial approach: a case study of Sali watershed, Bankura, West Bengal, India. Geology, Ecology, and Landscapes 1-12.
[49] Das N, Chakrabortty R, Pal SC, et al (2023) A novel coupled framework for detecting hotspots of methane emission from the vulnerable Indian Sundarban mangrove ecosystem using data-driven models. Science of The Total Environment 866: 161319.
[50] Bhaga TD, Dube T, Shekede MD, Shoko C (2020) Impacts of climate variability and drought on surface water resources in Sub-Saharan Africa using remote sensing: A review. Remote Sensing 12: 4184.
[51] Pal SC, Chakrabortty R, Arabameri A, et al (2022) Chemical weathering and gully erosion causing land degradation in a complex river basin of Eastern India: an integrated field, analytical and artificial intelligence approach. Nat Hazards 110: 847-879.
[52] Huggi L, Thimmegowda MN, Sridhara S, et al (2024) Climate Change-Induced Spatiotemporal Monsoon Variability: Assessment of Its Implications on Global and Regional Production Systems. In: Pathak H, Chatterjee D, Saha S, Das B (eds) Climate Change Impacts on Soil-Plant-Atmosphere Continuum. Springer Nature Singapore, Singapore, pp 713-758.
[53] Roy P, Pal SC, Chakrabortty R, et al (2024) Climate change and geo-environmental factors influencing desertification: a critical review. Environ Sci Pollut Res.
[54] Roy P, Pal SC, Chakrabortty R, et al (2022b) Impact of ineffective measures on the increasing land degradation in a monsoon‐dominated region of India: Issues and policy implications. Land Degradation & Development 33: 3174-3185.
Cite This Article
  • APA Style

    Muhaimeed, A. S., Nassar, M. S., Katalan, B. A. (2025). The Threat of Climate Change to Vegetation Health and Land Degradation in Iraq's Diverse Climatic Environment. American Journal of Agriculture and Forestry, 13(4), 198-217. https://doi.org/10.11648/j.ajaf.20251304.14

    Copy | Download

    ACS Style

    Muhaimeed, A. S.; Nassar, M. S.; Katalan, B. A. The Threat of Climate Change to Vegetation Health and Land Degradation in Iraq's Diverse Climatic Environment. Am. J. Agric. For. 2025, 13(4), 198-217. doi: 10.11648/j.ajaf.20251304.14

    Copy | Download

    AMA Style

    Muhaimeed AS, Nassar MS, Katalan BA. The Threat of Climate Change to Vegetation Health and Land Degradation in Iraq's Diverse Climatic Environment. Am J Agric For. 2025;13(4):198-217. doi: 10.11648/j.ajaf.20251304.14

    Copy | Download

  • @article{10.11648/j.ajaf.20251304.14,
      author = {Ahmad Salih Muhaimeed and Mohamed Sobhi Nassar and Basem Ahmad Katalan},
      title = {The Threat of Climate Change to Vegetation Health and Land Degradation in Iraq's Diverse Climatic Environment
    },
      journal = {American Journal of Agriculture and Forestry},
      volume = {13},
      number = {4},
      pages = {198-217},
      doi = {10.11648/j.ajaf.20251304.14},
      url = {https://doi.org/10.11648/j.ajaf.20251304.14},
      eprint = {https://article.sciencepublishinggroup.com/pdf/10.11648.j.ajaf.20251304.14},
      abstract = {The fifth-ranking position determines that Iraq is one of the nation’s facing extreme climate difficulties. Iraq fights against the increase in heat while coping with a lack of precipitation and intensifying dry spells, in addition to facing water shortages and land degradation, along with recurring dust storms. Extreme climate changes have a major impact on environmental stability and farming output, as well as the overall sustainability of the system. This study uses global meteorological data combined with satellite imagery to study the climatic parameter transformations in Iraq from 1981 to 2020, as well as their consequences on water balance, vegetation growth, and land degradation. The research analyses MODIS Vegetation Indices (MOD13) together with 252 satellite images throughout Iraq, starting from 2000 to 2020. Research data helped determine spatial-temporal changes regarding land degradation and vegetation density alongside their relationship to climatic elements. Key climatic variables demonstrate both time-dependent and geographic changes across Iraq between 1981 and 2020, which impact vegetation maintenance while leading to land degradation. The research findings demonstrate concerning temperature growth that average of 0.97°C/decade, because this rapid temperature increase worsens environmental destruction. Rain levels in Iraq have been decreasing throughout the years, until more than 70% of the country receives between 100 to 300mm of annual rainfall. The reduced precipitation has led to rising evapotranspiration losses that amounted to 14,732.18 million m3 in the second decade, followed by 25,459.13 million m3 in the third decade, and finally reaching 32,390.20 million m3 in the fourth decade compared to the first decade. The increased aridity index forces greater adverse impacts on vegetation density, which leads to faster land degradation. The widespread destruction of Iraq's natural lands has reached more than 68% because of desertification processes. The rising climate change dangers to Iraqi ecosystems require immediate adaptations for combating desertification and enhancing land administration methods.},
     year = {2025}
    }
    

    Copy | Download

  • TY  - JOUR
    T1  - The Threat of Climate Change to Vegetation Health and Land Degradation in Iraq's Diverse Climatic Environment
    
    AU  - Ahmad Salih Muhaimeed
    AU  - Mohamed Sobhi Nassar
    AU  - Basem Ahmad Katalan
    Y1  - 2025/08/15
    PY  - 2025
    N1  - https://doi.org/10.11648/j.ajaf.20251304.14
    DO  - 10.11648/j.ajaf.20251304.14
    T2  - American Journal of Agriculture and Forestry
    JF  - American Journal of Agriculture and Forestry
    JO  - American Journal of Agriculture and Forestry
    SP  - 198
    EP  - 217
    PB  - Science Publishing Group
    SN  - 2330-8591
    UR  - https://doi.org/10.11648/j.ajaf.20251304.14
    AB  - The fifth-ranking position determines that Iraq is one of the nation’s facing extreme climate difficulties. Iraq fights against the increase in heat while coping with a lack of precipitation and intensifying dry spells, in addition to facing water shortages and land degradation, along with recurring dust storms. Extreme climate changes have a major impact on environmental stability and farming output, as well as the overall sustainability of the system. This study uses global meteorological data combined with satellite imagery to study the climatic parameter transformations in Iraq from 1981 to 2020, as well as their consequences on water balance, vegetation growth, and land degradation. The research analyses MODIS Vegetation Indices (MOD13) together with 252 satellite images throughout Iraq, starting from 2000 to 2020. Research data helped determine spatial-temporal changes regarding land degradation and vegetation density alongside their relationship to climatic elements. Key climatic variables demonstrate both time-dependent and geographic changes across Iraq between 1981 and 2020, which impact vegetation maintenance while leading to land degradation. The research findings demonstrate concerning temperature growth that average of 0.97°C/decade, because this rapid temperature increase worsens environmental destruction. Rain levels in Iraq have been decreasing throughout the years, until more than 70% of the country receives between 100 to 300mm of annual rainfall. The reduced precipitation has led to rising evapotranspiration losses that amounted to 14,732.18 million m3 in the second decade, followed by 25,459.13 million m3 in the third decade, and finally reaching 32,390.20 million m3 in the fourth decade compared to the first decade. The increased aridity index forces greater adverse impacts on vegetation density, which leads to faster land degradation. The widespread destruction of Iraq's natural lands has reached more than 68% because of desertification processes. The rising climate change dangers to Iraqi ecosystems require immediate adaptations for combating desertification and enhancing land administration methods.
    VL  - 13
    IS  - 4
    ER  - 

    Copy | Download

Author Information
  • Abstract
  • Keywords
  • Document Sections

    1. 1. Introduction
    2. 2. Materials and Methodology
    3. 3. Results
    4. 4. Discussion
    5. 5. Conclusions and Recommendations
    Show Full Outline
  • Abbreviations
  • Acknowledgments
  • Author Contributions
  • Conflicts of Interest
  • References
  • Cite This Article
  • Author Information