Abstract
This comprehensive study delves deeply into the intricate process of optimizing fish product distribution routes in the expansive Western Kenya region, with an explicit focus on understanding and refining the operational strategies employed by Victory Farm Limited. Leveraging the Hungarian Method, celebrated for its unparalleled effectiveness in the realm of combinatorial optimization, the research endeavors to meticulously evaluate and fine-tune the shortest and most efficient transportation routes for seamlessly ferrying fish products from Kisumu Logistic Center to a myriad of distribution depots and retail markets scattered across the Western Kenya region's diverse landscape. Through an exhaustive analysis that spans road networks, logistical constraints, and the ever-evolving dynamics of market demand, this study systematically identifies and delineates optimal routes that not only minimize the distance traversed but also significantly mitigate associated transportation costs, all while steadfastly adhering to stringent standards for punctuality and product quality. Furthermore, by synergistically integrating sophisticated mathematical modeling techniques, meticulously executed through Python programming, with a robust foundation of real-world data meticulously sourced from Victory Farm Limited, this research endeavors to provide invaluable insights and pragmatic recommendations aimed at fortifying and enhancing the overall efficiency and profitability of fish product distribution operations throughout Victory Farm Western Kenya depots. In essence, the anticipated outcomes of this study transcend the realm of theoretical conjecture, poised instead to catalyze tangible advancements in the sustainable development of the region's burgeoning aquaculture sector, thereby fostering a lasting legacy of economic prosperity and environmental stewardship for generations to come.
Keywords
Hungarian, Optimization, Transportation
1. Introduction
The distribution of fish products plays a vital role in the economic development and food security of regions with significant aquaculture and fishing industries
| [11] | Pradeepkiran, J. A. (2019). Aquaculture role in global food security with nutritional value: a review. Translational Animal Science, 3(2), 903-910. |
[11]
. In Western Kenya, where the aquaculture sector has been rapidly expanding in recent years, optimizing the distribution routes of fish products is crucial for maximizing efficiency and reducing costs. Efficient distribution routes not only ensure the timely delivery of fresh fish to consumers but also contribute to the sustainability of the supply chain by minimizing transportation-related losses and environmental impacts. Therefore, there is a pressing need to evaluate and optimize the shortest routes possible for the distribution of fish products in the Western Kenya region.
The significance of optimizing distribution routes in the context of the fish industry is underscored by the challenges posed by the perishable nature of fish products and the geographical characteristics of the region
| [13] | Sultan, F. A., Routroy, S., & Thakur, M. (2023). Understanding fish waste management using bibliometric analysis: A supply chain perspective. Waste Management & Research, 41(3), 531-553. |
[13]
. Fish, being highly perishable, require swift transportation from production sites to consumer markets to maintain their freshness and quality. Moreover, Western Kenya's diverse terrain, including rural areas with underdeveloped infrastructure and limited access to transportation networks, presents additional challenges in ensuring efficient distribution of fish products
| [14] | Thorpe, A., Nahdy, S., & Omondi, S. (2018). Kenya Aquaculture Value Chain Overview. WorldFish. |
[14]
. Addressing these challenges requires a systematic evaluation of transportation routes to identify the shortest paths that minimize both distance and travel time while considering the constraints imposed by infrastructure and logistics.
According to
| [3] | Dalsgaard, J. P. T., Dickson, M., Jagwe, J., & Longley, C. (2012). Uganda aquaculture value chains: strategic planning mission report. Ford, L. R., & Fulkerson, D. R. (1962). Flows in Networks. Princeton University Press. |
[3]
, optimizing distribution routes for fish products aligns with broader objectives of enhancing agricultural value chains and promoting economic growth in Kenya. The aquaculture sector has been identified as a key driver of economic development, contributing to food security, poverty alleviation, and job creation in the country
| [4] | FAO. (2020). Kenya: Aquaculture Country Profile. Food and Agriculture Organization of the United Nations. |
[4]
. By improving the efficiency of fish product distribution, it is possible to unlock the full potential of the aquaculture industry in Western Kenya, thereby stimulating economic activity, increasing incomes for fish farmers and traders, and improving livelihoods for rural communities
| [10] | Njiru, J. M., Gichuki, J., & Kengere, A. (2019). Fish Trade in Kenya: Analysis of the Fish Value Chain in Kenya. African Journal of Business and Management, 3(1), 1-17. |
[10]
. Therefore, the evaluation of the shortest route possible in fish product distribution holds significant implications for the socioeconomic development of the region.
In light of these considerations, this study aims to conduct a comprehensive evaluation of the shortest route possible for the distribution of fish products in the Western Kenya region. By leveraging Geographic Information Systems (GIS), mathematical optimization techniques, and empirical data on transportation networks and market demand, the research seeks to identify optimal distribution routes that minimize transportation costs, reduce delivery times, and ensure the freshness and quality of fish products. Through this endeavor, the study intends to contribute valuable insights and practical recommendations for enhancing the efficiency and sustainability of fish product distribution in Western Kenya, thereby supporting the growth and development of the aquaculture sector in the region.
In the dynamic landscape of agricultural and food distribution systems, optimizing transportation routes is fundamental for ensuring efficient delivery of perishable goods and minimizing operational costs
| [9] | Nagurney, A., Yu, M., Masoumi, A. H., & Nagurney, L. S. (2013). Networks against time: Supply chain analytics for perishable products. Springer Science & Business Media. |
[9]
. Within the Western Kenya region, where aquaculture has emerged as a significant economic driver, the distribution of fish products presents unique logistical challenges due to the region's diverse terrain and varying levels of infrastructure development. The evaluation of the shortest route possible in fish product distribution is imperative for enhancing the competitiveness and sustainability of the aquaculture sector in the region, particularly with the rising demand for fresh fish products both domestically and internationally.
According to
| [5] | Feinen, C. (2016). Object Representation and Matching Based on Skeletons and Curves (Vol. 40). Logos Verlag Berlin GmbH. |
[5]
Hungarian Method refers to a combinatorial optimization algorithm used to solve assignment problems, such as determining the shortest route for distributing fish products. This method efficiently identifies the optimal assignment of tasks, in this case, determining the most cost-effective route for transporting fish from production centers to distribution hubs and retail markets. The Hungarian Method has been widely utilized in logistics and transportation planning due to its ability to find the best solution in polynomial time
| [7] | Kuhn, H. W. (1955). The Hungarian method for the assignment problem. Naval Research Logistics Quarterly, 2(1‐2), 83-97. |
[7]
. By applying this mathematical technique, Victory Farm Limited (VF) can minimize transportation costs and optimize route efficiency, ultimately enhancing the overall performance of its supply chain operations.
In addition, the Traveling Salesman Problem, which is a classic optimization problem relevant to Victory Farm's distribution network. In this context, TSP refers to finding the shortest possible route that visits a set of given locations (in this case, Victory Farm's depots across Western Kenya) exactly once and returns to the starting point. The objective is to minimize the total distance traveled by the delivery vehicles while ensuring that all destinations are visited. TSP has significant applications in transportation logistics, including route planning and vehicle scheduling
| [1] | Applegate, D. L., Bixby, R. E., Chvátal, V., & Cook, W. J. (2007). The Traveling Salesman Problem: A Computational Study. Princeton University Press. |
[1]
. By addressing the TSP within its distribution network, Victory Farm Limited can improve route efficiency, reduce fuel consumption, and enhance the timely delivery of fish products to customers, thereby maximizing operational efficiency and customer satisfaction.
Victory Farm Limited stands as a prominent player in the aquaculture industry within Western Kenya, with a focus on tilapia production. As a key stakeholder in the region's fish supply chain, Victory Farm Limited serves as a prime candidate for applying innovative techniques to optimize distribution routes and streamline operations. The Hungarian Method, a combinatorial optimization algorithm renowned for its efficiency in solving transportation and assignment problems, presents a promising approach for determining the shortest routes in fish product distribution
| [7] | Kuhn, H. W. (1955). The Hungarian method for the assignment problem. Naval Research Logistics Quarterly, 2(1‐2), 83-97. |
[7]
. By integrating this mathematical technique with real-world data specific to Victory Farm Limited's distribution network, this study aims to provide actionable insights for improving the efficiency and cost-effectiveness of fish product distribution in Western Kenya.
The evaluation of distribution routes using the Hungarian Method offers a systematic approach to address the complex spatial and logistical challenges inherent in fish product distribution
| [15] | Yadav, V. S., Singh, A. R., Gunasekaran, A., Raut, R. D., & Narkhede, B. E. (2022). A systematic literature review of the agro-food supply chain: Challenges, network design, and performance measurement perspectives. Sustainable Production and Consumption, 29, 685-704. |
[15]
. By considering factors such as distance, travel time, road conditions, and logistical constraints, this method facilitates the identification of optimal routes that minimize transportation costs while ensuring timely delivery and product quality. Moreover, the application of this technique enables stakeholders to make informed decisions regarding route planning, resource allocation, and supply chain management, thereby enhancing the overall competitiveness and resilience of the aquaculture sector in Western Kenya
| [6] | Food and Agriculture Organization of the United Nations (FAO). (2020). Kenya: Aquaculture Country Profile. FAO Fisheries and Aquaculture Department. |
[6]
.
Furthermore, the outcomes of this study hold broader implications for sustainable development, economic growth, and food security in Western Kenya. Efficient distribution routes not only contribute to reducing post-harvest losses and improving market access for fish farmers but also stimulate economic activity along the supply chain, creating employment opportunities and fostering socioeconomic development in rural communities
| [4] | FAO. (2020). Kenya: Aquaculture Country Profile. Food and Agriculture Organization of the United Nations. |
[4]
. By leveraging innovative approaches such as the Hungarian Method and collaborating with key industry stakeholders like Victory Farm Limited, policymakers and practitioners can work towards building a more resilient and inclusive agricultural sector that harnesses the full potential of aquaculture for driving positive change in the Western Kenya region.
VF Western Kenya Branches Delivery Plans
The harvest of fish at Victory Farm's, the processing phase occurs directly at the farm site. This integrated approach to processing allows for immediate handling of the freshly harvested fish, minimizing delays and maintaining the quality of the product. At the farm processing facilities, the fish undergo cleaning, gutting, and packaging according to industry standards. By conducting processing activities on-site, Victory Farm Limited ensures that the fish are prepared for transportation efficiently and in a manner that preserves their freshness and integrity throughout the supply chain.
Subsequently, the processed fish products are transported to the Kisumu Logistics Center (KLC), which serves as a central hub for further aggregation and distribution. Upon arrival at KLC, the fish products are stored in cold rooms to maintain their freshness before being dispatched to Victory Farm's depots across the Western Kenya region. The distribution is facilitated by delivery cars, which transport the fish to various depots strategically located to serve local markets and retail outlets. This centralized distribution network allows Victory Farm Limited to effectively manage inventory and meet the demands of customers in different regions of Western Kenya, ensuring timely and reliable access to high-quality fish products. Overall, the integration of on-farm processing with centralized distribution through KLC and delivery cars optimizes the efficiency and effectiveness of Victory Farm's supply chain, enhancing customer satisfaction and market competitiveness.
The establishment of a centralized logistics center like KLC serves as a strategic hub for aggregating and storing fish products before further distribution to retail markets and other end consumers
| [12] | Scudder, T. T. (2012). The future of large dams: Dealing with social, environmental, institutional and political costs. Routledge. |
[12]
. This approach streamlines the logistics operations of Victory Farm Limited, allowing for better inventory management and coordination of transportation activities. Additionally, the utilization of a cold room at the logistics center underscores the company's commitment to maintaining the freshness and quality of its fish products, thereby meeting the stringent demands of consumers for high-quality seafood in the Western Kenya region.
2. Phases of the Hungarian Method
The Hungarian Method employs a two-phase approach to solve assignment problems efficiently
| [7] | Kuhn, H. W. (1955). The Hungarian method for the assignment problem. Naval Research Logistics Quarterly, 2(1‐2), 83-97. |
[7]
. In the initial phase, the method involves conducting row reductions and column reductions to simplify the problem. This step aims to identify potential assignments and reduce the overall complexity of the problem. Once the reductions are completed, the second phase begins, where the solution is optimized through iterative processes. In this phase, the method iteratively evaluates and adjusts assignments to minimize costs or distances, gradually converging towards the optimal solution. By following these two distinct phases, the Hungarian Method provides a systematic and effective approach to solving assignment problems, ensuring accurate and efficient allocation of resources.
Step 1: Consideration of the Given Distance Matrix Model
A=
Step 2: Adjustment for Rectangular Matrices
In cases where the number of rows is not equal to the number of columns or vice versa in the given problem, a dummy row or column is introduced. The assignment costs for these dummy cells are uniformly set to zero, ensuring consistency in the matrix structure.
Step 3: Matrix Reduction Procedure
The matrix is systematically reduced by selecting the minimum element in each row and subtracting it from other elements within that row. This reduction process simplifies the matrix by diminishing the values, facilitating subsequent computations for optimal assignment.
Step 4: Column-wise Matrix Reduction
The new matrix is further reduced column-wise using the same method as outlined in Step 3, focusing on the smallest element in each column that does not contain zero. This iterative reduction process ensures the continued simplification of the matrix, enhancing the efficiency of subsequent computations.
Step 5: Optimality Assessment
An assessment is made to determine optimality by drawing the minimum number of lines required to cover all zeros in the matrix. This step evaluates the current state of the matrix and its alignment with the desired optimal solution.
Step 6: Decision Point
If the number of lines drawn equals the total number of rows or columns (n), indicating optimality, the process proceeds to Step 9. However, if the lines drawn are fewer than n, suggesting further refinement is needed, the process advances to Step 7 for additional adjustments.
Step 7: Iterative Refinement
Identify the minimum element in the entire matrix that is not covered by lines. Subtract this minimum element from all other remaining elements not covered by lines, and add at the intersection of lines. Elements covered by a single line remain unchanged. Repeat Steps 5 and 6 sequentially until optimality is achieved.
Step 8: Zero Allocation and Iterative Assignment
Select any row or column containing a single zero and make an assignment. Eliminate remaining zeros in that row or column. Repeat this process until all assignments are completed. Continue iteratively until all available assignments have been made.
Step 9: Assignment and Evaluation
Record the assignment results and determine the minimum distance, cost, and time achieved. It is important to note that if there is no single zero allocation, indicating the existence of multiple possible solutions, the overall cost will remain consistent across different allocation sets.
The Distance Minimization.
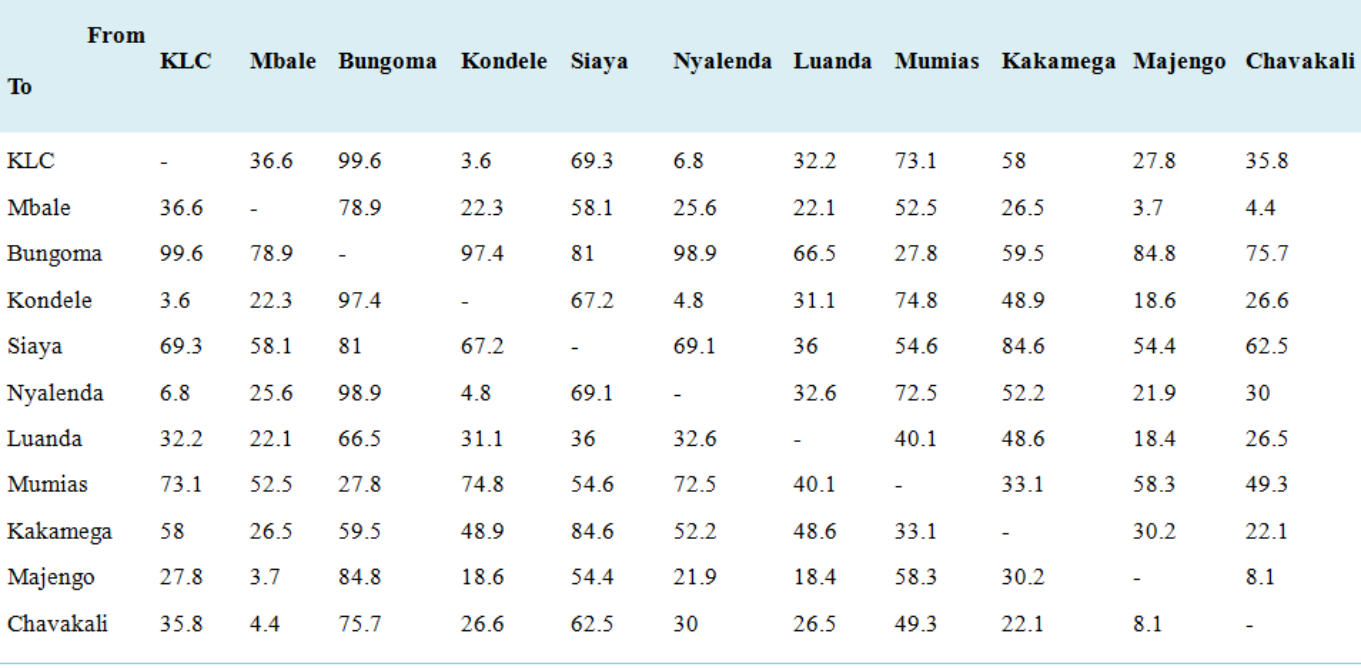
The distance minimization phase is introduced through
Table 1, which meticulously documents the distances between various depots within the Western Kenya region. This table serves as a foundational dataset, providing essential insights into the spatial relationships and connectivity among depots, crucial for optimizing transportation networks. For instance, the entry "KLC to Mbale" denotes a distance of 36.6 kilometers between Victory Farm KLC and VF Mbale depot, illustrating the physical distance between these key logistical depots. It's noteworthy that the data presented are in kilometers, facilitating a quantitative understanding of the distances involved in inter-depot travel. By comprehensively documenting these distances, the table offers valuable information for decision-makers in logistics and supply chain management, enabling strategic route planning and resource allocation to minimize transportation costs and enhance operational efficiency.
3. Data for the Distances Between the Depots
Table 1. Phase one Data for the distances between the depots.
3.1. Reduction of Rows in the Distance Matrix
During this phase, the smallest value in each row is subtracted from all elements within that respective row. This procedure is aimed at reducing the matrix, effectively transforming the smallest value in each row to zero, as illustrated below.
3.2. Reduction of Column Distance Matrix
Likewise, during this stage, the minimum value within each column is deducted from all elements in that specific column. This action aids in further diminishing the matrix by ensuring that the smallest value in each column is adjusted to zero.
This assignment describes Victory Farm’s fish delivery route in their various depots in Western region.
This route outlines a specific path with each location serving as a stop along the journey
| [8] | Mensah, E. K., Keshavarz, E., & Toloo, M. (2022). Finding efficient solutions of the multicriteria assignment problem. In Multi-Objective Combinatorial Optimization Problems and Solution Methods (pp. 193-211). Academic Press. |
[8]
. The sequence starts and ends at KLC and passes through various other locations including Kondele, Nyalenda, Majengo, Mbale, Chavakali, Kakamega, Mumias, Bungoma, Luanda, and Siaya.
The notation ⇒ typically signifies a directional relationship or movement from one location to another, with a task of visiting a set of depots exactly once and returning to the starting depot while minimizing the total distance traveled.
The optimal route is as below.
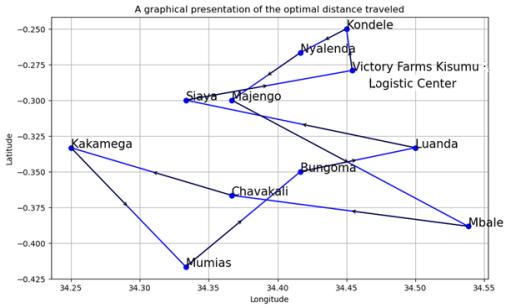
KLC⇒ Kondele ⇒ Nyalenda ⇒Majengo ⇒ Mbale ⇒ Chavakali ⇒ Kakamega ⇒ Mumias ⇒ Bungoma ⇒ Luanda⇒ Siaya⇒ KLC
The total optimal route covered during VF fish delivery process reduces the distance to an impressive 293.2 kilometers. This contributes to a more environmentally sustainable delivery network.
3.4. Visualizing Optimal Route
The graphical representation of these TSP solution using the Hungarian Method involves creating a graph where each node represents a depot, and edges represent the distance between the depots
| [2] | Bock, S., & Boysen, N. (2024). Routing Replenishment Workers: The Prize Collecting Traveling Salesman Problem in Scattered Storage Warehouses. INFORMS Journal on Computing, 36(1), 3-20. |
[2]
. Each depot in the TSP is represented as a point on the graph. The coordinates of these points correspond to the location of each depot in the real world. Edges are drawn between pairs of depots to represent possible routes between them. The length of each edge corresponds to the distance between the connected depots. After applying the Hungarian method to find the optimal route, the path with the shortest distance is highlighted on the graph. This is typically done by drawing a line through the depots in the order they are visited in the optimal route.
The graph below provides a visual representation of the optimal route traveled by the salesman, allowing for easier understanding and analysis of the solution.
This graph is plotted using the live coordinates of the various depot having latitude on the y-axis against the longitude on the x-axis.
Note: Negative latitude in the y-axis of the live coordinates during plotting typically indicates that the depots are located south of the equator. Latitude is measured north or south of the equator, with positive values indicating locations in the northern hemisphere and negative values in the southern hemisphere.
Figure 1. Visual representation of the shortest route.
4. Conclusion
The optimization of fish product distribution routes by Victory Farm Limited, as demonstrated by the impressive reduction in distance to 293.2 kilometers, underscores the company's commitment to efficiency and sustainability in its supply chain operations. By leveraging mathematical techniques such as the Hungarian Method, Victory Farm has successfully identified the shortest and most cost-effective route for delivering fish products from its branches in Western Kenya to various depots across the region. This optimization not only minimizes transportation costs but also reduces fuel consumption and greenhouse gas emissions, contributing to environmental conservation efforts. Additionally, the streamlined distribution process enhances the overall freshness and quality of the fish products, ensuring customer satisfaction and loyalty in a competitive market landscape.
Furthermore, Victory Farm's application of innovative logistics solutions, including the utilization of a centralized logistics center and delivery vehicle for last-mile distribution, exemplifies the company's strategic approach to enhancing operational efficiency and market reach. By integrating on-farm processing with centralized distribution hubs, Victory Farm optimizes resource utilization and inventory management, thereby improving the resilience and responsiveness of its supply chain to market fluctuations and consumer demand. Overall, Victory Farm's commitment to excellence in supply chain management not only drives business success but also contributes to the socioeconomic development of Western Kenya by providing reliable access to nutritious and high-quality fish products for local communities.
Abbreviations
GIS: Geographic Information Systems
TSP: Travelling Salesman Problem
VF: Victory Farm
KLC: Kisumu Logistics Center
Author Contributions
Vollince Kargung’s: Conceptualization, Validation Investigation, Visualization, Writing – original draft.
Cleophas Kweyu: Supervision, Validation.
Titus Rotich: Supervision, Validation.
Conflicts of Interest
The author declares no conflict of interest.
References
| [1] |
Applegate, D. L., Bixby, R. E., Chvátal, V., & Cook, W. J. (2007). The Traveling Salesman Problem: A Computational Study. Princeton University Press.
|
| [2] |
Bock, S., & Boysen, N. (2024). Routing Replenishment Workers: The Prize Collecting Traveling Salesman Problem in Scattered Storage Warehouses. INFORMS Journal on Computing, 36(1), 3-20.
|
| [3] |
Dalsgaard, J. P. T., Dickson, M., Jagwe, J., & Longley, C. (2012). Uganda aquaculture value chains: strategic planning mission report. Ford, L. R., & Fulkerson, D. R. (1962). Flows in Networks. Princeton University Press.
|
| [4] |
FAO. (2020). Kenya: Aquaculture Country Profile. Food and Agriculture Organization of the United Nations.
|
| [5] |
Feinen, C. (2016). Object Representation and Matching Based on Skeletons and Curves (Vol. 40). Logos Verlag Berlin GmbH.
|
| [6] |
Food and Agriculture Organization of the United Nations (FAO). (2020). Kenya: Aquaculture Country Profile. FAO Fisheries and Aquaculture Department.
|
| [7] |
Kuhn, H. W. (1955). The Hungarian method for the assignment problem. Naval Research Logistics Quarterly, 2(1‐2), 83-97.
|
| [8] |
Mensah, E. K., Keshavarz, E., & Toloo, M. (2022). Finding efficient solutions of the multicriteria assignment problem. In Multi-Objective Combinatorial Optimization Problems and Solution Methods (pp. 193-211). Academic Press.
|
| [9] |
Nagurney, A., Yu, M., Masoumi, A. H., & Nagurney, L. S. (2013). Networks against time: Supply chain analytics for perishable products. Springer Science & Business Media.
|
| [10] |
Njiru, J. M., Gichuki, J., & Kengere, A. (2019). Fish Trade in Kenya: Analysis of the Fish Value Chain in Kenya. African Journal of Business and Management, 3(1), 1-17.
|
| [11] |
Pradeepkiran, J. A. (2019). Aquaculture role in global food security with nutritional value: a review. Translational Animal Science, 3(2), 903-910.
|
| [12] |
Scudder, T. T. (2012). The future of large dams: Dealing with social, environmental, institutional and political costs. Routledge.
|
| [13] |
Sultan, F. A., Routroy, S., & Thakur, M. (2023). Understanding fish waste management using bibliometric analysis: A supply chain perspective. Waste Management & Research, 41(3), 531-553.
|
| [14] |
Thorpe, A., Nahdy, S., & Omondi, S. (2018). Kenya Aquaculture Value Chain Overview. WorldFish.
|
| [15] |
Yadav, V. S., Singh, A. R., Gunasekaran, A., Raut, R. D., & Narkhede, B. E. (2022). A systematic literature review of the agro-food supply chain: Challenges, network design, and performance measurement perspectives. Sustainable Production and Consumption, 29, 685-704.
|
Cite This Article
-
ACS Style
Kargung’s, V.; Kweyu, C.; Rotich, T. Evaluation of the Shortest Route Possible in Distribution of Fish Product in Western Kenya Region. Am. J. Appl. Math. 2024, 12(3), 59-65. doi: 10.11648/j.ajam.20241203.12
 Copy
|
Copy
|
 Download
AMA Style
Kargung’s V, Kweyu C, Rotich T. Evaluation of the Shortest Route Possible in Distribution of Fish Product in Western Kenya Region. Am J Appl Math. 2024;12(3):59-65. doi: 10.11648/j.ajam.20241203.12
Copy
|
Download
-
@article{10.11648/j.ajam.20241203.12,
  author = {Vollince Kargung’s and Cleophas Kweyu and Titus Rotich},
  title = {Evaluation of the Shortest Route Possible in Distribution of Fish Product in Western Kenya Region
},
  journal = {American Journal of Applied Mathematics},
  volume = {12},
  number = {3},
  pages = {59-65},
  doi = {10.11648/j.ajam.20241203.12},
  url = {https://doi.org/10.11648/j.ajam.20241203.12},
  eprint = {https://article.sciencepublishinggroup.com/pdf/10.11648.j.ajam.20241203.12},
  abstract = {This comprehensive study delves deeply into the intricate process of optimizing fish product distribution routes in the expansive Western Kenya region, with an explicit focus on understanding and refining the operational strategies employed by Victory Farm Limited. Leveraging the Hungarian Method, celebrated for its unparalleled effectiveness in the realm of combinatorial optimization, the research endeavors to meticulously evaluate and fine-tune the shortest and most efficient transportation routes for seamlessly ferrying fish products from Kisumu Logistic Center to a myriad of distribution depots and retail markets scattered across the Western Kenya region's diverse landscape. Through an exhaustive analysis that spans road networks, logistical constraints, and the ever-evolving dynamics of market demand, this study systematically identifies and delineates optimal routes that not only minimize the distance traversed but also significantly mitigate associated transportation costs, all while steadfastly adhering to stringent standards for punctuality and product quality. Furthermore, by synergistically integrating sophisticated mathematical modeling techniques, meticulously executed through Python programming, with a robust foundation of real-world data meticulously sourced from Victory Farm Limited, this research endeavors to provide invaluable insights and pragmatic recommendations aimed at fortifying and enhancing the overall efficiency and profitability of fish product distribution operations throughout Victory Farm Western Kenya depots. In essence, the anticipated outcomes of this study transcend the realm of theoretical conjecture, poised instead to catalyze tangible advancements in the sustainable development of the region's burgeoning aquaculture sector, thereby fostering a lasting legacy of economic prosperity and environmental stewardship for generations to come.
},
 year = {2024}
}
Copy
|
Download
-
TY  - JOUR
T1  - Evaluation of the Shortest Route Possible in Distribution of Fish Product in Western Kenya Region

AU  - Vollince Kargung’s
AU  - Cleophas Kweyu
AU  - Titus Rotich
Y1  - 2024/05/17
PY  - 2024
N1  - https://doi.org/10.11648/j.ajam.20241203.12
DO  - 10.11648/j.ajam.20241203.12
T2  - American Journal of Applied Mathematics
JF  - American Journal of Applied Mathematics
JO  - American Journal of Applied Mathematics
SP  - 59
EP  - 65
PB  - Science Publishing Group
SN  - 2330-006X
UR  - https://doi.org/10.11648/j.ajam.20241203.12
AB  - This comprehensive study delves deeply into the intricate process of optimizing fish product distribution routes in the expansive Western Kenya region, with an explicit focus on understanding and refining the operational strategies employed by Victory Farm Limited. Leveraging the Hungarian Method, celebrated for its unparalleled effectiveness in the realm of combinatorial optimization, the research endeavors to meticulously evaluate and fine-tune the shortest and most efficient transportation routes for seamlessly ferrying fish products from Kisumu Logistic Center to a myriad of distribution depots and retail markets scattered across the Western Kenya region's diverse landscape. Through an exhaustive analysis that spans road networks, logistical constraints, and the ever-evolving dynamics of market demand, this study systematically identifies and delineates optimal routes that not only minimize the distance traversed but also significantly mitigate associated transportation costs, all while steadfastly adhering to stringent standards for punctuality and product quality. Furthermore, by synergistically integrating sophisticated mathematical modeling techniques, meticulously executed through Python programming, with a robust foundation of real-world data meticulously sourced from Victory Farm Limited, this research endeavors to provide invaluable insights and pragmatic recommendations aimed at fortifying and enhancing the overall efficiency and profitability of fish product distribution operations throughout Victory Farm Western Kenya depots. In essence, the anticipated outcomes of this study transcend the realm of theoretical conjecture, poised instead to catalyze tangible advancements in the sustainable development of the region's burgeoning aquaculture sector, thereby fostering a lasting legacy of economic prosperity and environmental stewardship for generations to come.

VL  - 12
IS  - 3
ER  -
Copy
|
Download