Research Article | | Peer-Reviewed

A Mathematical Evaluation of Diverse Neural Network Models to Predict S&P 500 Closing Prices in the New York Financial Market

Received: 9 May 2025     Accepted: 26 May 2025     Published: 30 June 2025
Views:       Downloads:
Abstract

The Standard and Poor’s 500 (S&P 500) is one of the most significant global stock market indices. Due to the high volatility and sensitivity of financial markets, accurately predicting their closing price remains a challenging task. Early-stage predictions of this index could significantly reduce risks associated with financial bubbles and market instability. While existing literature presents various methods for forecasting closing prices, there is a noticeable lack of comparative studies or practical implementations. To address this gap, researchers evaluated three neural network models: the Feedforward Neural Network (FFNN), Generalized Regression Neural Network (GRNN), and Radial Basis Neural Network (RBNN). The author chose to use PyCharm for developing the models due to its user-friendly interface and robust support for Python programming. The comparison focused on mathematical characteristics, prediction accuracy, and associated error metrics to determine the most effective model. Mathematically, the RBNN can be considered a hybrid of the FFNN and GRNN, as both GRNN and RBNN utilize kernel functions as activation mechanisms. For this forecasting task, the FFNN combined with the ReLU activation function produced the most accurate predictions. The analysis, conducted through three distinct evaluation methods, identified the FFNN as the most reliable model for this application. The author refrains from definitively claiming FFNN as the optimal method for predicting closing prices; however, among the neural networks considered, FFNN appears to be the most promising option. As a future implementation, the author intends to enhance the FFNN by developing a hybrid model incorporating Long Short-Term Memory (LSTM) architecture, to contribute mathematically to improve predictive accuracy and precision.

Published in American Journal of Applied Mathematics (Volume 13, Issue 3)
DOI 10.11648/j.ajam.20251303.14
Page(s) 225-236
Creative Commons

This is an Open Access article, distributed under the terms of the Creative Commons Attribution 4.0 International License (http://creativecommons.org/licenses/by/4.0/), which permits unrestricted use, distribution and reproduction in any medium or format, provided the original work is properly cited.

Copyright

Copyright © The Author(s), 2025. Published by Science Publishing Group

Keywords

S&P 500 Index, Neural Networks, New York Financial Market, Mathematics, Kernel, Closing Price, Training Ratio, Mean Square Error

1. Introduction
The S&P 500 index, a leading benchmark for the U.S. stock market, serves as a critical indicator of the nation’s economic health. Its performance is carefully monitored by investors, policymakers, and financial analysts, making the accurate prediction of its closing prices a topic of significant interest. Reliable forecasts of the S&P 500 can provide actionable insights for optimizing portfolios, mitigating risk, and making informed strategic investment decisions. However, the stock market prediction remains an exceptionally complex task due to the inherent nonlinearity, volatility, and multifaceted influences driving financial markets .
To address these challenges, researchers have employed diverse methodologies. As the first step of this study, the author (2023) investigated the relationship between the Effective Federal Funds Rate (EFFR), a key monetary policy tool set by the Federal Reserve, and major fluctuations in the New York financial markets . Additionally, sentiment analysis and alternative data sources, such as search engine trends, have gained traction in financial forecasting. For instance, Damien and Ahamed Bell (2013) demonstrated the predictive power of Google Trends data in forecasting stock returns . Building upon this approach, the author analyzed the correlation between the closing price of the S&P 500 index and U.S. Google Trends queries related to stock market activity. Through this analysis, the authors identify optimized predictive models for S&P 500 movements based on search trend variables .
In recent years, neural networks have emerged as powerful tools for modeling and predicting financial time series data. Their ability to capture intricate patterns and relationships in data makes them particularly well-suited for tasks such as stock price prediction . Among the various types of neural networks, feedforward neural networks (FFNN), generalized regression neural networks (GRNN), and radial basis neural networks (RBNN) have shown promise in handling the complexities of financial data.
FFNNs are one of the simplest yet most used architectures in deep learning. They are composed of multiple layers of neurons that process data in a forward direction, making them practical for modeling nonlinear patterns in time series data. In the previous context of this research, the author implemented an FFNN-based model to forecast the closing prices of the S&P 500 index .
GRNNs, conversely, are a type of probabilistic neural network that excels in regression tasks. They are known for their ability to approximate any continuous function and provide smooth predictions, which can be advantageous in financial forecasting. RBNNs utilize radial basis functions as activation functions and are particularly effective in handling noisy and non-stationary data, making them suitable for the volatile nature of stock markets .
Recent studies have explored various machine learning and statistical models for predicting S&P 500 performance. Pilla and Mekonen utilized LSTM models to capture temporal dependencies in stock data, demonstrating strong forecasting capabilities . Htun et al. applied machine learning to predict relative returns, highlighting model adaptability to financial trends . Similarly, Shi et al. compared several models, confirming the effectiveness of ML techniques in stock market prediction . Rodriguez et al. proposed a method for forecasting absolute percent changes using AI, improving predictive accuracy . In contrast, Zhang employed the ARIMA model, emphasizing traditional statistical approaches, though with limitations in capturing nonlinear market behaviors .
This study aims to explore the predictive performance of these three types of neural networks: FFNN, GRNN, and RBNN in forecasting the closing prices of the S&P 500 Index. By comparing their strengths and limitations, researchers seek to identify the most effective approach for modeling and predicting this critical financial indicator. The findings of this research could contribute to the development of more accurate and robust tools for financial market analysis and decision-making.
2. Materials and Methods
The prediction of stock market indices, such as the S&P 500, has long been a focal point of research in financial analytics due to its implications for investment strategies and economic forecasting. A review of the existing literature reveals a wide array of techniques employed for stock market index prediction, ranging from traditional statistical methods to advanced machine learning algorithms. Among these, neural networks have gained significant attention for their ability to model complex, nonlinear relationships inherent in financial time series data.
As a starting point in this research, the author focused on the application of FFNNs, a foundational architecture in neural network modeling. This initial work was published in , where the FFNN was utilized to predict stock market indices. The study provided valuable insights into the model's performance and laid the groundwork for further exploration. Specifically, the results from this publication helped identify optimal training and testing data ratios, as well as the most effective data range for achieving highly accurate predictions. These findings served as a critical foundation for subsequent investigations into more advanced neural network architectures.
Building on the outcomes of the initial study, the author expanded the research to explore additional neural network models, including GRNNs and RBNNs. Each of these architectures offers unique advantages in handling the volatility and noise often present in financial data. This progression aims to refine the prediction accuracy and robustness of stock market index forecasting, ultimately contributing to the development of more reliable tools for financial analysis and decision-making.
The S&P 500 index was analyzed using six key variables for predictions: Open, High, Low, Close, Volume, and Date. The data, sourced from Yahoo Finance, was secondary. The researcher utilized PyCharm software to develop distinct neural network models. By evaluating these various neural networks, the author aimed to identify the most suitable model for the analysis.
Research Design
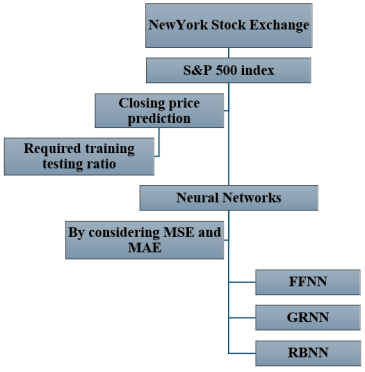
Figure 1. Research design of the S&P 500 index closing price prediction.
Figure 1 presents the research framework for predicting the index closing price. The optimal model is selected by analyzing the fluctuation patterns of the actual closing price values. Additionally, the author evaluated the Mean Squared Error (MSE) and Mean Absolute Error (MAE) to determine the most effective neural network model among FFNN, GRNN, and RBNN.
3. Results
As the initial phase of this research, the analysis was conducted with a focus on FFNN. During this stage, the researcher determined that the most accurate results were obtained using data from 1950 to 2024. Based on this prior analysis, the optimal performance was observed when using data from 2016 to 2024 with a training-to-testing ratio of 0.8. A review of relevant literature identified three primary neural networks commonly used for closing price prediction: FFNN, GRNN, and RBNN.
3.1. FFNN
The output of each layer is calculated as a weighted sum of its inputs, expressed as z=Wx+b, where W represents the weight matrix, x is the input vector, and b is the bias vector. In this research, the author applied this concept to address the research problem. Specifically, the input vector x is defined as a column vector with 5 rows, while the weight matrix W has a size of 1×5. For this practical scenario, the bias b is treated as a constant value, which the researcher can adjust to achieve the desired output. Following the principles of FFNN, non-linear activation functions such as ReLU, Sigmoid, and Tanh are applied to introduce non-linearity into the model. These activation functions enable the network to learn and model complex patterns in the data.
The sigmoid function is also known as the Logistic function. The following equation demonstrates the sigmoid function that assists in providing smooth and continuous output.
fx=11+e-x(1)
The S&P 500 closing prices are always positive values, but the sigmoid function outputs values ranging strictly between 0 and 1, making it suitable for binary classification rather than directly modelling such financial data. The ReLU function is one of the famous activation functions in many cases.
fx=max(0,x)(2)
This activation function vanishes the input by returning zero for negative inputs. This indicates an increasing function for positive input, making it suitable for S&P 500 predictions. The tanh activation, which is also known as the hyperbolic tangent, is as follows:
fx= ex-e-xex+e-x(3)
The author also regarded the tanh function as an extended form of the sigmoid function, given the mathematical relationship that exists between the two.
2sigmoid2x -1(4)
The output values of this method range from -1 to 1, making it primarily suitable for zero-centered outputs. As a result, it is not well suited for predicting S&P 500 closing prices. Based on the data, ReLU emerges as the optimal activation function for this use case. The researcher decided to use ReLU for these predictions.
The author enhanced the model by optimizing the loss function. For the FFNN, the loss function used is MSE, and its equation is as follows:
L=1Ni=1N(yi-ŷi)2(5)
Where yi represents the actual closing price of the S&P 500 and ŷi denotes the predicted closing price of the S&P 500. Accurate predictions can be achieved by minimizing the loss function of the FFNN. The author employed the gradient descent method to minimize the loss function. This involves using partial differentiation and numerical analysis techniques to iteratively reduce the loss function. The gradient descent equation is as follows:
Wnew=Wold-ηLW(6)
Where η is the learning rate. The author starts with the initial weight value and later upgrades the model by using the above gradient descent method.
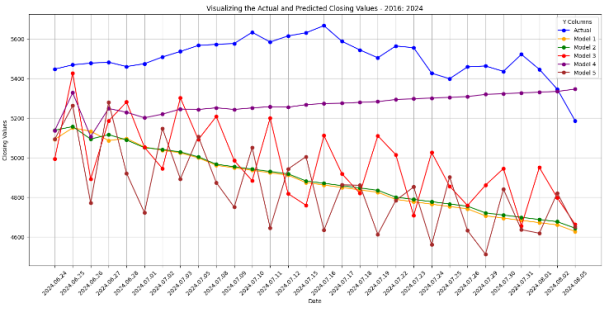
Figure 2. Actual and predicted closing prices by using FFNN.
Figure 2 presents the Actual closing price alongside the predicted closing prices generated by the FFNN model for the period from June 24, 2024, to August 5, 2024, across various training and testing ratios. Among these, Model 4, trained with a 0.8 training-to-testing ratio, was identified by the researcher as the most accurate. This model is highlighted in purple in Figure 2.
3.2. GRNN
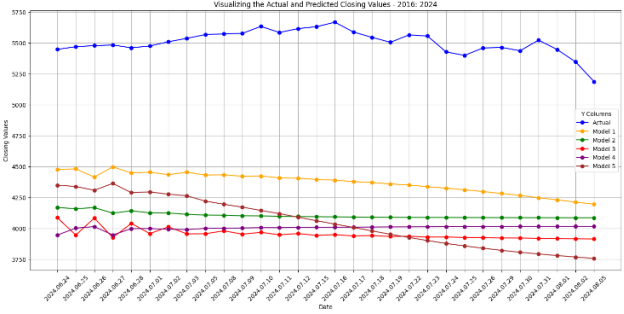
Figure 3. Actual and predicted closing prices by using GRNN.
The unique feature of GRNN lies in its use of a kernel function to estimate the conditional mean of the target variable, as defined by the following equation.
ŷx=i=1NyiK(x,xi)i=1NK(x,xi)(7)
Where Kx,xi is the Gaussian kernel:
Kx,xi= e-x-xi22σ2(8)
In the equation, σ represents the bandwidth, also known as the smoothing parameter. Unlike FFNN, GRNN does not require weight training. Additionally, GRNN estimates the joint probability density function of input and output variables, denoted as fXYx,y. This makes GRNN particularly well-suited for regression tasks.
Figure 3 reveals a significant disparity between the actual and predicted closing prices when compared to the FFNN. Additionally, GRNN predictions exhibited unstable fluctuations after the initial 10 days, indicating that GRNN is not well-suited for long-term forecasting. However, among the GRNN models, Model 1, with a 0.5 training-to-testing ratio, performed relatively better.
3.3. RBNN
The radial basis function (RBF) is employed as an activation function.
ϕx,ci=e-x-ci22σ2(9)
Here, ci represents the center of the RBF, and σ controls its width. The RBF is like the Gaussian kernel used in GRNN. However, unlike GRNN, where the norm is calculated from the predicted value, the RBF calculates the norm based on the center value ci. Despite this difference, the mathematical formulation of both activation functions remains the same. As a result, the final output values from both approaches are expected to be approximately close mathematically.
The hidden layer calculates the distance between the input vector x and the center ci, and then applies the RBF to this distance.
hi=(x, ci)(10)
The output is computed as a linear combination of the activations from the hidden layer. Let y represent the output of a specific hidden layer.
y=i=1Nwihi+b(11)
Where wi represents the weights and b is the bias. When comparing the output functions of RBNN and FFNN, they are found to be mathematically equivalent. The only distinction between these two output functions lies in the choice of activation functions.
From a mathematical perspective, GRNN and RBNN exhibit similar characteristics. GRNN employs a Gaussian kernel to predict the output, which is dependent on the predicted value. In contrast, RBNN relies on radial basis functions, which are centered around specific values. However, RBNN uses a linear combination to predict the output, a process identical to that of FFNN. Therefore, RBNN can be viewed as a hybrid model combining the features of GRNN and FFNN.
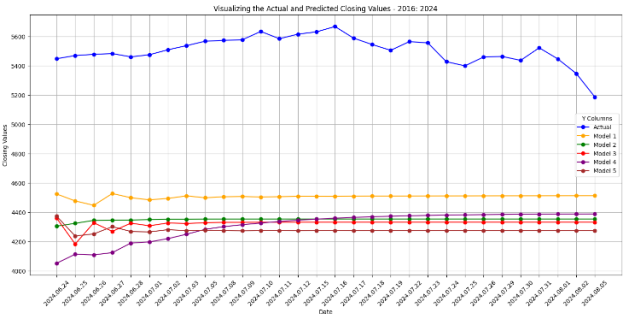
Figure 4. Actual and predicted closing prices by using RBNN.
Figure 4 presents a comparison of the actual and predicted closing prices generated by the RBNN model. The results reveal a significant deviation between the actual and predicted values compared to the FFNN and GRNN models. Additionally, the RBNN predictions exhibit notable fluctuations during the first five days. Beyond this initial period, most of the RBNN predictions stabilize and remain constant. Among the various RBNN models tested with different training-to-testing ratios, Model 1, which employs a 0.5 training-to-testing ratio, delivers the most accurate predictions.
3.4. Error Values of Each Neural Network
The author aimed to identify a more effective model by evaluating its performance using MAE and MAPE in the context of Mathematics. Typically, the confusion matrix is employed to assess the accuracy of neural networks; however, it is primarily suited for classification-type problems. Since this particular use case involves a regression-based problem, the author opted to use MAE and MAPE as more appropriate metrics for evaluating model performance.
MAE= 1ni=1nyi-ŷi(12)
MAPE= 1ni=1nyi-ŷiyi×100%(13)
where yi be the actual closing price, ŷi be the predicted closing price via several neural networks and n be the number of observations.
The researcher aimed to determine the practical relevance of these errors for this specific research case. Typically, MAE measures the absolute error, and when actual values are large, the MAE tends to be correspondingly high. On the other hand, MAPE calculates the relative error, which is less effective when actual values are zero or close to zero. Since this research focuses on the S&P 500 index closing prices from 2016 to 2024, where the values range between 1800 and 6000, MAPE is deemed appropriate for this study.
Based on Figures 5, 6, and 7, the author provides a visual representation of the actual and predicted values for various neural networks. Additionally, Table 2 offers a comparative analysis of these predictions using the MAE and MAPE.
Table 1. Errors of each Neural Network Model across Different Training- Testing Ratios.

Error

Training Testing Ratios

0.5

0.6

0.7

0.8

0.9

FFNN

MAE

0.0104

0.0109

0.0082

0.0099

0.0079

MAPE

0.47%

0.49%

0.37%

0.44%

0.36%

GRNN

MAE

0.0007

0.0008

0.0002

0.0005

0.0006

MAPE

0.94%

0.97%

0.55%

0.82%

0.83%

RBNN

MAE

0.0136

0.0535

0.0312

0.0206

0.0795

MAPE

2.86%

7.06%

5.10%

3.66%

9.27%

Table 1 presents the MAE and MAPE values for each corresponding neural network model. Based on these results, the optimal MAE values for FFNN, GRNN, and RBNN are achieved with training-to-testing ratios of 0.9, 0.7, and 0.5, respectively. Notably, the GRNN model exhibits the best MAE performance overall, with all its MAE values being lower than those of FFNN and RBNN. In contrast, the highest MAE values are observed in the RBNN results. Similarly, the lowest MAPE values for FFNN, GRNN, and RBNN are obtained with training-to-testing ratios of 0.9, 0.7, and 0.5, respectively. However, the FFNN model achieves the lowest MAPE values compared to the other models.
3.5. Linear and Polynomial Fits for Predicting Outcomes of Various Neural Network Models
Figure 5 presents the fitted line models for each prediction. The author employed MSE as the metric to evaluate the better-fitted lines. Most polynomial fittings were obtained with degrees 3 and 4. In most cases, polynomial fitted lines demonstrated lower MSE values compared to linear models. Additionally, the smallest MSE values for the FFNN, GRNN, and RBNN fitted line models were achieved with training-to-testing ratios of 0.8, 0.7, and 0.6, respectively. The researcher gathered all the observations from Figure 5 and subsequently organized them systematically into a table. As a result, Table 2 presents the summarized values derived from Figure 5.
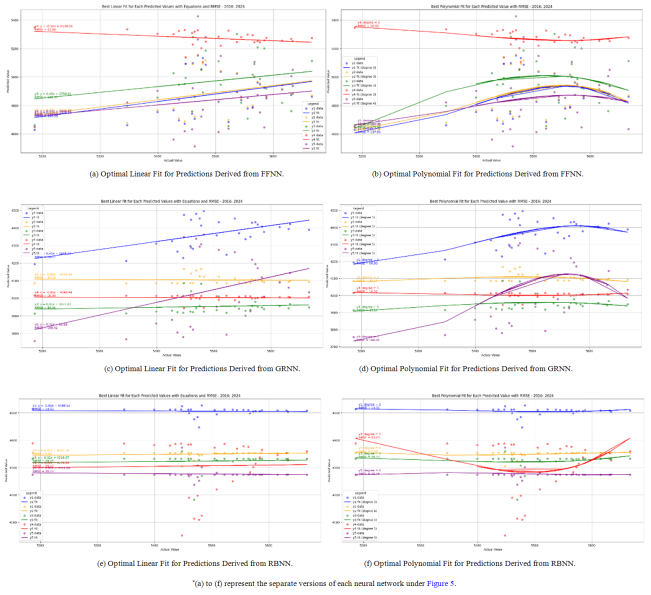
Figure 5. *Fitted Models from each Neural Network.
Table 2. MSE for optimal fit models derived from various prediction cases.

Training Testing Ratios

0.5

0.6

0.7

0.8

0.9

FFNN

Linear

145.55

143.7

180.37

51.86

198.3

Polynomial

137.93

134.96

179.69

50.40

196.98

GRNN

Linear

70.21

24.58

16.98

44.06

188.92

Polynomial

66.83

23.23

16.52

43.14

180.98

RBNN

Linear

14.51

9.92

29.25

99.45

20.25

Polynomial

14.31

9.58

28.73

93.43

20.16

Table 2 presents the MSE for each fitted model, as derived from different prediction models. Based on the overall MSE values, the RBNN prediction models exhibit the lowest error, while the highest MSE values are associated with the FFNN-based fitted line models. From the results in Table 2, the author concludes that the minimum MSE values for the models fitted using FFNN, GRNN, and RBNN are 0.8, 0.7, and 0.6, respectively.
Based on these findings, the objective of this study is to determine the most effective model for predicting the S&P 500 closing prices. To achieve this, the author chose to visualize the predictions from each model alongside the actual closing prices on the same graph.
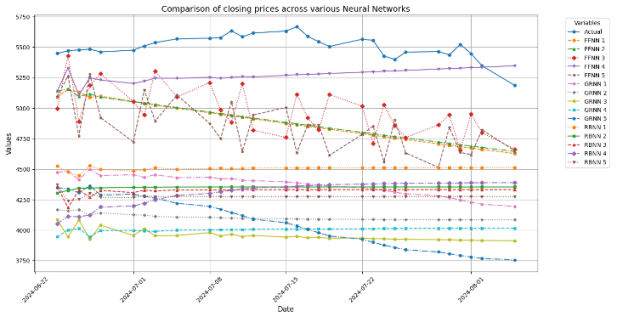
Figure 6. Comparative Analysis of Predictions across each Neural Network Architecture.
Figure 6 presents the predictions generated by various models using different neural networks. Based on the fluctuations in the predictions shown in the figure, the author ranked the models from best to least effective. The FFNN models provided the closest predictions to the actual values, with the ranking being FFNN model 4, model 3, model 2, model 5, and model 1, respectively. Since the top five predictions closest to the actual values were produced by FFNN, the author concluded that FFNN outperforms GRNN and RBNN for these predictions. Following this, RBNN model 1, GRNN model 1, RBNN model 2, RBNN model 3, RBNN model 5, and GRNN model 5 performed well in that order. Based on these results, the author asserted that the RBNN model is superior to the GRNN model.
4. Discussion
The S&P 500 index plays a vital role in New York financial markets, prompting researchers to explore several methods for predicting its closing price more accurately. As initial steps, they examined various approaches, including sentiment analysis, time series analysis, regression models, machine learning models, and neural networks. In this manuscript, the author primarily focuses on neural network concepts. The study aims to compare FFNN, GRNN, and RBNN to determine the best method for predicting the S&P 500 closing price.
The author divided the results section into five separate subsections. The first three subsections discussed the mathematical behavior of the above-mentioned neural network models. To use the FFNN for these value predictions, the author first needed to identify the required nonlinear activation function for this requirement. Based on historical data from the S&P 500 closing price from 1950 to the present, the trend shows an increasing function with consistently positive values. Therefore, the author chose the ReLU activation function for this purpose.
Second, the author examined the mathematical behavior of GRNN and RBNN. The researcher predicted the S&P 500 closing price using a Kernel function for GRNN and RBF for RBNN, respectively. The key difference between these two functions lies in the norm function: while GRNN used every individual value, RBNN relied only on certain central values within the norm. Consequently, the author expected the two models to produce closely aligned predictions, which Figures 3 and 4 clearly illustrate.
Additionally, the author attempted a thirty-day prediction using these models. The results showed that GRNN and RBNN captured fluctuations well only within the first ten days, after which the predictions remained nearly constant. In contrast, FFNN delivered superior performance, maintaining better fluctuations throughout the 30-day forecast period. Thus, based on prediction duration and mathematical analysis, FFNN outperformed the other models discussed here.
Then, the researcher tried to identify better prediction models by comparing the MAE and MAPE of each model. Normally, a confusion matrix works better for classification-type applications. However, the author used MAE and MAPE because the model was a regression-type case. According to the MAE values, training-testing ratios of 0.9, 0.7, and 0.5 yielded the minimum values for the FFNN, GRNN, and RBNN models, respectively. Moreover, for MAPE, the models with the least error values came from ratios of 0.7, 0.7, and 0.5, respectively. The results suggest that a 0.7 training-testing ratio works best for GRNN, whereas a 0.5 ratio is more suitable for RBNN.
As the next step, the author tried to identify a model for predicting the S&P 500 closing prices using different approaches. The researcher used the MSE to determine the best optimal fit. These models were primarily polynomial rather than linear, meaning that all predictions in each neural network followed the concept of non-linearity. Based on the overall results in this section, the 0.7 training-testing ratio in RBNN provided the best model.
Using these results, the author attempted to find a better neural network model for predicting the S&P 500 closing price. To achieve this, the researcher compared each model's predictions with the actual values and ranked the neural networks as follows: FFNN, RBNN, and GRNN. Based on mathematical behavior, RBNN performs better than GRNN for this application because it uses linear combinations of activations.
This is not the ultimate expected result. The author must improve the FFNN and will implement hybrid models to find the best model for S&P 500 predictions. Based on available resources and knowledge, the author recommends adding mathematical contributions to enhance these models. The researcher chose the S&P 500 index for prediction due to its critical role in stock markets. However, researchers plan to apply this concept to other stock market indexes. They can further refine this concept into a general model, which would help market investors and limited companies protect their money and shares from future stock market bubbles and crashes.
5. Conclusions
This study evaluated three neural network models, FFNN, GRNN, and RBNN, for predicting the S&P 500 closing price, a key index in New York’s financial markets. Each model demonstrated distinct strengths based on mathematical structure, prediction horizon, and error metrics.
The FFNN, using the ReLU activation function, showed superior performance in long-term forecasting by better capturing fluctuation trends. In contrast, both GRNN and RBNN, which use kernel and radial basis functions, respectively, delivered more accurate short-term predictions. Among the two, RBNN slightly outperformed GRNN due to its use of linear combinations of activations.
Error analysis using MAE and MAPE revealed optimal training-to-testing ratios of 0.9 for FFNN, 0.7 for GRNN, and 0.5 for RBNN. Additional evaluation using MSE indicated that RBNN, particularly with a 0.7 ratio, provided the best polynomial regression fit. When benchmarked against actual market data, the models ranked in performance as follows: FFNN, RBNN, and GRNN.
Although FFNN proved to be the most effective overall, further enhancements, such as hybrid models and advanced mathematical techniques, could improve predictive accuracy. Future work will apply these methods to other stock indices, aiming to build a generalized model to help investors manage risks from volatility, bubbles, and market crashes.
Abbreviations

EFFR

Effective Federal Funds Rate

FFNN

Feedforward Neural Network

GRNN

Generalized Regression Neural Network

LSTM

Long Short-term Memory

MAE

Mean Absolute Error

MAPE

Mean Absolute Percentage Error

MSE

Mean Square Error

RBF

Radial Basis Function

RBNN

Radial Basis Neural Network

S&P 500

Standard & Poor’s 500

Author Contributions
Hirushi Dilpriya Thilakarathne: Conceptualization, Data curation, Formal Analysis, Investigation, Methodology, Project administration, Resources, Validation, Visualization, Writing – original draft.
Jayantha Lanel: Investigation, Project Administration, Software Supervision, Writing – review & editing.
Thamali Perera: Formal Analysis, Methodology, Writing – review & editing.
Chathuranga Vidanage: Formal Analysis, Methodology, Writing – review & editing.
Data Availability Statement
The data that supports the findings of this study can be found at: https://finance.yahoo.com/
Funding
This work is not supported by any external funding.
Conflicts of Interest
The authors declare no conflicts of interest.
References
[1] Dilpriya, T. A. H., Lanel, G. H. J., Perera, M. T. M. Reviewing the efficacy of Federal Reserve Bank reserve policies through a time series analysis of the effective federal funds rate. International Journal of Research and Innovation in Social Science (IJRISS). 2023, 7(4), pp. 869-880.
[2] Challet, D., Bel Hadj Ayed, A. Predicting financial markets with Google Trends and not so random keywords. Social Science Research Network (SSRN). 2013.
[3] Dilpriya, T. A. H., Lanel, G. H. J., Perera, M. T. M., Vidanage, B. V. N. C. Analysing the S&P 500 index in relation to the Google Trends of stock market-related words in the United States. In Transformative applied research in computing, engineering, science and technology, 1st Ed. CRC Press: Boca Raton, Florida, USA; 2025, p. 8.
[4] Mintarya, L. N., Halim, J. N. M., Angie, C., Achmad, S., Kurniawan, A. Machine learning approaches in stock market prediction: A systematic literature review. Procedia Computer Science. 2023, 216, pp. 96–102.
[5] Zhang, A., Zhong, G., Dong, J., Wang, S., Wang, Y. Stock market prediction based on generative adversarial network. Procedia Computer Science. 2019, 147, pp. 400–406.
[6] Hiransha, M., Gopalakrishnan, E. A., Vijay, K. M., Soman, K. P. NSE stock market prediction using deep-learning models. Procedia Computer Science. 2018, 132, pp. 1351–1362.
[7] Thilakarathne, H., Lanel, J., Perera, T., Vidanage, C. Predicting S&P 500 Closing Prices Using a Feedforward Neural Network: A Machine Learning Approach, Journal of Mathematics and Statistics Studies. 2025, 6(1), pp. 18-31.
[8] Selvin, S., Vinayakumar, R., Gopalakrishnan, E. A., Menon, V. K., Soman, K. P. Stock price prediction using LSTM, RNN and CNN-sliding window model. In International Conference on Advances in Computing, Communications and Informatics (ICACCI). IEEE, 2017; pp. 1643–1647.
[9] Nelson, D. M. Q., Pereira, A. C. M., de Oliveira, R. A. Stock market's price movement prediction with LSTM neural networks. In International Joint Conference on Neural Networks (IJCNN). IEEE, 2017; pp. 1419–1426.
[10] Vargas, M. R., De Lima, B. S. L. P., Evsukoff, A. G. Deep learning for stock market prediction from financial news articles. In IEEE International Conference on Computational Intelligence and Virtual Environments for Measurement Systems and Applications (CIVEMSA), Annecy, France, 2017; pp. 60-65.
[11] Pilla, P. R., Mekonen, R. Forecasting S&P 500 Using LSTM Models.
[12] Htun, H. H., Biehl, M., Petkov, N. Forecasting relative returns for S&P 500 stocks using machine learning. Financ Innov. 2024, 10, p. 118.
[13] Shi, B., Tan, C., Yu, Y. Predicting the S&P 500 stock market with machine learning models. Applied and Computational Engineering. 2024, 48, pp. 255-261.
[14] Rodriguez, F. S., Norouzzadeh, P., Anwar, Z. et al. A machine learning approach to predict the S&P 500 absolute percent change. Discov Artif Intell. 2024, 4(8).
[15] Zhang, W. S&P 500 Index Price Prediction Based on ARIMA Model. Advances in Economics, Management and Political Sciences. 2025, 147, pp. 156–161.
Cite This Article
  • APA Style

    Thilakarathne, H. D., Lanel, J., Perera, T., Vidanage, C. (2025). A Mathematical Evaluation of Diverse Neural Network Models to Predict S&P 500 Closing Prices in the New York Financial Market. American Journal of Applied Mathematics, 13(3), 225-236. https://doi.org/10.11648/j.ajam.20251303.14

    Copy | Download

    ACS Style

    Thilakarathne, H. D.; Lanel, J.; Perera, T.; Vidanage, C. A Mathematical Evaluation of Diverse Neural Network Models to Predict S&P 500 Closing Prices in the New York Financial Market. Am. J. Appl. Math. 2025, 13(3), 225-236. doi: 10.11648/j.ajam.20251303.14

    Copy | Download

    AMA Style

    Thilakarathne HD, Lanel J, Perera T, Vidanage C. A Mathematical Evaluation of Diverse Neural Network Models to Predict S&P 500 Closing Prices in the New York Financial Market. Am J Appl Math. 2025;13(3):225-236. doi: 10.11648/j.ajam.20251303.14

    Copy | Download

  • @article{10.11648/j.ajam.20251303.14,
      author = {Hirushi Dilpriya Thilakarathne and Jayantha Lanel and Thamali Perera and Chathuranga Vidanage},
      title = {A Mathematical Evaluation of Diverse Neural Network Models to Predict S&P 500 Closing Prices in the New York Financial Market},
      journal = {American Journal of Applied Mathematics},
      volume = {13},
      number = {3},
      pages = {225-236},
      doi = {10.11648/j.ajam.20251303.14},
      url = {https://doi.org/10.11648/j.ajam.20251303.14},
      eprint = {https://article.sciencepublishinggroup.com/pdf/10.11648.j.ajam.20251303.14},
      abstract = {The Standard and Poor’s 500 (S&P 500) is one of the most significant global stock market indices. Due to the high volatility and sensitivity of financial markets, accurately predicting their closing price remains a challenging task. Early-stage predictions of this index could significantly reduce risks associated with financial bubbles and market instability. While existing literature presents various methods for forecasting closing prices, there is a noticeable lack of comparative studies or practical implementations. To address this gap, researchers evaluated three neural network models: the Feedforward Neural Network (FFNN), Generalized Regression Neural Network (GRNN), and Radial Basis Neural Network (RBNN). The author chose to use PyCharm for developing the models due to its user-friendly interface and robust support for Python programming. The comparison focused on mathematical characteristics, prediction accuracy, and associated error metrics to determine the most effective model. Mathematically, the RBNN can be considered a hybrid of the FFNN and GRNN, as both GRNN and RBNN utilize kernel functions as activation mechanisms. For this forecasting task, the FFNN combined with the ReLU activation function produced the most accurate predictions. The analysis, conducted through three distinct evaluation methods, identified the FFNN as the most reliable model for this application. The author refrains from definitively claiming FFNN as the optimal method for predicting closing prices; however, among the neural networks considered, FFNN appears to be the most promising option. As a future implementation, the author intends to enhance the FFNN by developing a hybrid model incorporating Long Short-Term Memory (LSTM) architecture, to contribute mathematically to improve predictive accuracy and precision.},
     year = {2025}
    }
    

    Copy | Download

  • TY  - JOUR
    T1  - A Mathematical Evaluation of Diverse Neural Network Models to Predict S&P 500 Closing Prices in the New York Financial Market
    AU  - Hirushi Dilpriya Thilakarathne
    AU  - Jayantha Lanel
    AU  - Thamali Perera
    AU  - Chathuranga Vidanage
    Y1  - 2025/06/30
    PY  - 2025
    N1  - https://doi.org/10.11648/j.ajam.20251303.14
    DO  - 10.11648/j.ajam.20251303.14
    T2  - American Journal of Applied Mathematics
    JF  - American Journal of Applied Mathematics
    JO  - American Journal of Applied Mathematics
    SP  - 225
    EP  - 236
    PB  - Science Publishing Group
    SN  - 2330-006X
    UR  - https://doi.org/10.11648/j.ajam.20251303.14
    AB  - The Standard and Poor’s 500 (S&P 500) is one of the most significant global stock market indices. Due to the high volatility and sensitivity of financial markets, accurately predicting their closing price remains a challenging task. Early-stage predictions of this index could significantly reduce risks associated with financial bubbles and market instability. While existing literature presents various methods for forecasting closing prices, there is a noticeable lack of comparative studies or practical implementations. To address this gap, researchers evaluated three neural network models: the Feedforward Neural Network (FFNN), Generalized Regression Neural Network (GRNN), and Radial Basis Neural Network (RBNN). The author chose to use PyCharm for developing the models due to its user-friendly interface and robust support for Python programming. The comparison focused on mathematical characteristics, prediction accuracy, and associated error metrics to determine the most effective model. Mathematically, the RBNN can be considered a hybrid of the FFNN and GRNN, as both GRNN and RBNN utilize kernel functions as activation mechanisms. For this forecasting task, the FFNN combined with the ReLU activation function produced the most accurate predictions. The analysis, conducted through three distinct evaluation methods, identified the FFNN as the most reliable model for this application. The author refrains from definitively claiming FFNN as the optimal method for predicting closing prices; however, among the neural networks considered, FFNN appears to be the most promising option. As a future implementation, the author intends to enhance the FFNN by developing a hybrid model incorporating Long Short-Term Memory (LSTM) architecture, to contribute mathematically to improve predictive accuracy and precision.
    VL  - 13
    IS  - 3
    ER  - 

    Copy | Download

Author Information
  • Department of Computer and Data Science, Faculty of Computing, NSBM Green University, Homagama, Sri Lanka

    Biography: Hirushi Dilpriya Thilakarathna is a Lecturer in the Department of Computer and Data Science at NSBM Green University. She holds a Bachelor of Science (Hons.) Degree in Mathematics with First Class Honors from the University of Sri Jayewardenepura, Sri Lanka, where she graduated as the top student in her batch in 2021. In recognition of her outstanding academic performance, she was awarded the Dr. Sunethra Weerakoon Memorial Gold Medal and the Dr. Srimathi Wewala Gold Medal for excellence in Mathematics. Ms. Thilakarathna is currently pursuing her PhD in Mathematics at the University of Sri Jayewardenepura. Jayewardenepura. At NSBM Green University, she lectures in Advanced Mathematics, Probability, Statistical Inference, Descriptive Statistics, and Computational Thinking Development. She is a member of the Computer Society of Sri Lanka and remains actively engaged in academic and research pursuits in her field.

    Research Fields: Actuarial Science, Financial Mathematics, Neural Networks, Mathematical Modelling, Telecommunication Networks, Graph Theory, Computational Theory

  • Department of Mathematics, Faculty of Applied Science, University of Sri Jayewardenepura, Nugegoda, Sri Lanka

    Research Fields: Graph Theory and its Applications, Optimization, Deep Learning

  • Department of Mathematics, Faculty of Applied Science, University of Sri Jayewardenepura, Nugegoda, Sri Lanka

    Research Fields: Financial Mathematics, Graph Theory

  • Department of Mathematics, Faculty of Applied Science, University of Sri Jayewardenepura, Nugegoda, Sri Lanka

    Research Fields: Number Theory, Abstract Algebra.