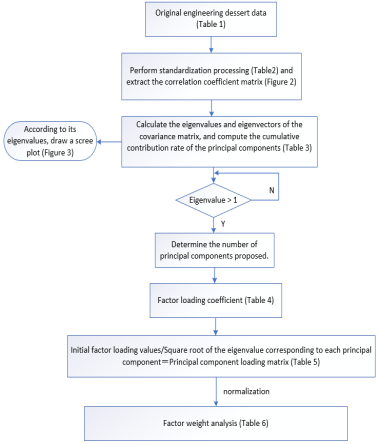
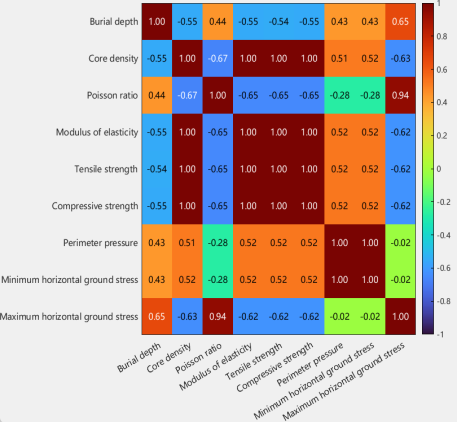
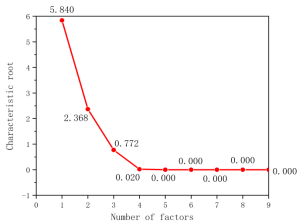
Under the geological conditions of sandstone reservoirs in the long 7 sections of Tiezhuizi block, with the increase in the depth of burial and the complexity of geological structure, it leads to the status quo of generally low production capacity of horizontal wells. In the face of this challenge, the optimisation of fracturing engineering desserts is particularly difficult. To cope with this challenge, this study is dedicated to finding a high-precision method for quantitative evaluation of reservoir engineering sweet spots. In this study, principal component analysis was adopted to comprehensively and meticulously analyse nine key engineering sweet spot factors, including core density, elastic modulus, Poisson's ratio, and perimeter pressure. The screening criteria of eigenvalue > 1 accurately identified 2 factors that mainly affect the engineering sweet spot. The cumulative explained variance of these two principal components reaches 91.199 %, which almost covers most of the information. By analysing the positive and negative correlations between the factor loading coefficients of these 2 principal components affecting the engineering sweet spot, these two principal components were identified as the damage resistance factor and the external confining stress factor, respectively. By analysing the rock number composite scores of the principal components, the specific locations of the dominant reservoirs were precisely located, and the dominant reservoirs were located at 2085-2095m, 2035-2045m, 1955-1965m, 1975-1985m and 2005-2015m. This result is more conducive to the realisation of the project, with high accuracy.
| Published in | American Journal of Civil Engineering (Volume 13, Issue 4) |
| DOI | 10.11648/j.ajce.20251304.13 |
| Page(s) | 211-221 |
| Creative Commons |
This is an Open Access article, distributed under the terms of the Creative Commons Attribution 4.0 International License (http://creativecommons.org/licenses/by/4.0/), which permits unrestricted use, distribution and reproduction in any medium or format, provided the original work is properly cited. |
| Copyright |
Copyright © The Author(s), 2025. Published by Science Publishing Group |
PCA, Dense Sandstone, Engineering Dessert, Comprehensive Evaluation
 , The process of linear transformation results in the conversion of the original set of variables into a new set of variables that are no longer related to each other
  , In the context of such transformations, it is imperative to note that (
  ) the total variance remains constant.
  possesses the maximum variance and is designated as the primary component;
  possesses the second - largest variance and is designated as the secondary.
 Core number | Burial depth /m | Core densi-ty g/cm3 | Poisson ratio | Modulus of elasticity /MPa | Tensile strength /MPa | Compress-ive strength /MPa | Perimeter pressure /MPa | Minimum horizon-tal ground stress /MPa | Maximum horizon-tal ground stress /MPa |
|---|---|---|---|---|---|---|---|---|---|
1-1 | 1900 | 2.659 | 0.4999890 | 19336.63 | 9.67 | 193.37 | 19.80 | 32.18 | 47.46 |
1-2 | 1910 | 2.625 | 0.4999852 | 19066.55 | 9.53 | 190.67 | 19.65 | 31.94 | 41.67 |
1-3 | 1920 | 2.624 | 0.4999858 | 19062.57 | 9.53 | 190.63 | 19.75 | 32.09 | 42.49 |
1-4 | 1930 | 2.612 | 0.4999861 | 18977.40 | 9.49 | 189.78 | 19.76 | 32.11 | 42.91 |
1-5 | 1940 | 2.66 | 0.4999872 | 19332.25 | 9.67 | 193.32 | 20.23 | 32.87 | 45.42 |
1-6 | 1950 | 2.626 | 0.4999884 | 19092.59 | 9.55 | 190.93 | 20.07 | 32.62 | 46.95 |
1-7 | 1960 | 2.702 | 0.4999871 | 19636.90 | 9.82 | 196.37 | 20.76 | 33.74 | 46.66 |
1-8 | 1970 | 2.638 | 0.4999862 | 19166.73 | 9.58 | 191.67 | 20.37 | 33.10 | 44.51 |
1-9 | 1980 | 2.684 | 0.4999875 | 19509.10 | 9.75 | 195.09 | 20.83 | 33.85 | 47.60 |
1-10 | 1990 | 2.589 | 0.4999858 | 18808.24 | 9.40 | 188.08 | 20.20 | 32.82 | 43.55 |
1-11 | 2000 | 2.565 | 0.4999861 | 18635.43 | 9.32 | 186.36 | 20.11 | 32.68 | 43.64 |
1-12 | 2010 | 2.627 | 0.4999836 | 19071.88 | 9.54 | 190.72 | 20.70 | 33.64 | 42.61 |
1-13 | 2020 | 2.55 | 0.4999868 | 18530.60 | 9.27 | 185.31 | 20.19 | 32.81 | 44.75 |
1-14 | 2030 | 2.594 | 0.4999861 | 18846.57 | 9.42 | 188.47 | 20.64 | 33.54 | 45.06 |
1-15 | 2040 | 2.648 | 0.4999851 | 19233.02 | 9.62 | 192.33 | 21.18 | 34.41 | 45.21 |
1-16 | 2050 | 2.544 | 0.4999914 | 18516.50 | 9.26 | 185.17 | 20.44 | 33.22 | 56.23 |
1-17 | 2060 | 2.447 | 0.4999906 | 17804.97 | 8.90 | 178.05 | 19.76 | 32.11 | 51.10 |
1-18 | 2070 | 2.325 | 0.4999930 | 16933.52 | 8.47 | 169.34 | 18.87 | 30.66 | 57.86 |
1-19 | 2080 | 2.559 | 0.4999896 | 18613.14 | 9.31 | 186.13 | 20.87 | 33.91 | 51.76 |
1-20 | 2090 | 2.627 | 0.4999869 | 19090.67 | 9.55 | 190.91 | 21.52 | 34.97 | 48.31 |
1-21 | 2100 | 2.567 | 0.4999900 | 18674.46 | 9.34 | 186.75 | 21.13 | 34.34 | 53.85 |
 samples, each of which contains
  indicators, it is possible to construct an
  data matrix
  :
: 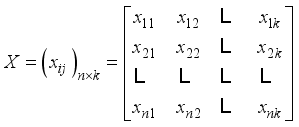 (1)
(1)  are to be defined as the 'original variables'.
 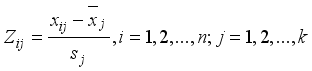 (2)
(2) 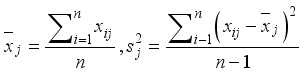 , yields the normalized matrix Z.
 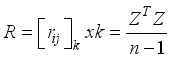 (3)
(3) 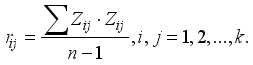
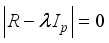 for the correlation matrix R to obtain P eigenroots, determine the principal components, for each eigenroot
 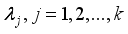 such that
  Kaiser eigenvalue >1 criterion, determine the value of
  . Solve the equation
  to obtain the unit eigenvector
  .
.  (4)
(4)  is called the first principal component,
  is called the second principal component,...,
  is called the
  th principal component. The weighted summation of the individual principal components yields the final evaluation value, with the weights being the variance contribution ratio of each principal component.
 X1Burial depth /m | X2Core density g/cm3 | X3Poisson ratio | X4Modulus of elasticity /MPa | X5Tensile strength /MPa | X6Compressive strength /MPa | X7Perimeter pressure /MPa | X8Minimum horizontal ground stress /MPa | X9Maximum horizontal ground stress /MPa |
|---|---|---|---|---|---|---|---|---|
-1.611646 | 0.778566 | 0.641061 | 0.806347 | 0.809657 | 0.806638 | -0.842409 | -0.838205 | 0.073339 |
-1.450481 | 0.371912 | -0.982960 | 0.354860 | 0.341076 | 0.355233 | -1.082989 | -1.075140 | -1.189730 |
-1.289317 | 0.359951 | -0.726536 | 0.348207 | 0.341076 | 0.348545 | -0.922602 | -0.927055 | -1.010850 |
-1.128152 | 0.216427 | -0.598323 | 0.205830 | 0.207196 | 0.206436 | -0.906564 | -0.907311 | -0.919228 |
-0.966988 | 0.790526 | -0.128212 | 0.799025 | 0.809657 | 0.798279 | -0.152749 | -0.157016 | -0.371680 |
-0.805823 | 0.383872 | 0.384636 | 0.398391 | 0.408016 | 0.398702 | -0.409367 | -0.403824 | -0.037916 |
-0.644658 | 1.292864 | -0.170950 | 1.308302 | 1.311708 | 1.308200 | 0.697298 | 0.701873 | -0.101178 |
-0.483494 | 0.527397 | -0.555586 | 0.522329 | 0.508426 | 0.522420 | 0.071792 | 0.070046 | -0.570194 |
-0.322329 | 1.077576 | 0.000000 | 1.094662 | 1.077417 | 1.094200 | 0.809568 | 0.810468 | 0.103879 |
-0.161165 | -0.058663 | -0.726536 | -0.076951 | -0.094035 | -0.077782 | -0.200865 | -0.206378 | -0.779614 |
0.000000 | -0.345713 | -0.598323 | -0.365834 | -0.361795 | -0.365344 | -0.345212 | -0.344590 | -0.759981 |
0.161165 | 0.395833 | -1.666758 | 0.363770 | 0.374546 | 0.363592 | 0.601066 | 0.603150 | -0.984672 |
0.322329 | -0.525119 | -0.299162 | -0.541076 | -0.529146 | -0.540890 | -0.216903 | -0.216250 | -0.517839 |
0.483494 | 0.001139 | -0.598323 | -0.012876 | -0.027095 | -0.012579 | 0.504835 | 0.504427 | -0.450213 |
0.644658 | 0.647001 | -1.025697 | 0.633145 | 0.642306 | 0.632764 | 1.370920 | 1.363317 | -0.417491 |
Ingredient | The characteristic root value | Variance contribution (%) | Cumulative variance contribution (%) |
|---|---|---|---|
1 | 5.84 | 64.886 | 64.886 |
2 | 2.368 | 26.313 | 91.199 |
3 | 0.772 | 8.573 | 99.772 |
4 | 0.02 | 0.227 | 99.999 |
5 | / | 0.001 | 100 |
6 | / | / | 100 |
7 | / | / | 100 |
8 | / | / | 100 |
9 | / | / | 100 |
Title | Principal componentF1 | Principal componentF2 | Commonality (common factor variance) |
|---|---|---|---|
X1 | -0.52 | 0.813 | 0.931 |
X2 | 0.984 | 0.011 | 0.968 |
X3 | -0.783 | 0.223 | 0.663 |
X4 | 0.981 | 0.017 | 0.962 |
X5 | 0.981 | 0.016 | 0.962 |
X6 | 0.981 | 0.016 | 0.962 |
X7 | 0.531 | 0.843 | 0.992 |
X8 | 0.531 | 0.843 | 0.992 |
X9 | -0.734 | 0.486 | 0.776 |
Title | Principal Component 1 Vandal Resistance Factor | Principal Component 2 External Constraint Stress Factor |
|---|---|---|
X1 | -0.089 | 0.343 |
X2 | 0.169 | 0.005 |
X3 | -0.134 | 0.094 |
X4 | 0.168 | 0.007 |
X5 | 0.168 | 0.007 |
X6 | 0.168 | 0.007 |
X7 | 0.091 | 0.356 |
X8 | 0.091 | 0.356 |
X9 | -0.126 | 0.205 |
title | variance explained rate (%) | Cumulative variance explained (%) | Weights (%) |
|---|---|---|---|
Vandal Resistance Factor F1 | 0.649 | 64.886 | 71.147 |
External Constraint Stress FactorF2 | 0.263 | 91.199 | 28.853 |
Rank | Rock number | Fracturability score | Vandal Resistance Factor | External Constraint Stress Factor |
|---|---|---|---|---|
1 | 1-20 | 0.897 | 0.489 | 1.902 |
2 | 1-15 | 0.87 | 0.807 | 1.026 |
3 | 1-7 | 0.859 | 1.098 | 0.27 |
4 | 1-9 | 0.785 | 0.893 | 0.519 |
5 | 1-12 | 0.531 | 0.694 | 0.13 |
6 | 1-5 | 0.321 | 0.659 | -0.512 |
7 | 1-8 | 0.316 | 0.553 | -0.268 |
8 | 1-14 | 0.236 | 0.177 | 0.38 |
9 | 1-21 | 0.223 | -0.444 | 1.869 |
10 | 1-19 | 0.047 | -0.477 | 1.339 |
11 | 1-1 | 0.005 | 0.434 | -1.053 |
12 | 1-6 | 0.003 | 0.219 | -0.528 |
13 | 1-10 | -0.037 | 0.124 | -0.434 |
14 | 1-3 | -0.105 | 0.407 | -1.367 |
15 | 1-2 | -0.136 | 0.454 | -1.591 |
16 | 1-4 | -0.175 | 0.269 | -1.269 |
17 | 1-11 | -0.226 | -0.128 | -0.470 |
18 | 1-13 | -0.285 | -0.323 | -0.191 |
19 | 1-16 | -0.360 | -0.896 | 0.962 |
20 | 1-17 | -1.237 | -1.716 | -0.056 |
21 | 1-18 | -2.535 | -3.296 | -0.658 |
TOC | Total Organic Carbon |
CNN | Convolutional Neural Network |
PCA | Principal Component Analysis |
PCS | Principal Components |
| [1] | Bai X, Li Z, Lai F, et al. Method for evaluation of engineering sweet spots tight sandstone reservoir production wells [J]. Arabian Journal of Geosciences, 2021, 14(24): 1-12. |
| [2] | Liu Z, Tang X, Liu H, et al. Predicting the engineering sweet spot of coal-bed methane reservoirs: a case study from Central China [J]. Arabian Journal of Geosciences, 2022, 15(7): 1-9. |
| [3] | Liu S, Liu Y, Zhang X, et al. Geological and Engineering Integrated Shale Gas Sweet Spots Evaluation Based on Fuzzy Comprehensive Evaluation Method: A Case Study of Z Shale Gas Field HB Block [J]. Energies, 2022, 15. |
| [4] | Qiu X, Zhang J, Lei H, et al. Comprehensive evaluation of geology-engineering “sweet spot” of tight oil reservoir in Maling Area, Ordos Basin, China [J]. Carbonates and Evaporites, 2025, 40(1). |
| [5] | Guo D, Zhang L, Ma B, et al. Dessert Lithofacies Study of Fengxi Tight Oil in Qaidam Basin [J]. Journal of Physics: Conference Series, 2024, 2834(1). |
| [6] | Jiang M, Peng C, Wu J, et al. A New Approach to a Fracturing Sweet Spot Evaluation Method Based on Combined Weight Coefficient Method—A Case Study in the BZ Oilfield, China [J]. Processes, 2024, 12(9). |
| [7] | Yu Z, Ma S, Mallick S, et al. Prediction of shale oil “sweet spot” parameters centered on seismic prestack waveform inversion [J]. Geoenergy Science and Engineering, 2024, 241(000): 11. |
| [8] | Wu Y, Jiang F, Hu T, et al. Shale oil content evaluation and sweet spot prediction based on convolutional neural network [J]. Marine and Petroleum Geology, 2024, 167(000): 15. |
| [9] | Wang H, Guo Z, Kong X, et al. Application of Machine Learning for Shale Oil and Gas “Sweet Spots” Prediction [J]. Energies, 2024, 17(9): 2191. |
| [10] | Xiao Z, Jianguang W, Xiaofeng Z, et al. A New Method for Evaluating Fracability Based on Cluster Analysis and Well Logging Petrophysical Facies Division [J]. Journal of Physics: Conference Series, 2023, 2610(1). |
| [11] | Zeng Q, Chen S, He P, et al. Quantitative prediction of shale gas sweet spots based on seismic data in Lower Silurian Longmaxi Formation, Weiyuan area, Sichuan Basin, SW China [J]. Petroleum Exploration and Development Online, 2018, 45(3): 422-430. |
| [12] | Zhang S, Liu H, Liu Y, et al. Main controls and geological sweet spot types in Paleogene shale oil rich areas of the Jiyang Depression, Bohai Bay basin, China [J]. Marine and Petroleum Geology, 2020, 111, 576-587. |
| [13] | Liu Z, Xie Z, Wang C X, et al. Preferred Selection of Fractured Sweet Spot Section for Horizontal Shale Oil Well in West 233 Area [C]. Journal of Physics: Conference Series. IOP Publishing, 2023, 2563(1): 012-036. |
| [14] | Shen Y, Liu B, Jiang H, et al. Geological and Engineering Integration Fracturing Design and Optimization Study of Liushagang Formation in Weixinan Sag [J]. Journal of Marine Science and Engineering, 2024, 12(10): 1821. |
| [15] | Chong K K, Grieser W V, Passman A, et al. A completions guide book to shale-play development: a review of successful approaches toward shale-play stimulation in the last two decades [C]. SPE Canadian Unconventional Resources and International Petroleum Conference, Calgary, Alberta, Canada, 2010. |
| [16] | Jin X, Shah S N, Roegiers J C, et al. Fracability evaluation in shale reservoirs-an integrated petrophysics and geomechanics approach [C]. SPE Hydraulic Fracturing Technology Conference, The Woodlands, Texas, USA, 2014. |
| [17] | Yuan J, Zhou J, Liu S, et al. An improved fracability-evaluation method for shale reservoirs based on new fracture toughness-prediction models. SPE Journal, 2017, 22(05), 1704-1713. |
| [18] | Peng C Y, Liu W J, Huang Z X, et al. An integrated multi-scale fracability evaluation method for tight sandstone reservoir [C]. ISRM International Symposium-Asian Rock Mechanics Symposium. ISRM, 2021: ISRM-ARMS11-2021-322. |
| [19] | Kaiser, Henry F. The application of electronic computers to factor analysis."Educational and psychological measurement, 20.1 (1960): 141-151. |
APA Style
Wenying, S., Junbin, C., Diguang, G., Xiaoming, W., Ruidong, S., et al. (2025). Comprehensive Evaluation of PCA-based Engineering Sweet Spot Logging in Tight Sandstone Reservoirs -- Example of Y96 Well in Long 7 Section of Tiezhuzi Block in Ordos Basin. American Journal of Civil Engineering, 13(4), 211-221. https://doi.org/10.11648/j.ajce.20251304.13
ACS Style
Wenying, S.; Junbin, C.; Diguang, G.; Xiaoming, W.; Ruidong, S., et al. Comprehensive Evaluation of PCA-based Engineering Sweet Spot Logging in Tight Sandstone Reservoirs -- Example of Y96 Well in Long 7 Section of Tiezhuzi Block in Ordos Basin. Am. J. Civ. Eng. 2025, 13(4), 211-221. doi: 10.11648/j.ajce.20251304.13
AMA Style
Wenying S, Junbin C, Diguang G, Xiaoming W, Ruidong S, et al. Comprehensive Evaluation of PCA-based Engineering Sweet Spot Logging in Tight Sandstone Reservoirs -- Example of Y96 Well in Long 7 Section of Tiezhuzi Block in Ordos Basin. Am J Civ Eng. 2025;13(4):211-221. doi: 10.11648/j.ajce.20251304.13
@article{10.11648/j.ajce.20251304.13,
  author = {Song Wenying and Chen Junbin and Gong Diguang and Wang Xiaoming and Shi Ruidong and Zhang Chengming},
  title = {Comprehensive Evaluation of PCA-based Engineering Sweet Spot Logging in Tight Sandstone Reservoirs -- Example of Y96 Well in Long 7 Section of Tiezhuzi Block in Ordos Basin
},
  journal = {American Journal of Civil Engineering},
  volume = {13},
  number = {4},
  pages = {211-221},
  doi = {10.11648/j.ajce.20251304.13},
  url = {https://doi.org/10.11648/j.ajce.20251304.13},
  eprint = {https://article.sciencepublishinggroup.com/pdf/10.11648.j.ajce.20251304.13},
  abstract = {Under the geological conditions of sandstone reservoirs in the long 7 sections of Tiezhuizi block, with the increase in the depth of burial and the complexity of geological structure, it leads to the status quo of generally low production capacity of horizontal wells. In the face of this challenge, the optimisation of fracturing engineering desserts is particularly difficult. To cope with this challenge, this study is dedicated to finding a high-precision method for quantitative evaluation of reservoir engineering sweet spots. In this study, principal component analysis was adopted to comprehensively and meticulously analyse nine key engineering sweet spot factors, including core density, elastic modulus, Poisson's ratio, and perimeter pressure. The screening criteria of eigenvalue > 1 accurately identified 2 factors that mainly affect the engineering sweet spot. The cumulative explained variance of these two principal components reaches 91.199 %, which almost covers most of the information. By analysing the positive and negative correlations between the factor loading coefficients of these 2 principal components affecting the engineering sweet spot, these two principal components were identified as the damage resistance factor and the external confining stress factor, respectively. By analysing the rock number composite scores of the principal components, the specific locations of the dominant reservoirs were precisely located, and the dominant reservoirs were located at 2085-2095m, 2035-2045m, 1955-1965m, 1975-1985m and 2005-2015m. This result is more conducive to the realisation of the project, with high accuracy.},
 year = {2025}
}
TY  - JOUR
T1  - Comprehensive Evaluation of PCA-based Engineering Sweet Spot Logging in Tight Sandstone Reservoirs -- Example of Y96 Well in Long 7 Section of Tiezhuzi Block in Ordos Basin

AU  - Song Wenying
AU  - Chen Junbin
AU  - Gong Diguang
AU  - Wang Xiaoming
AU  - Shi Ruidong
AU  - Zhang Chengming
Y1  - 2025/07/23
PY  - 2025
N1  - https://doi.org/10.11648/j.ajce.20251304.13
DO  - 10.11648/j.ajce.20251304.13
T2  - American Journal of Civil Engineering
JF  - American Journal of Civil Engineering
JO  - American Journal of Civil Engineering
SP  - 211
EP  - 221
PB  - Science Publishing Group
SN  - 2330-8737
UR  - https://doi.org/10.11648/j.ajce.20251304.13
AB  - Under the geological conditions of sandstone reservoirs in the long 7 sections of Tiezhuizi block, with the increase in the depth of burial and the complexity of geological structure, it leads to the status quo of generally low production capacity of horizontal wells. In the face of this challenge, the optimisation of fracturing engineering desserts is particularly difficult. To cope with this challenge, this study is dedicated to finding a high-precision method for quantitative evaluation of reservoir engineering sweet spots. In this study, principal component analysis was adopted to comprehensively and meticulously analyse nine key engineering sweet spot factors, including core density, elastic modulus, Poisson's ratio, and perimeter pressure. The screening criteria of eigenvalue > 1 accurately identified 2 factors that mainly affect the engineering sweet spot. The cumulative explained variance of these two principal components reaches 91.199 %, which almost covers most of the information. By analysing the positive and negative correlations between the factor loading coefficients of these 2 principal components affecting the engineering sweet spot, these two principal components were identified as the damage resistance factor and the external confining stress factor, respectively. By analysing the rock number composite scores of the principal components, the specific locations of the dominant reservoirs were precisely located, and the dominant reservoirs were located at 2085-2095m, 2035-2045m, 1955-1965m, 1975-1985m and 2005-2015m. This result is more conducive to the realisation of the project, with high accuracy.
VL  - 13
IS  - 4
ER  -
College of Petroleum Engineering, Xi'an Shiyou University, Xi'an, China. College of Petroleum Engineering and The Key Laboratory of Well Stability and Fluid & Rock Mechanics in Oil and Gas Reservoirs, Xi'an Shiyou University, Xi'an, China
College of Petroleum Engineering, Xi'an Shiyou University, Xi'an, China. College of Petroleum Engineering and The Key Laboratory of Well Stability and Fluid & Rock Mechanics in Oil and Gas Reservoirs, Xi'an Shiyou University, Xi'an, China
College of Petroleum Engineering, Xi'an Shiyou University, Xi'an, China. College of Petroleum Engineering and The Key Laboratory of Well Stability and Fluid & Rock Mechanics in Oil and Gas Reservoirs, Xi'an Shiyou University, Xi'an, China
College of Petroleum Engineering, Xi'an Shiyou University, Xi'an, China. College of Petroleum Engineering and The Key Laboratory of Well Stability and Fluid & Rock Mechanics in Oil and Gas Reservoirs, Xi'an Shiyou University, Xi'an, China
College of Petroleum Engineering, Xi'an Shiyou University, Xi'an, China. College of Petroleum Engineering and The Key Laboratory of Well Stability and Fluid & Rock Mechanics in Oil and Gas Reservoirs, Xi'an Shiyou University, Xi'an, China
College of Petroleum Engineering, Xi'an Shiyou University, Xi'an, China. College of Petroleum Engineering and The Key Laboratory of Well Stability and Fluid & Rock Mechanics in Oil and Gas Reservoirs, Xi'an Shiyou University, Xi'an, China
Table 1. The following data has been obtained from the Y96 well in the 7th segment of the E'erduosi projectcomponent. In sequence,![]() components can be derived from
components can be derived from![]() variables, and the variances gradually diminish, becoming independent of the preceding components.
variables, and the variances gradually diminish, becoming independent of the preceding components.
Table of results of standardisation of engineering dessert data for each well Y96.
Table 3. Explanatory table of total variance for each indicator for well Y96.
Table of factor loading coefficients.
Table 5. Matrix of principal components (eigenvectors).
Table 6. Factor weighting analysis table.
Table 7. Fracturability scores of reservoirs hosting individual rocks at different depths.
Information