Abstract
At present, the principle, data acquisition, data processing, and/or interpretation of many microseismic monitoring methods around the world are far from the requirements of microseismic monitoring characteristics, and impossible to analyze the microseismicity. The main technical reason for the situation is still the lack of understanding the characteristics of microseismic and corresponding monitoring for it, so that the monitoring R&D and application are not based on strict seismology, geology, rock mechanics, a large number of reliable experiments and mathematical statistics. We first summarize the characteristics of microseismic and monitoring for it. Based on this, as well as the basic requirements of seismometry, various monitoring methods are discussed, including their applicable conditions, limitations and development prospects. The summary and discussion show that the development and application of microseismic monitoring, even avoiding strong noise sources as much as possible during data acquisition, and effectively denoising during processing, have to face the reality of low signal-to-noise ratio (S/N): in most cases, whether the microseismic signal is implied in the background noise recording, the number of microseismics, and the initial motion form of any microseismic arrival are not known. We then report that in the past 2-3 years, our Vector Scanning (VS) for microseismic ground monitoring has been greatly improved, including: an in-depth understanding of the available principles, the refinement of the conditions necessary for the success of the application with a high probability, and the quantitative integration of automated data processing and interpretation; Among them, the most important is an in-depth understanding of the existing principles: VS uses the focal mechanism (i.e., the relationship between the strain and the stress fields) to implement large-scale migration and stacking, carry out various possible combinations of positive and negative initial movements for all seismic stations, and select the spatiotemporal distribution with high probability of the greater microseismic released energy (i.e., the correlation coefficient recorded of stations, also the minimum S/N). A large number of cases are available for mathematical statistics, which provide a basis for analyzing the details of microseismicity. Finally, we describe the specific morphology of the stimulated rock volume in stimulation, the equivalent microseismic focal mechanism, and the effect of production measures such as in-situ pump shutdown. The necessary conditions, monitoring output patterns and analyses described in the paper also provide a basis for the test of the microseismic methods.
|
Published in
|
American Journal of Energy Engineering (Volume 13, Issue 3)
|
|
DOI
|
10.11648/j.ajee.20251303.12
|
|
Page(s)
|
107-117 |
|
Creative Commons
|

This is an Open Access article, distributed under the terms of the Creative Commons Attribution 4.0 International License (http://creativecommons.org/licenses/by/4.0/), which permits unrestricted use, distribution and reproduction in any medium or format, provided the original work is properly cited.
|
|
Copyright
|
Copyright © The Author(s), 2025. Published by Science Publishing Group
|
Keywords
Microseismic, Monitoring, Review, Vector-Scanning, Unconventional
1. Introduction
This paper is a research report on the current situation of microseismic monitoring. Following the review article in January 2023
| [1] | Liang Beiyuan, Chang Li, Fang Dazhi, et al. Microseismic and its monitoring—toward vector scanning of microseismic based on lower signal to noise ratio. Progress in Geophysics. 2023, 38(1), 47-75. (In Chinese but English abstract) |
[1]
, we have maintained our attention to the current status of microseismic monitoring by participating in professional conferences at home and abroad, reviewing relevant microseismic monitoring literature, technical exchanges, and actual monitoring comparisons. At present, the situation of microseismic monitoring is not optimistic. The principles, data acquisition, data processing, and/or interpretation of many monitoring methods are far from the requirements of microseismic monitoring characteristics; the main reason is still the lack of understanding of microseismic characteristics and the corresponding monitoring characteristics, or the development and testing of methods are not based on strict seismology.
During the last 2-3 years, our Vector Scanning (VS), a method to migrate and stack seismic data with lower S/N and for microseismic ground monitoring, has been greatly improved. This includes a deeper understanding of the monitoring principles
| [1] | Liang Beiyuan, Chang Li, Fang Dazhi, et al. Microseismic and its monitoring—toward vector scanning of microseismic based on lower signal to noise ratio. Progress in Geophysics. 2023, 38(1), 47-75. (In Chinese but English abstract) |
| [2] | Liang Beiyuan, and Wang Jianli. An enormous challenge: Understanding the microseismic features. Science Technology and Engineering. 2017, 18(13), 14-21. (In Chinese but English abstract) |
| [3] | Feng Y., Liang B., and Wang W. Monitoring for microseismicity induced by goaf collapse at coal mine. EAGE, Near Surface Geoscience Conference & Exhibition 2022, Geophysical Methods in Mining Engineering. Paper number 53. Belgrade, Serbia. |
| [4] | Liang B., Guo B. Statistics in Vector Scanning for Microseismic. EAGE 5th Petroleum Geostatics, 2023, Paper number 15, Porto, Portugal. |
[1-4]
, the addition and refinement of the conditions necessary for the success of VS applications with a high probability of success
| [4] | Liang B., Guo B. Statistics in Vector Scanning for Microseismic. EAGE 5th Petroleum Geostatics, 2023, Paper number 15, Porto, Portugal. |
| [5] | Wu Gang, Cai Jiang, Zhao Yewei, et al. Ground monitoring for fracturing microseismic of two ultra-deep wells. SEG 1st Tarim Ultra-Deep Oil & Gas Exploration Technology Workshop, 2024, 2024-UD-06X-OR-080. Korla, China. |
[4, 5]
, and the quantitative integration of these conditions into one process of data processing and interpretation automation. A large number of reliable monitoring cases that meet the necessary conditions are available for mathematical statistics, which provides a basis for analyzing the details of microseismicity.
Chapter 2 describes microseismic and its monitoring in general, and in particular summarizes microseismic and its corresponding monitoring characteristics. Based on these characteristics, Chapter 3 evaluates the advantages and disadvantages of various monitoring methods, analyzes the limitations of the methods and corresponding technical reasons, and gives suggestions for development. The characteristics of microseismic monitoring determine that it is impossible to follow the past ways, even if strong noise sources are avoided and effective noise removal. One can only be based on the reality of low signal-to-noise ratio (S/N), coexist with noise, and use mathematical statistics and the principle of shear focal mechanism to extract microseismicity. Chapters 4 and 5 report on the development and application of VS following the characteristics of microseismic monitoring. Chapter 4 summarizes the VS principle and the eight prerequisites for its successful application. Chapter 5 describes the specific morphology of the effective Stimulated Rock Volume (SRV) output from the VS ground monitoring for fracturing microseismicity, the relationship between the corresponding deformation and the stress fields, i.e., the equivalent microseismic focal mechanism, and the effect of stimulation measures such as in-situ pump shutdown. Chapter 6 is conclusion.
The limitations, reliability requirements, SRV features, and some analyses of microseismic monitoring described in this paper also provide a basis for the verification of microseismic monitoring. It is hoped that the development, application and testing of such monitoring methods will be based on solid seismology, geology, signal processing, a large number of engineering experiments and mathematical statistics.
VS has paved the way for cost-effective and production-accompanying ground microseismic monitoring. It is also highly likely to be integrated with borehole proximity monitoring (BPM) through the following technical development routes aimed at improving monitoring quality:
1) Using difference between the observed and calculated based on the velocity model, inverting for jointly correct the traditional location and velocity model;
2) Use of migration stacking for data processing.
These advancements will significantly expand the monitoring scope and enhance the quality of BPM, making it the best scientific method for detailed research on microseismicity, albeit at a higher cost. This will establish a solid foundation and comprehensive methodology for the development of microseismic monitoring, forming a robust microseismology.
2. Microseismic and Its Monitoring Characteristics
Microseismics are tiny quakes in underground rocks. Their intensity is magnitude M: M≤0, microseismic; Among them, M>-1.5, strong microseismic. 0<M≤3, small earthquake. The rest are moderate, large, and strong earthquakes
| [1] | Liang Beiyuan, Chang Li, Fang Dazhi, et al. Microseismic and its monitoring—toward vector scanning of microseismic based on lower signal to noise ratio. Progress in Geophysics. 2023, 38(1), 47-75. (In Chinese but English abstract) |
| [6] | Maxwell S. Microseismic imaging of hydraulic fracturing: Improved Engineering of unconventional shale reservoirs. Distinguished instructor short course. 2014, Houston: SEG. |
| [7] | Liang B, Zhu G. Microseismic technology in exploration and development. 2004, Beijing: Petroleum Industry Press. (In Chinese) |
[1, 6, 7]
.
The scope and significance of microseismic monitoring include:
1) Fracturing of (un)conventional reservoirs;
2) Extending the range of borehole proximity traditional location;
3) Safety assessment of access process of oil/gas et al. depots;
4) Estimating the front of injected steam/water in production;
5) Early safety warning of mines, roadways, et al.;
6) Determining the boundaries and internal characteristics of coal burning areas;
7) Estimating cross-border mining;
8) Assistant of artificial seismic exploration using strong microseismics;
9) General study of tectonics, seismicity, stress field; et al.
Thousands of microseismics occur underground every day. From the perspective of seismology, we study and obtain through microseismic monitoring:
1) The spatiotemporal pattern (x, y, z, t0, M) of microseismicity (or its energy release) in target area, where t0 is origin time of an event or microseismic group;
2) The correlation between the pattern and the events of production/life in the corresponding time and space;
3) Known or probable local physical and geological tectonic properties corresponding to such patterns and associations.
Table 1.
The characteristics of microseismic and corresponding its monitoring | [1] | Liang Beiyuan, Chang Li, Fang Dazhi, et al. Microseismic and its monitoring—toward vector scanning of microseismic based on lower signal to noise ratio. Progress in Geophysics. 2023, 38(1), 47-75. (In Chinese but English abstract) |
| [2] | Liang Beiyuan, and Wang Jianli. An enormous challenge: Understanding the microseismic features. Science Technology and Engineering. 2017, 18(13), 14-21. (In Chinese but English abstract) |
| [3] | Feng Y., Liang B., and Wang W. Monitoring for microseismicity induced by goaf collapse at coal mine. EAGE, Near Surface Geoscience Conference & Exhibition 2022, Geophysical Methods in Mining Engineering. Paper number 53. Belgrade, Serbia. |
| [4] | Liang B., Guo B. Statistics in Vector Scanning for Microseismic. EAGE 5th Petroleum Geostatics, 2023, Paper number 15, Porto, Portugal. |
| [5] | Wu Gang, Cai Jiang, Zhao Yewei, et al. Ground monitoring for fracturing microseismic of two ultra-deep wells. SEG 1st Tarim Ultra-Deep Oil & Gas Exploration Technology Workshop, 2024, 2024-UD-06X-OR-080. Korla, China. |
| [6] | Maxwell S. Microseismic imaging of hydraulic fracturing: Improved Engineering of unconventional shale reservoirs. Distinguished instructor short course. 2014, Houston: SEG. |
| [7] | Liang B, Zhu G. Microseismic technology in exploration and development. 2004, Beijing: Petroleum Industry Press. (In Chinese) |
| [8] | Chen M., Sun L., Shi Y. et al. Statistics in Vector Scanning for Microseismic. Science Technology and Engineering. 2025. (In Chinese but English abstract) |
Microseismic characteristics | Corresponding characteristics of microseismic monitoring |
Tiny (fracturing magnitude M≈ [-3,-2], equivalent to firecrackers and bullets; The artificial earthquake of seismic exploration is hundreds of g to tens of kg of explosive, M= [0, 1.5]. The collapse of the mine cavity can cause the M>2 event, generally a strong microseismic M = [-1.5,0].) | Generally a few hundred meters away from a hypocenter, the amplitude of the microseismic arrivals are close to that of the background noise, and the traditional seismic relocation fails. It follows from this that at the surface, microseismic signals are often drowned in the background noise. Strong noise sources must be avoided. Each seismic station should be set up at a quiet place to improve S/N. It is necessary to effectively denoise, such as resonance and excitation of pumping units, and large-area pollution for stations from heavy vehicles and teleseismic seismic events, so that the background noise record is basically random. Even so, residual noise may accompany the whole process of monitoring, until the final intepretation for microseismicity. Due to tiny, people do not know the number of microseismic events, S/N, and initial polarity in the records of a certain period, but because of the huge microseismic quantities and many stations, so they may use the concepts of probability, mathematical statistics, and focal mechanism to obtain microseismic information from a large number of records. |
Shear rupture is predominant (compression produces shear rupture. During fracturing, it is basically shear rupture out of a distance of meters from the borehole.) | Microseismics are generally passive earthquakes, and the shear rupture mechanism is dominant. Shear dislocation emits longitudinal and transverse waves with different initial signs of compression or stretch in different directions. Transverse wave has an amplitude at least several times that of longitudinal wave, with a low frequency, slowly decaying, and thus propagating far 9].Shear waves are mainly used in ground-based monitoring. It is necessary to analyze the vibration vector with the shear dislocation mechanism to extract the microseismic commonality. |
As with general seismic observation, microseismic monitoring must also meet the most basic requirements of seismology, and observers must understand the characteristics of various waveforms generated by earthquakes, the characteristics of observation instruments, the degree to which the monitoring network covers the target domain (at least in two dimensions), the advantages and disadvantages of different distribution geometries of the seismic network, and the error range of various processing methods
| [1] | Liang Beiyuan, Chang Li, Fang Dazhi, et al. Microseismic and its monitoring—toward vector scanning of microseismic based on lower signal to noise ratio. Progress in Geophysics. 2023, 38(1), 47-75. (In Chinese but English abstract) |
| [8] | Chen M., Sun L., Shi Y. et al. Statistics in Vector Scanning for Microseismic. Science Technology and Engineering. 2025. (In Chinese but English abstract) |
| [9] | Aki K, Richards P. G. Quantitative Seismology: Theory and Methods. 1980, San Francisco: W. H. Freeman and Company. |
| [10] | Bullen K. E and Bolt B. An introduction to the theory of Seismology, 1985, 4th edition. Cambridge: Cambridge. |
[1, 8-10]
.
However, the development and application of any monitoring method must be familiar with the monitoring objectives and their corresponding monitoring characteristics
| [2] | Liang Beiyuan, and Wang Jianli. An enormous challenge: Understanding the microseismic features. Science Technology and Engineering. 2017, 18(13), 14-21. (In Chinese but English abstract) |
[2]
. The two most basic characteristics of microseismic are: (1) micro, (2) shear rupture dominantly; The corresponding microseismic monitoring characteristics are listed in
Table 1. It is impossible for successful microseismic monitoring to copy the existing artificial seismic exploration and/or natural seismological software and hardware specially for general small earthquakes, and it must go through a large number of rigorous experiments and explorations, and innovate and develop. Microseismic monitoring and verification of its reliability is not easier than monitoring stealth aircraft and navigational vehicles, because the target and observerare separated by fluid over there, and the target can always be set and approached for comparative detection. The successful development, application, and testing of microseismic monitoring requires a solid foundation in seismology, geology, signal processing, mathematical statistics, automation, and programming.
3. Current Status of Microseismic Monitoring
Through the review of literatures and conferences, technical exchange, and monitoring comparison, we find that the current situation of microseismic monitoring in the world is not optimistic. The topic of the conference has not been interrupted, but the corresponding officially published academic literatures have decreased sharply in the past couple of years. The principles, data acquisition, data processing and/or data intepretation of many monitoring methods are far from the requirements of microseismic monitoring characteristics, and far from the stage of analyzing specific microseismicity. Based on microseismic and its monitoring characteristics, there can be a basic judgment on various monitoring methods (
Table 2).
Table 2.
Evaluation of various microseismic monitoring methods | [1] | Liang Beiyuan, Chang Li, Fang Dazhi, et al. Microseismic and its monitoring—toward vector scanning of microseismic based on lower signal to noise ratio. Progress in Geophysics. 2023, 38(1), 47-75. (In Chinese but English abstract) |
| [2] | Liang Beiyuan, and Wang Jianli. An enormous challenge: Understanding the microseismic features. Science Technology and Engineering. 2017, 18(13), 14-21. (In Chinese but English abstract) |
| [6] | Maxwell S. Microseismic imaging of hydraulic fracturing: Improved Engineering of unconventional shale reservoirs. Distinguished instructor short course. 2014, Houston: SEG. |
| [7] | Liang B, Zhu G. Microseismic technology in exploration and development. 2004, Beijing: Petroleum Industry Press. (In Chinese) |
| [8] | Chen M., Sun L., Shi Y. et al. Statistics in Vector Scanning for Microseismic. Science Technology and Engineering. 2025. (In Chinese but English abstract) |
Method sketching & advantage | Limitation | Suggestion |
Borehole Proximity Monitoring (BPM) Traditional relocation. The geophone array is placed in well(s) nearby observation target, such as a fracturing stage. The 4D distribution of microseismics is interpreted based on the M and focal geometry. When its limitations are overcome (see column Suggestion), because close to the target, it can be used as the best method for scientific research | It is required that there are observation well(s) in the vicinity of target. As the target (e.g., fracturing stage) moves away from the geophone array, there exists a distance (hundreds of meters), beyond which traditional location fails. The velocity of the medium adjacent to the geophone(s) is constantly decreasing due to the large number of microseismic swarms (e.g., fracking-induced) and is not corrected in time, often after 10-20 minutes, the events are wrongly located far away. The last two limitations, through the BPM reports in the literature, most of them have the problem or suspicion. | It can be used as the best method for scientific and technical research for microseismic because it can be close to the hypocenters, but: There should be ≥2 monitoring wells. The geophone array should cross the vertical thickness of reservoir. It shows that the traditional relocation of the hypocenter using the recorded arrivals with a point or circle is only valid within a few hundred meters from the geophone array; Or else, you can use migration and stacking to expand the monitoring range. The seismic relocation and velocity model should be continuously inverted at the same time to correct for the large changes in the mechanical properties of the medium during the fracturing. |
Large-scale 1-C geophone array on the ground Conventional location using longitudinal wave (or data stacking for energy distribution, or tracking the arrivals of longitudinal waves) Rarely, except for the purpose of monitoring stronger microseismic (e.g. M>-1). | The amplitude of the longitudinal wave is several times as small as that of the transverse wave. So we can see the microseismic waveform for an observation point by stacking >1,000 points for the location. Low success rate (<5%) and shallow monitoring depth (<2700m) (professional conference research) | Abandon, unless it is for the purpose of monitoring only strong microseismic |
Vector Scanning (VS) on the ground Generally using transverse waves. Using the migration and then stacking, and the principle of the focal mechanism to extract the commonality of all stations. Cost-effective, simple construction, 4D real-time reporting | There was a problem, i.e. the inability of fracturing surface monitoring to reliably determine the vertical height of SRV, has been resolved (see Chapter 5 below) | It can be used as a routine monitoring tool accompanying production (see Chapter 5 below) |
The main problems and technical reasons of microseismic monitoring found in the survey are listed in
Table 3.
Table 3.
Main problems and technical reasons found in the survey | [1] | Liang Beiyuan, Chang Li, Fang Dazhi, et al. Microseismic and its monitoring—toward vector scanning of microseismic based on lower signal to noise ratio. Progress in Geophysics. 2023, 38(1), 47-75. (In Chinese but English abstract) |
| [2] | Liang Beiyuan, and Wang Jianli. An enormous challenge: Understanding the microseismic features. Science Technology and Engineering. 2017, 18(13), 14-21. (In Chinese but English abstract) |
| [3] | Feng Y., Liang B., and Wang W. Monitoring for microseismicity induced by goaf collapse at coal mine. EAGE, Near Surface Geoscience Conference & Exhibition 2022, Geophysical Methods in Mining Engineering. Paper number 53. Belgrade, Serbia. |
| [4] | Liang B., Guo B. Statistics in Vector Scanning for Microseismic. EAGE 5th Petroleum Geostatics, 2023, Paper number 15, Porto, Portugal. |
| [5] | Wu Gang, Cai Jiang, Zhao Yewei, et al. Ground monitoring for fracturing microseismic of two ultra-deep wells. SEG 1st Tarim Ultra-Deep Oil & Gas Exploration Technology Workshop, 2024, 2024-UD-06X-OR-080. Korla, China. |
| [6] | Maxwell S. Microseismic imaging of hydraulic fracturing: Improved Engineering of unconventional shale reservoirs. Distinguished instructor short course. 2014, Houston: SEG. |
| [7] | Liang B, Zhu G. Microseismic technology in exploration and development. 2004, Beijing: Petroleum Industry Press. (In Chinese) |
| [8] | Chen M., Sun L., Shi Y. et al. Statistics in Vector Scanning for Microseismic. Science Technology and Engineering. 2025. (In Chinese but English abstract) |
Source, main problems, and technical reasons | Source, main problems, and technical reasons |
1. Borehole Proximity Monitoring 1) The geometric distribution of the seismic network is poor, such that the error is large. 2) The traditional location fails at a distance of several hundred of meters. 3) There is no the inversion for corrective locations and velocity model. 4) <10% of the cases overcame the limitations of the monitoring (Table 2) | 2. Ground monitoring 1) Stations are not deployed at discrete quiet points defined quantitatively. 2) Can't process recorded data for discrete points. 3) Can't process the shear waves. 4) It is not accepted that the number of microseismics, the accuracy of arrivals, and the initial polarities (focal mechanism) of ground monitoring in a certain period are generally unknown, so we can only admit the fact that the S/N is extremely low, and coexist with it. 5) Can't use mathematical statistical methods to calculate the focal mechanism in the sense of the probability from large-scale data stacking. 6) There is no effective denoising. |
3. Mine production and safety Adhere to the traditional relocation that is only suitable for strong microseismic (M≥-1.5), when the accident may have occurred. We have to raise the warning of strong microseismics and small earthquakes to the microseismic level | 4. Relevant training of academic and scientific research 1) Incomplete publication of microseismic hypocenters or corresponding released energy distributions (MHRED). 2) It does not indicate where the monitoring station network is. 3) No estimate of the error to be explained for all observations is given. 4) Doubts about monitoring methods and applications are limited to common sense or production data, etc., and can't be verified, instead of seismology, geology, rock mechanics, et al. 5) Is the MHRED perfectly symmetrical with respect to the well trace? 6) The MHRED ranges of fracturing stages of horizontal wells do not intersect with each other? 7) Is the orientation of MHRED exactly the same as the azimuth of maximum principal compressive stress (usually at an acute angle)? 8) Any R&D person needs to practice microseismic monitoring applications in depth and continuously; Among them, those with a background in natural seismology need to pay attention to the fineness of microseismic monitoring, and those with a background in exploration seismology need to understand the shear characteristics of natural earthquakes in detail. |
4. VS Principle for Microseismic Ground Monitoring
4.1. Theory
Thus, the development and application of microseismic monitoring have to be based on the reality of low S/N. The principle of VS microseismic ground monitoring can be briefly described as follows: in any period of time, generally, the number of microseismics and the initial arrivals are unknown; Therefore, when processing the data, VS uses the principle of the focal mechanism
| [9] | Aki K, Richards P. G. Quantitative Seismology: Theory and Methods. 1980, San Francisco: W. H. Freeman and Company. |
| [10] | Bullen K. E and Bolt B. An introduction to the theory of Seismology, 1985, 4th edition. Cambridge: Cambridge. |
[9, 10]
to implement large-scale migration and stacking, combines various possible initial motion trials, and selects the spatiotemporal distribution of microseismic released energy (i.e., the correlation coefficient of all stations, also the minimum S/N) in the sense of high probability. The specific formula
| [1] | Liang Beiyuan, Chang Li, Fang Dazhi, et al. Microseismic and its monitoring—toward vector scanning of microseismic based on lower signal to noise ratio. Progress in Geophysics. 2023, 38(1), 47-75. (In Chinese but English abstract) |
| [11] | Cheng Q. Digital signal processing, 2003, Beijing: Peking University Press. (In Chinese) |
| [12] | Press W, Teukolsky S., Vetterling W., et al. Numerical Recipes in C, the art of scientific computing. 2ndEdition. 1997. Cambridge: Cambridge. |
[1, 11, 12]
is
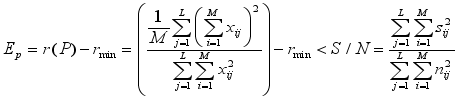 (1)
(1) The right end of the equation is the definition of S/N
| [13] | Robinson E. A., and Treitel S. Geophysical signal processing. 2000, Houston: SEG. |
[13]
. Vector x
ij = s
ij + n
ij, s
ij and n
ij are the samples of useful and noisy signals, respectively. E
P sums and then squares x
ij of each waveform of M stations, and then sums L samples in a time window. The middle part of the equation is the definition of the energy released by the microseismics, and it is also the definition of the correlation coefficient, which uses a certain waveform from all M stations, aligns a point P in space, and extracts the correlation coefficient r between them by the method of migration and stacking. 0≤r≤1. r
min is the minimum value in a time and space where the useful signal component is very small, and r(P)-r
min means that E
P starts at 0.
EP is also the lower limit of the S/N of point P; if this lower limit can be determined, and the true S/N is greater than it, we can determine whether there are microseismicity at this point in a period of time, and how reliable this monitoring is. EP≥1% can be considered as the threshold for the existence of microseismic in a certain time and space, which is the minimum value of S/N corresponding to the existence of higher microseismic released energy near the perforation section, according to the statistics of several thousands of fracturing stages/layers applied by VS. Except in special cases, the S/N found in general VS applications is mostly less than 10%.
The shear characteristics of microseismic must be taken into account in the stacking, i.e., the seismic waves radiating at the hypocenter propagate outward in a pattern of positive and negative (compression and pull) and some symmetrical quadrants of space
| [9] | Aki K, Richards P. G. Quantitative Seismology: Theory and Methods. 1980, San Francisco: W. H. Freeman and Company. |
| [10] | Bullen K. E and Bolt B. An introduction to the theory of Seismology, 1985, 4th edition. Cambridge: Cambridge. |
[9, 10]
. Otherwise, it is possible that the sum of x
ij may tend to zero. It should be noted that both longitudinal and transverse waves have positive and negative initial movements, and they vary according to the orientation of the station relative to the hypocenter and different wave types. Therefore, when the focal mechanism is not known, a large-scale trial calculation is required, that is, after assigning any station as the reference, the plus and minus signs need to be calculated for the rest of the subsequent superimposed station records, and the combination of the series of values of x
ij superimposed and then squared in the equation is observed. For spatial points without microseismic, the correlation between any combination of random background records of different stations is generally low.
4.2. Necessary Conditions for the Success of the VS Applications
The necessary conditions for the success of VS ground monitoring, identifying and checking the reliability of the VS applications, are listed in
Table 4. These conditions can be incorporated into the monitoring automation process through specific application parameters
| [1] | Liang Beiyuan, Chang Li, Fang Dazhi, et al. Microseismic and its monitoring—toward vector scanning of microseismic based on lower signal to noise ratio. Progress in Geophysics. 2023, 38(1), 47-75. (In Chinese but English abstract) |
| [4] | Liang B., Guo B. Statistics in Vector Scanning for Microseismic. EAGE 5th Petroleum Geostatics, 2023, Paper number 15, Porto, Portugal. |
| [8] | Chen M., Sun L., Shi Y. et al. Statistics in Vector Scanning for Microseismic. Science Technology and Engineering. 2025. (In Chinese but English abstract) |
[1, 4, 8]
.
Table 4.
Necessary conditions for verifying the reliability of VS application| [1] | Liang Beiyuan, Chang Li, Fang Dazhi, et al. Microseismic and its monitoring—toward vector scanning of microseismic based on lower signal to noise ratio. Progress in Geophysics. 2023, 38(1), 47-75. (In Chinese but English abstract) |
| [5] | Wu Gang, Cai Jiang, Zhao Yewei, et al. Ground monitoring for fracturing microseismic of two ultra-deep wells. SEG 1st Tarim Ultra-Deep Oil & Gas Exploration Technology Workshop, 2024, 2024-UD-06X-OR-080. Korla, China. |
| [8] | Chen M., Sun L., Shi Y. et al. Statistics in Vector Scanning for Microseismic. Science Technology and Engineering. 2025. (In Chinese but English abstract) |
No. | Necessary conditions | Monitoring steps |
1 | The geophones with 3-C, lower natural frequency, and being spiraled into the ground | Data acquisition |
2 | Each station of the seismic network is at a discrete and quiet point |
3 | Number of stacking stations should be ≥statistically significant and minimum number, Nmin (~10). |
4 | Effective denoising before migration | Data processing. Denoising and migrationdetermining all of possible EP |
5 | Using P and S waves in stacking, with the latter being the most important; Shear rupture characteristics must be also considered |
6 | The lower limit of S/N (correlation coefficient, released energy) with ≥1%, is the threshold of existing microseismic |
7 | EP(t) is obtained by using characteristic parameters to remove residual interference from noise | Getting EP(t) | Inter-pretation |
8 | Accumulating all of EP(t), which defines the final SRV in a probabilistic and statistical sense | Integrating EP(t) to obtain the final SRV |
4.3. Testing the Reliability of Fracturing Microseismic Ground Monitoring
To judge the reliability of any monitoring method, one always expects to have sufficient qualitative or even quantitative requirements. However, for microseismic monitoring, it is difficult to give such sufficient conditions. As mentioned earlier, microseismic monitoring is more difficult than monitoring stealth aircraft and navigation. There is a separation of fluids over there, and it is always possible to test monitoring by setting targets and distances; And here is the solids, and it is extremely difficult to examine.
On the other hand, in addition to the above-mentioned difficulties in monitoring and processing data, microseismic monitoring such as fracturing is to invert the temporal and spatial distribution of microseismic or its released energy or SRV in the rock mass by processing the observation signals, and its corresponding correlation with the geological and physical properties of life, production and rock mass. Therefore, the "high energy" of a certain time and space may be caused by microseismic or imperceptible noise pollution from many seismic stations at the same time. Inversion results are generally not unique.
As seen for the conditions 7-8 in
Table 4, when the first six requisites are met, it is still possible to have "simultaneous noise pollution" that is difficult to detect by the automated denoising process, resulting in a "high energy distribution" over a large area or even across the monitoring domain boundary (~km)
| [8] | Chen M., Sun L., Shi Y. et al. Statistics in Vector Scanning for Microseismic. Science Technology and Engineering. 2025. (In Chinese but English abstract) |
[8]
. This forces us to carefully identify, or, take forward stacking outputs associated with this type of pollution, and confirm the corresponding denoising parameters. This added the condition 7 and affects the condition 8 of
Table 4. This allows the denoising of VS monitoring to extend to the final interpretation phase of monitoring
| [8] | Chen M., Sun L., Shi Y. et al. Statistics in Vector Scanning for Microseismic. Science Technology and Engineering. 2025. (In Chinese but English abstract) |
[8]
.
Although it is difficult to propose sufficient necessary conditions, it is possible that when there are enough necessary conditions, the success of R&D and application can be guaranteed in a sense of high probability (
Table 4). In this way, we can study and discuss the spatiotemporal distribution of the microseismic energy or SRV output at the end of VS, and define the corresponding equivalent focal mechanism.
At this time, the morphology and mechanism obtained on the basis of statistics should be consistent with the known knowledge of seismology, rock mechanics and structural geology, or supported by the mechanistic analysis of these knowledge; This is also an important aspect of reliability testing (see Chapter 5).
5. SRV, Focal Mechanism, and Effect of In-situ Pump Shutdown
We take the study of SRV, focal mechanism and in-situ pump shutdown effect as examples to illustrate the application of VS.
5.1. Definition of SRV and Its Morphological Parameter
SRV is defined as described in the necessary conditions 7 and 8 in
Table 4. When the condition 7 is completed, the E
P, or SRV, changes over time as shown in the right column of
Figure 1; The final integration of these time-varying SRVs yields the final SRV geometry, as shown in
Figure 2. People usually describe a seismic event by the coordinates (x, y, z), the start time t
0, and the magnitude M. When the S/N is low, SRV can be expressed by geometric parameters (length, width, height), important period, and equivalent microseismic magnitude, M
| [14] | Feng Yanjun, and Liang Beiyuan. A method to estimate the microseismic magnitude based on vector scanning. Progress in Earthquake Sciences. 2023, 53(3), 115-119. (In Chinese but English abstract) |
[14]
, or supplemented by the description of the relative position of the perforated section and the details of its internal energy distribution. The average equivalent microseismic M in fracturing
| [14] | Feng Yanjun, and Liang Beiyuan. A method to estimate the microseismic magnitude based on vector scanning. Progress in Earthquake Sciences. 2023, 53(3), 115-119. (In Chinese but English abstract) |
[14]
∈ [-3.1, -2.5].
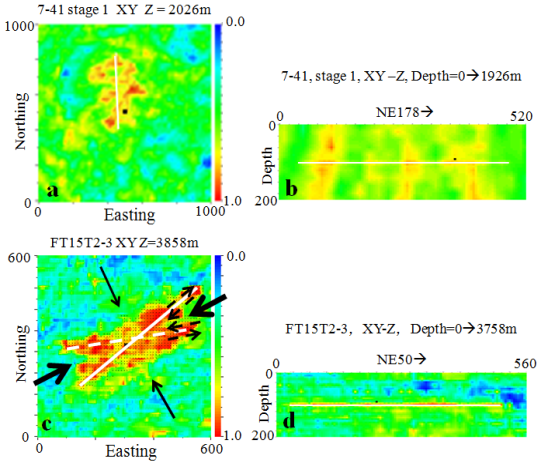
The horizontal accuracy of VS ground monitoring can be ten to tens of meters, and at the vertical shallow area, such as within a kilometer, it can be similar to that of the horizontal direction; but for deep targets, the error may be several times large
| [1] | Liang Beiyuan, Chang Li, Fang Dazhi, et al. Microseismic and its monitoring—toward vector scanning of microseismic based on lower signal to noise ratio. Progress in Geophysics. 2023, 38(1), 47-75. (In Chinese but English abstract) |
[1]
, e.g.
Figure 2b. Large vertical error is the cost of ground monitoring, like GPS location with relative accurate horizontal position but very high vertical error without appropriate constraints. It seems difficult to give an appropriate vertical height of SRV (VHSRV).
5.2. Determination of VHSRV
If we observe the vertical distribution of E
P in the microseismic monitoring of 497 stages/layers (of oil/gas, or unconventional shale/methane gas) applied by VS, as shown in
Figure 2b,d:
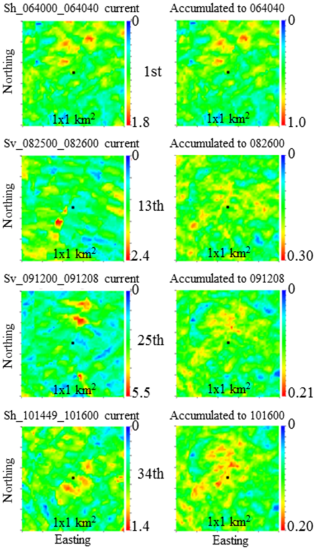
Figure 1. 2D planar energy distribution for the important periods of real-time fracturing microseismic monitoring of coalbed methane well 7-41M. This is the selection and integration after removing the suspicion of strong interference in the interpretation process, such as called the important period. A total of 34 groups (each group is ~ minute long) were found. Only groups 1, 13, 25 and 34 are shown here. There are two sub-plots in each group, where the left figure shows the planar energy distribution of the waveform in the current period with higher energy release near the perforation section or borehole (the black dot in the center of each figure, with a vertical depth of 2030m), which is expressed in the form of S/N (%); for example, the maximum value of the last group of left plot is 1.4%; The figure on the right shows the cumulative ensemble mean distribution of each point in the space after normalization (minimum and maximum values are in 0-1) for all selected important periods up to this period, which is the final SRV. Therefore, the overall maximum value of 3D space point-to-point superposition is generally unchanged or gradually decreased after the average of point-to-point stacked ensemble. In an important period, 1-2 shear wave types may be selected, i.e., Sh and Sv waves that propagate independently of each other. In the title of the graph, e.g. Sh_101449_101600, Sh represents the waveform, and 101449 (hours, minutes, seconds—hhmmss) and 101600 are the GMT for this period. The color scales are not consistent.
For each stage, using the necessary condition 7 to obtain the ten to several tens of SRV(t) (
Figure 1), and finally using the necessary condition 8 to accumulate the SRV(t), in 49% of the stages, the high-energy errors in the vertical direction of tens to 100 meters are largely canceled out through accumulation; Although it is not possible to confirm the specific value of VHSRV, the high energy is concentrated in or near the reservoir.
Even if the accumulation fails to offset the vertical error to a large extent, the high energy values in and near the reservoir are always present and representative (e.g.,
Figure 2b).
Whether or not or how much to offset the error are not necessarily related to the geometry of the seismic network and fracturing spatiotemporal factors. It is highly likely that this type of vertical error is random.
Similarly, the hypocenters in the traditional relocation of BPM in dozens of fracturing stages were counted to observe the maximum vertical distance (up and down ~100m, respectively) to the vertical center of the perforation section
| [6] | Maxwell S. Microseismic imaging of hydraulic fracturing: Improved Engineering of unconventional shale reservoirs. Distinguished instructor short course. 2014, Houston: SEG. |
[6]
. Due to the limitations of BPM (
Tables 2 and 3), the vertical error is also not small, but most of them are in, around, or near the reservoirs.
Combining the statistics of vertical events or energy distributions of BPM and VS applications, one can question or hypothesize that for the fracturing-induced microseismic in the horizontal stratification, SRV is mainly extended within the reservoir. So, if we use the relocation of BPM with good monitoring conditions in
Table 2, what is the conclusion?
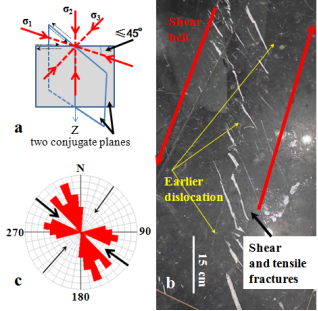
Figure 3. a: Relationship between tectonic stress field and shear-sliding rupture. Here is a tectonic strike-slip with 2 conjugate planes (2 blue boxes). It is commonly known as X-shaped structural rupture type. The red arrow pairs represent the directions of maximum, minimum, and intermediate principal compressive stress (σ1, σ3, σ2), respectively, and the 2 thin dashed arrow pairs represent the slip types of each plane. Rotating this stress field can obtain a variety of such as normal and reverse faults etc. b: a picture of real shear zone taken by VS R&D personnel in a public restroom. The region covered by red arrow pair shows the details in a shear belt. The white filling in the middle shows the tension and shear cracks. Yellow arrows indicate earlier coherent and long slip. As a result, there may be two groups of characteristic seams in the shear belt: a large number of flying geese stretch and shear seams, and longer dislocated shear seams. c: SRV strike statistics of more than 50 stages of three horizental wells at the platform Z; The coarse (fine) solid black arrows indicate the directions of σ1 (σ3).
After carefully sifting through nearly 100 reports of BPMs, 9 cases were found
| [15] | Peterson, R., S. Wolhart, and K. H. Frohne, Fracture diagnostics research at the GRI/DOE multi-site Project: Overview of the concept and results: Paper SPE 36449, Presented at the 1996 Annual Technical Conference and Exhibition. |
| [16] | Maxwell S, T. Urbancic, and S. Falls et al. Real-time microseismic mapping of hydraulic fracturing in Carthage, Texas: Abst. 70th Ann. Internat. Mtg 2000, SEG. |
| [17] | Maxwell, S. et al. Passive seismic and surface monitoring of geomechanical deformation associated with steam injection: In “Heavy Oil. Reservoir Characterization and Production Monitoring, 2010, Houston: SEG, 293-300. |
| [18] | Rutledge, J., and W. Phillips. Hydraulic stimulation of natural fractures as revealed by induced microearthquakes, Carthage Cotton Valley gas field, east Taxes. Geophysics. 2003, 68, No. 2, 441-452. |
| [19] | Belayouni N., A. Gesret, G. Daniel, and L. Nobel. Microseismic event location using the first and reflected arrivals. Geophysics, 2015, 80, No. 6, WC133-WC143. |
| [20] | Belayouni, N., D. Kats, V. Grechka, and P. Christianson, Microseismic event location using direct and reflected waves: A Woodford case study. 2017, 87th Annual International Meeting, SEG, Expanded Abstract, SGS 1. |
| [21] | Hickman, R. and J. Gallop. Microseismic monitoring during hydraulic fracture treatments complements 3D geomechanics modelling.. First Break. 2022, 40, No. 4, 49-54. |
[15-21]
, which both published the vertical distribution of hypocenters, and can be used to determine the their vertical range with relative reliability. If SRV is here defined by dense focal events, their distribution is basically consistent with the reservoir height. Therefore, for microseismic such as fracturing in stratified structures, SRV is mainly extended and concentrated in the reservoir. That is, VHSRV may be generally the reservoir height.
The main geological and rock mechanical mechanism using reservoir thickness to represent VHSRV may be:
1) the maximum principal compressive stress, σ
1 in continents is at or near the level
| [22] | Jaeger J., Cook N., and Zimmerman R. Fundamentals of rock mechanics. 2007, 4th Edition. Oxford: Blackwell Publishing Ltd. |
[22]
. So, fractures such as fracturing induced can easily propagate horizontally.
2) Structural distribution of bedding folds. Layered structures with different strengths can form thin belts of interlaminar slip fragmentation, which is the vertical buffer boundary encountered by the leading edge of the stress concentration of fracturing microseismic.
5.3. SRV Horizontal Pattern
Regardless of how SRV changes over time, the final observed horizontal morphology of SRV is the X type in "Anderson discussion"
| [22] | Jaeger J., Cook N., and Zimmerman R. Fundamentals of rock mechanics. 2007, 4th Edition. Oxford: Blackwell Publishing Ltd. |
[22]
(for example, see
Figures 2c, 3a, and 3c), or a part of the X (i.e. Y, V, I, etc.), or the internal morphology of the 2 conjugate shear zones is shown in the form of a flying geese (
Figures 2a and 3b). Frequently, these morphologies are manifested before the end of the stage fracturing.
5.4. Equivalent Focal Mechanism
The focal mechanism is the relationship between the deformation and the stress fields. Due to the characteristics of microseismic monitoring (
Table 1), the number and the arrivals of microseismics are generally unknown in a period, and it is impossible to locate an event and confirm its focal mechanism according to the initial arrivals in records as a large natural earthquake. According to the SRV morphology obtained from VS ground monitoring, we have the following relationship between the deformation and the stress fields, or the equivalent focal mechanism:
1) Statistics of SRV orientations in the range of several hundreds to kilometer (e.g.
Figure 3c) and the possible azimuth range of σ
1.
2) The X style of SRV (
Figure 2c) and σ
1 probable azimuth in a fracturing stage.
They represent the average mechanism in a certain area and time between local deformation zone and the tectonic stress field
| [23] | Wyss M., Gillard D, Liang B. An estimate of absolute stress tensor. Journal Geophysical Research, 1992, 97(B4), 4763-4768. |
[23]
.
Because VHSRV is generally much smaller than the length of SRV, the vertical detail of SRV is not clear; But based on a lot of X styles shown (e.g.
Figures 2c and 3c), we tend to the pattern: both of σ
1 and σ
3 are (near) horizental (
Figure 3a).
5.5. Effect of In-situ Pump Shutdown
During fracturing, the in-situ pump shutdown (or ≥2 times fracturing) and/or temporary plugging (referred to as "PS") is to create more fractures in the new direction (CD= Changed Direction=already≥2 directions at earlier fracturing term) and/or new places (Extended and crack density Increased, EI) on the basis of the existing SRV. "In-situ" here refers to a range within the length of the stage as tens of meters.
A qualified SRV may be: overall length ≥ 200m, equivalent width ≥ length of perforating section, and a ratio of ≥1/3 between the length or area of two wings. Of the 497 stages/layers, 34 (7%) SRVs were unsatisfactory (close to or on one side of the well trace) and 463 qualified. Almost all of these SRV have sufficient EI at any time of CD.
However, CD effect is not necessarily related to in-situ PS (
Table 5). After careful investigation, the final fracturing effect is also not necessarily related to the perforation method, reservoir type, and other spatiotemporal factors.
Why is the in-situ PS invalid? We had an example: the new 100-meter section adjacent to 300-meter old temporarily plugged fracking section, had a good effect on both the CD and EI in the fracturing. This may be the mechanism of in-situ PS ineffectiveness: because even if there is a new fracture close to old SRV, it is easy to quickly communicate with each other.
Table 5. Statistics from 463 (100%) passable SRVs for CD time in fracturing. CD=Changed Direction; PS=Pump Shutdown.
PS occupies 59%, in them | 86% CD before PS |
14% CD after PS |
No-PS occupies 41%, in them | 90% CD in the 1st half term |
10% CD in the 2nd half term |
6. Conclusions and Prospects
1) The current situation of microseismic monitoring in the world is not optimistic. The principles, data acquisition, data processing and/or interpretation of many monitoring methods are far from the requirements of microseismic monitoring characteristics, and also far from the level of analyzing specific microseismicity.
2) The main reason is still the lack of understanding of microseismic and its monitoring characteristics, so that the development and application are not based on strict seismology, geology, rock mechanics, a large number of reliable experiments and mathematical statistics. Microseismic monitoring is even more difficult than monitoring stealth aircraft and navigators, because the target and detector are separated by fluid over there.
3) We believe that the development and application of microseismic monitoring must be based on the reality of low S/N and coexist with noise. On this basis, we will develop ideas and improve detection methods.
4) In microseismic ground monitoring, VS uses the principle of seismological focal mechanism to combine all possible migrations and stacks with different ±arrivals, then to select the spatiotemporal distribution of the energy released (or the correlation coefficient of stations, or the minimum S/N) in the sense of high probability.
5) Accordingly, VS has developed 8 necessary conditions to ensure the reliability of its applications with a high probability, and has had the conditions for analyzing SRV morphology.
6) The available reservoir thickness can be used as the VHSRV; The horizontal distribution of SRV show subtle characteristics in shear belts, such as the styles of X, flying geese, or the part of them, or their combination.
7) For a certain fracturing stage or large block, the equivalent focal mechanism can be proposed, that is, the relationship between SRV morphology and tectonic stress field.
8) A qualified SRV is not necessarily related to specific in-situ fracturing measures such as in-situ pump shutdown; The reason is most likely that the new fracture is too close to the existing SRV and is easily connected with each other.
9) The necessary conditions for ground monitoring, the patterns of monitoring output, and some analyses and questions described in this paper also provide a basis for the inspection of microseismic monitoring.
10) Under the advantages of maintaining high cost-effective ratio and others, we may further improve observation accuracy (reducing the sample interval, currently 2 ms) and automated processing speed (currently with 4G network, an I4216 processor with a frequency of 2.1Hz, and a 96-thread server). After transmission and processing, it is currently delayed by ~3 minutes for report). It may require several years to use sample interval of ≤1 ms, and servers with faster and more threads.
11) VS has paved the way for cost-effective and production-accompanying ground microseismic monitoring. It is also highly likely to be integrated with BPM, a currently common method) through the following technical development routes aimed at improving monitoring quality:
A. Joint calibration of traditional location and velocity models for inversion;
B. Use of migration stacking for data processing.
These advancements will significantly expand the monitoring scope and enhance the quality of BPM, making it the best scientific method for detailed research on microseismicity, albeit at a higher cost. This will establish a solid foundation and comprehensive methodology for the development of microseismic monitoring, forming a robust microseismology.
Abbreviations
S/N | Signal-to-noise Ratio |
VS | Vector Scanning |
SRV | Stimulated Rock Volume |
BPM | Borehole Proximity Monitoring |
MHRED | Microseismic Hypocenters (or Corresponding) Released Energy Distributions |
VHSRV | Vertical Height of SRV |
σ1, σ3, σ2 | Maximum, Minimum, and Intermediate Principal Compressive Stress, Respectively |
PS | Pump Shutdown and/or Temporary Plugging |
CD | Changed Direction, or Already ≥2 Directions at Earlier Fracturing Term |
EI | Extended in the Similar Direction and/or Crack Density Increased in the Direction |
Conflicts of Interest
The authors declare no conflicts of interest.
References
| [1] |
Liang Beiyuan, Chang Li, Fang Dazhi, et al. Microseismic and its monitoring—toward vector scanning of microseismic based on lower signal to noise ratio. Progress in Geophysics. 2023, 38(1), 47-75. (In Chinese but English abstract)
|
| [2] |
Liang Beiyuan, and Wang Jianli. An enormous challenge: Understanding the microseismic features. Science Technology and Engineering. 2017, 18(13), 14-21. (In Chinese but English abstract)
|
| [3] |
Feng Y., Liang B., and Wang W. Monitoring for microseismicity induced by goaf collapse at coal mine. EAGE, Near Surface Geoscience Conference & Exhibition 2022, Geophysical Methods in Mining Engineering. Paper number 53. Belgrade, Serbia.
|
| [4] |
Liang B., Guo B. Statistics in Vector Scanning for Microseismic. EAGE 5th Petroleum Geostatics, 2023, Paper number 15, Porto, Portugal.
|
| [5] |
Wu Gang, Cai Jiang, Zhao Yewei, et al. Ground monitoring for fracturing microseismic of two ultra-deep wells. SEG 1st Tarim Ultra-Deep Oil & Gas Exploration Technology Workshop, 2024, 2024-UD-06X-OR-080. Korla, China.
|
| [6] |
Maxwell S. Microseismic imaging of hydraulic fracturing: Improved Engineering of unconventional shale reservoirs. Distinguished instructor short course. 2014, Houston: SEG.
|
| [7] |
Liang B, Zhu G. Microseismic technology in exploration and development. 2004, Beijing: Petroleum Industry Press. (In Chinese)
|
| [8] |
Chen M., Sun L., Shi Y. et al. Statistics in Vector Scanning for Microseismic. Science Technology and Engineering. 2025. (In Chinese but English abstract)
|
| [9] |
Aki K, Richards P. G. Quantitative Seismology: Theory and Methods. 1980, San Francisco: W. H. Freeman and Company.
|
| [10] |
Bullen K. E and Bolt B. An introduction to the theory of Seismology, 1985, 4th edition. Cambridge: Cambridge.
|
| [11] |
Cheng Q. Digital signal processing, 2003, Beijing: Peking University Press. (In Chinese)
|
| [12] |
Press W, Teukolsky S., Vetterling W., et al. Numerical Recipes in C, the art of scientific computing. 2ndEdition. 1997. Cambridge: Cambridge.
|
| [13] |
Robinson E. A., and Treitel S. Geophysical signal processing. 2000, Houston: SEG.
|
| [14] |
Feng Yanjun, and Liang Beiyuan. A method to estimate the microseismic magnitude based on vector scanning. Progress in Earthquake Sciences. 2023, 53(3), 115-119. (In Chinese but English abstract)
|
| [15] |
Peterson, R., S. Wolhart, and K. H. Frohne, Fracture diagnostics research at the GRI/DOE multi-site Project: Overview of the concept and results: Paper SPE 36449, Presented at the 1996 Annual Technical Conference and Exhibition.
|
| [16] |
Maxwell S, T. Urbancic, and S. Falls et al. Real-time microseismic mapping of hydraulic fracturing in Carthage, Texas: Abst. 70th Ann. Internat. Mtg 2000, SEG.
|
| [17] |
Maxwell, S. et al. Passive seismic and surface monitoring of geomechanical deformation associated with steam injection: In “Heavy Oil. Reservoir Characterization and Production Monitoring, 2010, Houston: SEG, 293-300.
|
| [18] |
Rutledge, J., and W. Phillips. Hydraulic stimulation of natural fractures as revealed by induced microearthquakes, Carthage Cotton Valley gas field, east Taxes. Geophysics. 2003, 68, No. 2, 441-452.
|
| [19] |
Belayouni N., A. Gesret, G. Daniel, and L. Nobel. Microseismic event location using the first and reflected arrivals. Geophysics, 2015, 80, No. 6, WC133-WC143.
|
| [20] |
Belayouni, N., D. Kats, V. Grechka, and P. Christianson, Microseismic event location using direct and reflected waves: A Woodford case study. 2017, 87th Annual International Meeting, SEG, Expanded Abstract, SGS 1.
|
| [21] |
Hickman, R. and J. Gallop. Microseismic monitoring during hydraulic fracture treatments complements 3D geomechanics modelling.. First Break. 2022, 40, No. 4, 49-54.
|
| [22] |
Jaeger J., Cook N., and Zimmerman R. Fundamentals of rock mechanics. 2007, 4th Edition. Oxford: Blackwell Publishing Ltd.
|
| [23] |
Wyss M., Gillard D, Liang B. An estimate of absolute stress tensor. Journal Geophysical Research, 1992, 97(B4), 4763-4768.
|
Cite This Article
-
APA Style
Beiyuan, L., Jiang, W., Yanchao, L. (2025). Ground Monitoring of Microseismic Based on Low Signal-to-Noise Ratio. American Journal of Energy Engineering, 13(3), 107-117. https://doi.org/10.11648/j.ajee.20251303.12
 Copy
|
Copy
|
 Download
ACS Style
Beiyuan, L.; Jiang, W.; Yanchao, L. Ground Monitoring of Microseismic Based on Low Signal-to-Noise Ratio. Am. J. Energy Eng. 2025, 13(3), 107-117. doi: 10.11648/j.ajee.20251303.12
Copy
|
Download
AMA Style
Beiyuan L, Jiang W, Yanchao L. Ground Monitoring of Microseismic Based on Low Signal-to-Noise Ratio. Am J Energy Eng. 2025;13(3):107-117. doi: 10.11648/j.ajee.20251303.12
Copy
|
Download
-
@article{10.11648/j.ajee.20251303.12,
  author = {Liang Beiyuan and Wei Jiang and Li Yanchao},
  title = {Ground Monitoring of Microseismic Based on Low Signal-to-Noise Ratio
},
  journal = {American Journal of Energy Engineering},
  volume = {13},
  number = {3},
  pages = {107-117},
  doi = {10.11648/j.ajee.20251303.12},
  url = {https://doi.org/10.11648/j.ajee.20251303.12},
  eprint = {https://article.sciencepublishinggroup.com/pdf/10.11648.j.ajee.20251303.12},
  abstract = {At present, the principle, data acquisition, data processing, and/or interpretation of many microseismic monitoring methods around the world are far from the requirements of microseismic monitoring characteristics, and impossible to analyze the microseismicity. The main technical reason for the situation is still the lack of understanding the characteristics of microseismic and corresponding monitoring for it, so that the monitoring R&D and application are not based on strict seismology, geology, rock mechanics, a large number of reliable experiments and mathematical statistics. We first summarize the characteristics of microseismic and monitoring for it. Based on this, as well as the basic requirements of seismometry, various monitoring methods are discussed, including their applicable conditions, limitations and development prospects. The summary and discussion show that the development and application of microseismic monitoring, even avoiding strong noise sources as much as possible during data acquisition, and effectively denoising during processing, have to face the reality of low signal-to-noise ratio (S/N): in most cases, whether the microseismic signal is implied in the background noise recording, the number of microseismics, and the initial motion form of any microseismic arrival are not known. We then report that in the past 2-3 years, our Vector Scanning (VS) for microseismic ground monitoring has been greatly improved, including: an in-depth understanding of the available principles, the refinement of the conditions necessary for the success of the application with a high probability, and the quantitative integration of automated data processing and interpretation; Among them, the most important is an in-depth understanding of the existing principles: VS uses the focal mechanism (i.e., the relationship between the strain and the stress fields) to implement large-scale migration and stacking, carry out various possible combinations of positive and negative initial movements for all seismic stations, and select the spatiotemporal distribution with high probability of the greater microseismic released energy (i.e., the correlation coefficient recorded of stations, also the minimum S/N). A large number of cases are available for mathematical statistics, which provide a basis for analyzing the details of microseismicity. Finally, we describe the specific morphology of the stimulated rock volume in stimulation, the equivalent microseismic focal mechanism, and the effect of production measures such as in-situ pump shutdown. The necessary conditions, monitoring output patterns and analyses described in the paper also provide a basis for the test of the microseismic methods.},
 year = {2025}
}
Copy
|
Download
-
TY  - JOUR
T1  - Ground Monitoring of Microseismic Based on Low Signal-to-Noise Ratio

AU  - Liang Beiyuan
AU  - Wei Jiang
AU  - Li Yanchao
Y1  - 2025/07/23
PY  - 2025
N1  - https://doi.org/10.11648/j.ajee.20251303.12
DO  - 10.11648/j.ajee.20251303.12
T2  - American Journal of Energy Engineering
JF  - American Journal of Energy Engineering
JO  - American Journal of Energy Engineering
SP  - 107
EP  - 117
PB  - Science Publishing Group
SN  - 2329-163X
UR  - https://doi.org/10.11648/j.ajee.20251303.12
AB  - At present, the principle, data acquisition, data processing, and/or interpretation of many microseismic monitoring methods around the world are far from the requirements of microseismic monitoring characteristics, and impossible to analyze the microseismicity. The main technical reason for the situation is still the lack of understanding the characteristics of microseismic and corresponding monitoring for it, so that the monitoring R&D and application are not based on strict seismology, geology, rock mechanics, a large number of reliable experiments and mathematical statistics. We first summarize the characteristics of microseismic and monitoring for it. Based on this, as well as the basic requirements of seismometry, various monitoring methods are discussed, including their applicable conditions, limitations and development prospects. The summary and discussion show that the development and application of microseismic monitoring, even avoiding strong noise sources as much as possible during data acquisition, and effectively denoising during processing, have to face the reality of low signal-to-noise ratio (S/N): in most cases, whether the microseismic signal is implied in the background noise recording, the number of microseismics, and the initial motion form of any microseismic arrival are not known. We then report that in the past 2-3 years, our Vector Scanning (VS) for microseismic ground monitoring has been greatly improved, including: an in-depth understanding of the available principles, the refinement of the conditions necessary for the success of the application with a high probability, and the quantitative integration of automated data processing and interpretation; Among them, the most important is an in-depth understanding of the existing principles: VS uses the focal mechanism (i.e., the relationship between the strain and the stress fields) to implement large-scale migration and stacking, carry out various possible combinations of positive and negative initial movements for all seismic stations, and select the spatiotemporal distribution with high probability of the greater microseismic released energy (i.e., the correlation coefficient recorded of stations, also the minimum S/N). A large number of cases are available for mathematical statistics, which provide a basis for analyzing the details of microseismicity. Finally, we describe the specific morphology of the stimulated rock volume in stimulation, the equivalent microseismic focal mechanism, and the effect of production measures such as in-situ pump shutdown. The necessary conditions, monitoring output patterns and analyses described in the paper also provide a basis for the test of the microseismic methods.
VL  - 13
IS  - 3
ER  -
Copy
|
Download