Noise pollution is one of the more prevalent types of pollution caused mainly by urbanization. It is characterized as noise propagating throughout a living being in a way that is to its physical and mental health. Along with the growth of the city, trade, business, shopping, education, and other activities have been accelerating. The main purpose of the study was to address the dangerous point of noise pollution in Dinajpur municipality and identify the causes of noise pollution. For this study, data sets on the amount of noise pollution at 35 different places throughout Dinajpur city have been analyzed. Three shifts of data collection were conducted: morning (8 am to 10 am), afternoon (12 pm to 2 pm) and evening (4.00 pm-6.00 pm). Using the ArcGIS 10.8 program, descriptive statistics tools and analysis of variance were carried out. The highest average noise level (105.7 dB) was found at Central Bus Terminal at the time of evening which is a mixed zone. The lowest average noise level (64 dB) was found at Chotogurgola and Balubari at the time of morning and evening respectively which is residential zone. The noise levels throughout the city vastly exceed both the WHO and DoE recommendations. The main causes of noise pollution are the expanding urban area, unregulated auto rice mills establishment, the heavy use of construction equipment, automobile engines, uncontrolled horns, and outrageous auto rickshaws etc. It is vital to take action to lower noise levels because prolonged exposure to noise has numerous negative effects. The development of comprehensive land use plans for this city would benefit from taking noise pollution into consideration.
| Published in | American Journal of Environmental Protection (Volume 13, Issue 2) |
| DOI | 10.11648/j.ajep.20241302.12 |
| Page(s) | 40-48 |
| Creative Commons |
This is an Open Access article, distributed under the terms of the Creative Commons Attribution 4.0 International License (http://creativecommons.org/licenses/by/4.0/), which permits unrestricted use, distribution and reproduction in any medium or format, provided the original work is properly cited. |
| Copyright |
Copyright © The Author(s), 2024. Published by Science Publishing Group |
Noise Pollution, Public Transportation, Noise Mapping, Health Impact
2.1. Study Area
2.2. Data Analysis
Land Use Category | ID | Location | Morning | Noon | Evening |
|---|---|---|---|---|---|
1 | Balubari (BB) | 72.6 | 71 | 64 | |
2 | Aloha Zone (AZ) | 68.9 | 81 | 69 | |
Residential | 3 | Chotogurgula (CG) | 64 | 76 | 71 |
4 | Baluadanga (BD) | 71.8 | 69 | 76 | |
5 | Fakirpara (FP) | 75 | 78.1 | 74 | |
6 | Modern Moor (MM) | 97 | 99 | 95.6 | |
7 | Jail Moor (JM) | 96.5 | 95 | 95 | |
8 | Lily Moor (LM) | 97 | 100 | 105 | |
Commercial | 9 | Chaurongi Moor (CM) | 84 | 101.2 | 100.5 |
10 | Nimtola Moor (NM) | 99 | 96.5 | 105 | |
11 | Moharaja Moor (MH) | 86.2 | 86 | 103.1 | |
12 | Shuihari (S) | 81 | 86 | 84 | |
13 | Infornt of Diabetic Hospital (IDH) | 89.2 | 82.2 | 83 | |
14 | North Balubari Govt. School (NBS) | 78.7 | 98 | 91.2 | |
15 | Labaid Diagnostic Center (LDB) | 95 | 90.1 | 101.5 | |
Sensitive | 16 | Sadar Hospital (SH) | 98.8 | 100.2 | 102 |
17 | Poly Technical College (ITC) | 86.5 | 100.2 | 99.3 | |
18 | M Abdur Rahim Medical College Hospital (ARMCH) | 97.4 | 91 | 91 | |
19 | Ikbal School Moor (ES) | 89 | 86.5 | 99 | |
20 | Infront Dinajpur Govt. College (IDGC) | 100.7 | 100.5 | 94.3 | |
21 | Infront of Patoary Autorice Mill (PA) | 83 | 88.5 | 100 | |
22 | Awliapur (AP) | 86.2 | 86 | 81 | |
23 | Infront of Zia Auto Rice Mill (ZA) | 82.4 | 99.4 | 103 | |
Industrial | 24 | Infornt of Raj Auto Rice Mill (RA) | 76 | 75.6 | 76.1 |
25 | Infront of PR Auto Rice Mill (PR) | 76.9 | 77.2 | 78 | |
26 | Infront of Meherunnesa Auto Rice Mill (MA) | 82 | 76 | 77 | |
27 | Infront of Rupali Auto Rice Mill (IRA) | 80 | 79.6 | 78.9 | |
28 | Horishovar Moor (HM) | 85 | 102 | 87.9 | |
29 | kalitola Thanar Moor (KTM) | 96.7 | 97 | 98.1 | |
30 | Charubabur Moor (CM) | 98.5 | 101 | 97 | |
Mixed | 31 | Staion Road (SR) | 87.2 | 97 | 97 |
32 | Pulhat Moor (PM) | 98.1 | 100 | 101 | |
33 | Chirirbondor Bus Stand (CBS) | 103 | 101.8 | 102.6 | |
34 | Central Bus Terminal (CBT) | 105.3 | 103 | 105.7 | |
35 | Kanchon Bridge Moor (KBM) | 96.3 | 89.5 | 92.5 |
Abatement procedures | Reduction in noise, dB | Cost-effectiveness score (1-5)* |
|---|---|---|
Noise barriers | 3-20 | 2 |
Brake Blocks for trains | 8-10 | 4 |
Building insulation | 5-10 | 1 |
Building design | 2-15 | 3 |
Changing driving styles | 5-7 | 3 |
Quiet road surfaces | 3-7 | 5 |
Low-noise tires | 34 | 3 |
Land use planning and design | Unknown | 4 |
Electric cars | 1 | 1 |
Traffic management | 3 | 3 |
| [1] | Adetoun, M. B., Blangiardo, M., Briggs, D. J., Hansell, A. L. (2011): Traffic air pollution and other risk factors for respiratory illness in schoolchildren in the Niger-delta region of Nigeria. Environ. Health Perspect. 119(10): 1478–1482. |
| [2] | Al-Mutairi, N. Z., Al-Attar, M. A., Al-Rukaibi, F. S. (2011): Traffic-generated noise pollution: Exposure of road users and populations in Metropolitan Kuwait. Environmental Monitoring and Assessment, 183(1–4), 65–75. |
| [3] | Babisch, W. (2003): Stress hormones in the research on cardiovascular effects of noise. Noise Health, 5: 1–11. |
| [4] |
CDC (2023): Too Loud! For Too Long!,
https://www.cdc.gov/vitalsigns/hearingloss/index.html Accessed on February 3, 2023 |
| [5] | Chew, Y. R. and Wu, B. S. (2016): A soundscape approach to analyse traffic noise in the city of Taipei, Taiwan. Computers, Environment and Urban Systems, 59, 78-85. |
| [6] |
Ebare, M. N., Omuemu, V. O., Isah, E. C. (2011): Assessment of noise levels generated by music shops in an urban city in Nigeria. Public Health, 125(9): 660–664.
https://doi.org/10.1016/j.puhe.2011.06.009 PMid: 21875726. |
| [7] | Government of Bangladesh (2023): Dinajpur municipality, http://www.dinajpurmunicipality.org/ Accessed on February 2, 2023. |
| [8] | Ibili, F., Owolabi, A. O., Ackaah, W., and Massaquoi, A. B. (2022): Statistical modelling for urban roads traffic noise levels. Scientific African, 15. |
| [9] | Kloth, M., Vancluysen, K., Clement, F., & Lars Ellebjerg, P. (2008): Practitioner Handbook for Local Noise Action Plans: Recommendations from the SILENCE project. |
| [10] | Kropp, W., Kihlman, T., Forssen, J., Ivarsson, L. (2007): Reduction Potential of Road Traffic Noise. Alfa Print, Stockholm. |
| [11] | Münzel, T., Schmidt, F. P., Steven, S., Herzog, M. J., Daiber, M. A., Sørensen, M., (2018): Environmental Noise and the Cardiovascular System. Journal of the American College of Cardiology, 71(6). |
| [12] | Murphy, E., and King, E. (2014): An assessment of residential exposure to environmental noise at a shipping port. Environ Int. Feb 1; 63: 207–15. |
| [13] | Murphy, E., and King, E., (2014): Environmental noise pollution: noise mapping, public health and policy. Burlington and San Diego: Elsevier. |
| [14] | Murphy, E., Faulkner, J., Douglas, O., (2020): Current State-of-the-Art and New Directions in Strategic Environmental Noise Mapping. Current Pollution Reports 6: 54–64, |
| [15] | Nipa, N., Seddique, A. A., Hossain, M., Al-amin, (2022): GIS Based Mapping and Assessment of Noise Pollution in Gazipur City, Bangladesh. Australian Journal of Engineering and Innovative Technology, 4. 121-129. |
| [16] | Noise abatement approaches (2017): Future Brief 17. Produced for the European Commission DG Environment by the Science Communication Unit, UWE, Bristol. Science for Environment Policy: 1–28. |
| [17] |
Noise pollution, National Geography, (2022):
https://education.nationalgeographic.org/resource/noise-pollution Accessed on February 1, 2022. |
| [18] | Ntui AI. (2009): Noise sources and levels at the University of Calabar Library, Calabar, Nigeria. Afr J Libr Arch Info Sci; 19(1): 53–63. |
| [19] |
OSHA (2023): Occupational Noise Exposure,
https://www.osha.gov/noise/health-effects Accessed on February 3, 2023. |
| [20] | Pahari, S., Chatterjee, N. D., Barman, N. k. (2023): GIS-Based Assessment of Noise Pollution: A Study of Jamshedpur City, India. Research Square, |
| [21] | Shendell, D. G., Ana GREE, Brown, G. E., Sridhar, M. K. C. (2009): Assessment of noise and associated health impacts at selected secondary schools in Ibadan, Nigeria. J Environ Public Health Open, Article number 739502. |
| [22] | Sherwood, A., Hinderliter, A. L., Watkins, L. L., Waugh, R. A., Blumenthal, J. A. (2005): Impaired endothelial function in coronary heart disease patients with depressive symptomatology. J Am Coll Cardiol 46: 656–9. |
| [23] | SMILE (2003): Guidelines for road traffic noise abatement, The SMILE Consortium. |
| [24] | Vladimir, M., Madalina, C. (2019): Optimizing urban landscapes in regard to noise pollution. Procedia Manufacturing, 32, 161–166. |
APA Style
Basak, S. B., Nipa, N., Tuhin, T. R., Uddin, M. J. (2024). Noise Pollution Assessment, Spatial Noise Mapping and Associated Health Impacts in Dinajpur City, Bangladesh. American Journal of Environmental Protection, 13(2), 40-48. https://doi.org/10.11648/j.ajep.20241302.12
ACS Style
Basak, S. B.; Nipa, N.; Tuhin, T. R.; Uddin, M. J. Noise Pollution Assessment, Spatial Noise Mapping and Associated Health Impacts in Dinajpur City, Bangladesh. Am. J. Environ. Prot. 2024, 13(2), 40-48. doi: 10.11648/j.ajep.20241302.12
AMA Style
Basak SB, Nipa N, Tuhin TR, Uddin MJ. Noise Pollution Assessment, Spatial Noise Mapping and Associated Health Impacts in Dinajpur City, Bangladesh. Am J Environ Prot. 2024;13(2):40-48. doi: 10.11648/j.ajep.20241302.12
@article{10.11648/j.ajep.20241302.12,
  author = {Shree Bipulendu Basak and Nazmunnaher Nipa and Touhidur Rahman Tuhin and Mohammad Jawad Uddin},
  title = {Noise Pollution Assessment, Spatial Noise Mapping and Associated Health Impacts in Dinajpur City, Bangladesh
},
  journal = {American Journal of Environmental Protection},
  volume = {13},
  number = {2},
  pages = {40-48},
  doi = {10.11648/j.ajep.20241302.12},
  url = {https://doi.org/10.11648/j.ajep.20241302.12},
  eprint = {https://article.sciencepublishinggroup.com/pdf/10.11648.j.ajep.20241302.12},
  abstract = {Noise pollution is one of the more prevalent types of pollution caused mainly by urbanization. It is characterized as noise propagating throughout a living being in a way that is to its physical and mental health. Along with the growth of the city, trade, business, shopping, education, and other activities have been accelerating. The main purpose of the study was to address the dangerous point of noise pollution in Dinajpur municipality and identify the causes of noise pollution. For this study, data sets on the amount of noise pollution at 35 different places throughout Dinajpur city have been analyzed. Three shifts of data collection were conducted: morning (8 am to 10 am), afternoon (12 pm to 2 pm) and evening (4.00 pm-6.00 pm). Using the ArcGIS 10.8 program, descriptive statistics tools and analysis of variance were carried out. The highest average noise level (105.7 dB) was found at Central Bus Terminal at the time of evening which is a mixed zone. The lowest average noise level (64 dB) was found at Chotogurgola and Balubari at the time of morning and evening respectively which is residential zone. The noise levels throughout the city vastly exceed both the WHO and DoE recommendations. The main causes of noise pollution are the expanding urban area, unregulated auto rice mills establishment, the heavy use of construction equipment, automobile engines, uncontrolled horns, and outrageous auto rickshaws etc. It is vital to take action to lower noise levels because prolonged exposure to noise has numerous negative effects. The development of comprehensive land use plans for this city would benefit from taking noise pollution into consideration.
},
 year = {2024}
}
TY  - JOUR
T1  - Noise Pollution Assessment, Spatial Noise Mapping and Associated Health Impacts in Dinajpur City, Bangladesh

AU  - Shree Bipulendu Basak
AU  - Nazmunnaher Nipa
AU  - Touhidur Rahman Tuhin
AU  - Mohammad Jawad Uddin
Y1  - 2024/05/17
PY  - 2024
N1  - https://doi.org/10.11648/j.ajep.20241302.12
DO  - 10.11648/j.ajep.20241302.12
T2  - American Journal of Environmental Protection
JF  - American Journal of Environmental Protection
JO  - American Journal of Environmental Protection
SP  - 40
EP  - 48
PB  - Science Publishing Group
SN  - 2328-5699
UR  - https://doi.org/10.11648/j.ajep.20241302.12
AB  - Noise pollution is one of the more prevalent types of pollution caused mainly by urbanization. It is characterized as noise propagating throughout a living being in a way that is to its physical and mental health. Along with the growth of the city, trade, business, shopping, education, and other activities have been accelerating. The main purpose of the study was to address the dangerous point of noise pollution in Dinajpur municipality and identify the causes of noise pollution. For this study, data sets on the amount of noise pollution at 35 different places throughout Dinajpur city have been analyzed. Three shifts of data collection were conducted: morning (8 am to 10 am), afternoon (12 pm to 2 pm) and evening (4.00 pm-6.00 pm). Using the ArcGIS 10.8 program, descriptive statistics tools and analysis of variance were carried out. The highest average noise level (105.7 dB) was found at Central Bus Terminal at the time of evening which is a mixed zone. The lowest average noise level (64 dB) was found at Chotogurgola and Balubari at the time of morning and evening respectively which is residential zone. The noise levels throughout the city vastly exceed both the WHO and DoE recommendations. The main causes of noise pollution are the expanding urban area, unregulated auto rice mills establishment, the heavy use of construction equipment, automobile engines, uncontrolled horns, and outrageous auto rickshaws etc. It is vital to take action to lower noise levels because prolonged exposure to noise has numerous negative effects. The development of comprehensive land use plans for this city would benefit from taking noise pollution into consideration.

VL  - 13
IS  - 2
ER  -
Department of Environmental Science and Engineering, Jatiya Kabi Kazi Nazrul Islam University, Mymensingh, Bangladesh
Department of Environmental Science and Engineering, Jatiya Kabi Kazi Nazrul Islam University, Mymensingh, Bangladesh
Department of Environmental Science and Engineering, Jatiya Kabi Kazi Nazrul Islam University, Mymensingh, Bangladesh
Department of Environmental Science and Engineering, Jatiya Kabi Kazi Nazrul Islam University, Mymensingh, Bangladesh
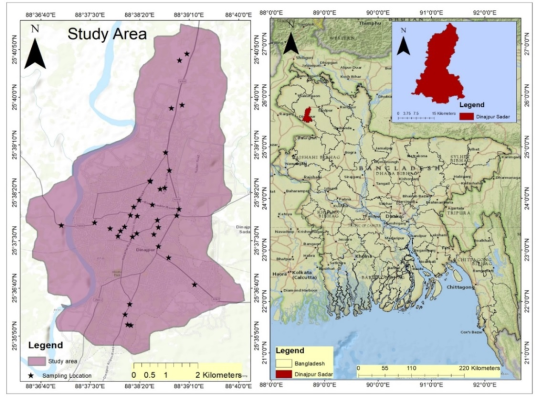
Figure 1. Study area of noise measurement location in Dinajpur municipality.
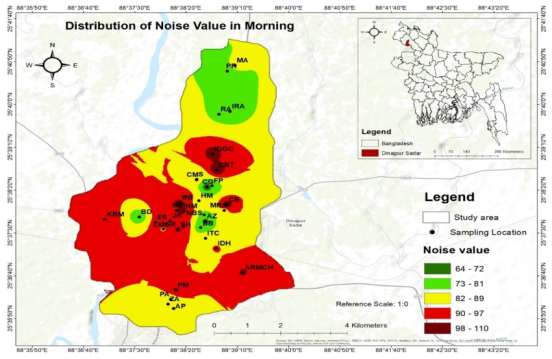
Figure 2. Spatial analysis of noise value in the morning of Dinajpur Municipality.
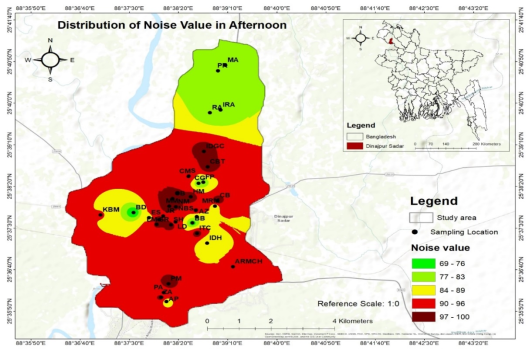
Figure 3. Spatial analysis of noise value in the afternoon of Dinajpur Municipality.
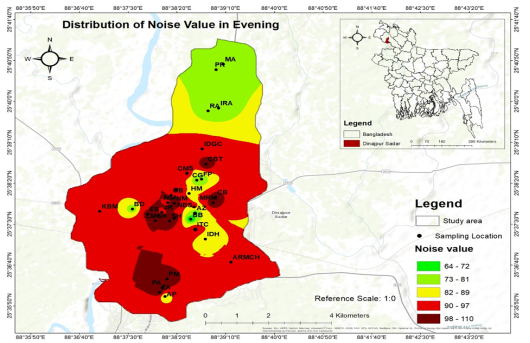
Figure 4. Spatial analysis of noise value in the evening of Dinajpur Municipality.
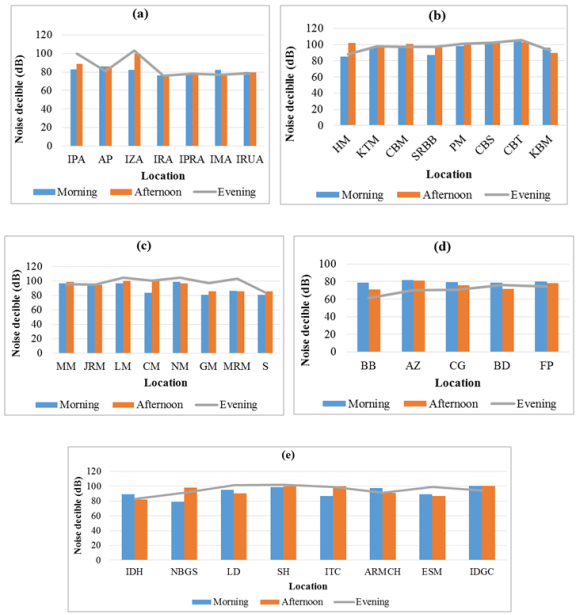
Figure 5. Variation of noise value among different zones within three different time scale; (a) Industrial zones, (b) Mixed zones, (c) commercial zones, (d) Residential zones (e) Sensitive zones.
Information

