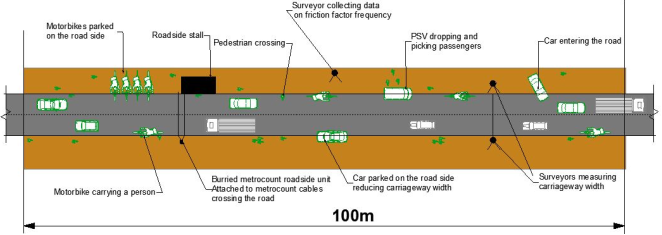
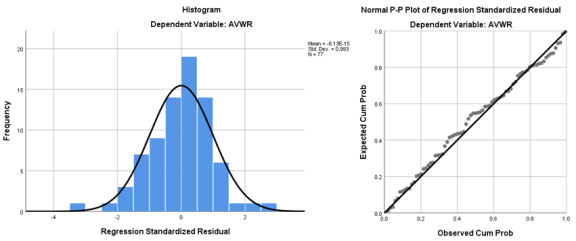
This study investigated the impact of side friction factors on the reduction of effective carriageway width in urban road links in Nakuru Town, Kenya. Linear regression models were developed for each road link, revealing a strong positive relationship between the frequency of side friction factors and the average carriageway width reduction (AVWR). The prediction models highlighted the varying influence of specific side friction factors, such as pedestrians, entry and exit maneuvers, parked vehicles, motorbikes, and bicycles, on AVWR across different road segments. The findings emphasize the importance of context-specific analysis and tailored interventions to effectively address traffic congestion in urban areas, as the complex interplay of side friction factors necessitates comprehensive approaches to traffic management. Regression analyses were conducted on data from 11 major arterial roads, considering factors like pedestrian activity, entry/exit maneuvers, parking situations, and presence of motorbikes, bicycles, and tuk-tuks. Results showed significant positive correlations for most links, with pedestrians, entry/exit maneuvers, and parked vehicles consistently contributing to carriageway width reduction. However, the impact of motorbikes and bicycles varied across locations, underlining the need for location-specific strategies. The study also revealed the intricate interplay among side friction factors, necessitating a holistic approach to traffic management. By understanding these relationships, urban planners and traffic managers can develop targeted strategies to mitigate the impact of side friction factors, improve traffic flow, and enhance overall road network efficiency.
| Published in | American Journal of Engineering and Technology Management (Volume 9, Issue 3) |
| DOI | 10.11648/j.ajetm.20240903.12 |
| Page(s) | 56-65 |
| Creative Commons |
This is an Open Access article, distributed under the terms of the Creative Commons Attribution 4.0 International License (http://creativecommons.org/licenses/by/4.0/), which permits unrestricted use, distribution and reproduction in any medium or format, provided the original work is properly cited. |
| Copyright |
Copyright © The Author(s), 2024. Published by Science Publishing Group |
Side Friction, Carriageway Width, Traffic Congestion
Parked Vehicle Per Km | 3 | 6 | 31 | 63 | 125 | 312 |
|---|---|---|---|---|---|---|
Effective loss of carriageway (m) | 0.9 | 1.2 | 2.1 | 2.55 | 3.0 | 3.6 |
Loss of capacity at 25 km/h | 200 | 275 | 475 | 575 | 675 | 800 |
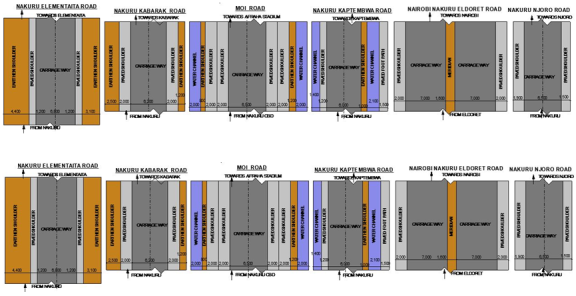
Link | Length (Km) | No. of travel lanes | Functionality class |
|---|---|---|---|
Nairobi - Nakuru - Eldoret Highway | 15.2 | 4lane-2way | A8 |
Nakuru - Nyahururu Road | 7.2 | 2lane-2way | B21 |
Nakuru - Kabarak Road | 8.9 | 2lane-2way | B17 |
Nakuru - Elementaita Road | 5.7 | 2lane-2way | D1264 |
Oginga Odinga Road | 11.6 | 2lane-2way | J2 |
Moi Road | 3.0 | 2lane-2way | D1265 |
Nakuru - Njoro Road | 5.6 | 2lane-2way | B18 |
Nakuru - Bangladesh Road | 3.9 | 2lane-2way | J4 |
Lanet - Ndundori Road | 6.9 | 2lane-2way | B20 |
Kaptembwa – Nakuru Road | 2.95 | 2lane-2way | J5 |
Nakuru PGH Road | 2.05 | 2lane-2way | K3 |
Model | R | R Square | Adjusted R Square | Std. Error of the Estimate | Durbin-Watson |
|---|---|---|---|---|---|
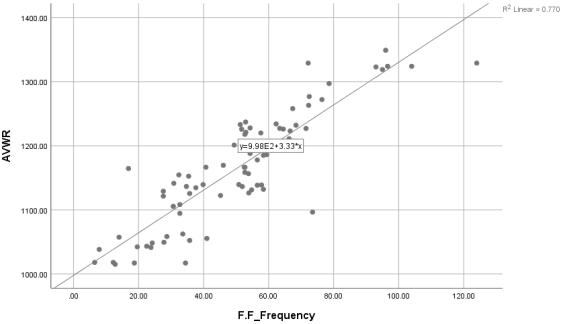
1 | .878a | .770 | .767 | 42.61545 | 1.545 |
Model | Sum of Squares | df | Mean Square | F | Sig. | |
|---|---|---|---|---|---|---|
1 | Regression | 456736.044 | 1 | 456736.044 | 251.496 | .000b |
Residual | 136205.726 | 75 | 1816.076 | |||
Total | 592941.770 | 76 | ||||
ROAD LINK | Regression weights |
| P-value | Hypothesis Supported | |
|---|---|---|---|---|---|
Oginga Odinga | FFF-AVWR | .27 | .000 | Supported | AVWR=0.37FFF+1135 |
Moi | FFF-AVWR | .008 | .099 | Not Supported | AVWR=-3.52FFF+1328.617 |
Kaptembwa | FFF-AVWR | .295 | .021 | Supported | AVWR=1.595FFF+1122.521 |
Kabarak | FFF-AVWR | .487 | .028 | Supported | AVWR=1.232FFF+1040.24 |
Nyahururu | FFF-AVWR | .770 | .000 | Supported | AVWR=1.539FFF+1117.066 |
Njoro | FFF-AVWR | .509 | .072 | Supported | AVWR=2.363FFF+992.998 |
Bangladesh | FFF-AVWR | .212 | .304 | Supported | AVWR=2.849FFF+1045.737 |
Elementaita | FFF-AVWR | .333 | .175 | Supported | AVWR=1.568FFF+1016.17 |
NKRELD | FFF-AVWR | .18 | .000 | Supported | AVWR=0.574FFF+1161.111 |
PGH | FFF-AVWR | .146 | .017 | Supported | AVWR=0.963FFF+1143.601 |
Lanet Ndundori | FFF-AVWR | .667 | .025 | Supported | AVWR=3.123FFF+1034.845 |
Road Link | AVWR Prediction model |
|---|---|
O. Odinga | AVWR=976.457+0.541(PED)+1.26(ENX)+0.699(TUK)+0.193(BIC)+0.485 (MOT)+1.77(PAR) |
Moi | AVWR=868.684+0.810(PED)+1.449(ENX)+0.567(TUK)+0.314(BIC)+0.072 (MOT)+0.614(PAR) |
Kaptembwa | AVWR=951.885+0.597(PED)+0.813(ENX)+0.256(TUK)+1.192(BIC)+0.295 (MOT)+0.322 (PSV)+0.508(PAR) |
Kabarak | AVWR=942.977+0.013(PED)+0.626(ENX)+0.574(TUK)+0.425(BIC)+1.261 (MOT)+0.371 (PSV)+0.57(PAR) |
Nyahururu | AVWR=885.476+0.532(PED)+1.125(ENX)+0.371(TUK)+0.524(BIC)+0.078 (MOT)+0.524 (PSV)+0.146(PAR) |
Njoro | AVWR=923.832+0.237(PED)+0.854(ENX)+0.367(TUK)+0.619(BIC)+0.072 (MOT)+1.071 (PSV)+0.521(PAR) |
Bangladesh | AVWR=958.251+1.972(PED)+0.852(ENX)+0.983(TUK)+0.714(BIC)+1.36 (MOT)++0.579(PAR) |
Elementaita | AVWR=859.429+0.731(PED)+1.876(ENX)+0.271(TUK)+0.642(BIC)+0.821 (MOT)+0.634 (PSV)+0.574(PAR) |
NKRELD | AVWR=837.421+0.852(PED)+1.327(ENX)+0.631(TUK)+0.542(BIC)+0.371 (MOT)+1.091 (PSV) |
PGH | AVWR=907.324+0.763(PED)+0.814(ENX)+0.532(TUK)+0.171(BIC)+0.253 (MOT)+0.429 (PSV)+0.638(PAR) |
Ndundori | AVWR=998.853+0.42(PED)+1.677(ENX)+0.993(TUK)+0.619(BIC)+1.627 (MOT)+0.814(PAR) |
AVWR | Average Carriageway Width Reduction |
BIC | Bicycles |
CBD | Central Business District |
ENX | Entry and Exit maneuvers |
MOT | Motorbikes |
PAR | Parked Vehicles |
PED | Pedestrians |
PGH | Provincial General Hospital |
PSV | Public Service Vehicles |
SFF | Side Friction Factors |
SFFF | Side Friction Factor Frequency |
SPSS | Statistical Package for the Social Sciences (likely) |
TUK | Tuk-Tuks |
| [1] | Bhat, M. A., Bali, E. S., & Lohani, T. K. (2019). Impact of road side frictional elements on average travel speed and level of service for an urban two-lane street. International Journal for Technological Research in Engineering, 6(7), 1–5. |
| [2] | Chand, S., Chandra, S., & Dhamaniya, A. (2014). Capacity drop of urban arterial due to a curb side bus stop. In Proceedings of the International Conference on Sustainable Civil Infrastructure. ASCE India Section. |
| [3] | Chiguma, M. L. M. (2007). Analysis of side friction impacts on urban road links: Case study Dar-es-Salaam [Master’s thesis, Royal Institute of Technology]. Stockholm, Sweden. |
| [4] | Directorate General of Highways, Republic of Indonesia. (1997). Indonesian Highway Capacity Manual. |
| [5] | Gulivindala, P., & Mehar, A. (2018). Analysis of side friction on urban arterials. Transport and Telecommunication, 19(1), 21–30. |
| [6] | Islam, M., Al Razib, S., Hasan, M., Ali, S., Monir, O., & Hasan, M. (2018). Cause of reduction of effective roadway width due to side friction in Dhaka City. American Journal of Traffic and Transportation Engineering, 3(1), 6–17. |
| [7] | Munawar, A. (2011). Speed and capacity for urban roads: Indonesian experience. Procedia - Social and Behavioral Sciences, 16, 382–387. |
| [8] | Murray, C. J. L., & Lopez, A. D. (1996). The global burden of disease: A comprehensive assessment of mortality and disability from diseases, injuries and risk factors in 1990 and projected to 2020. Harvard School of Public Health. |
| [9] | Pal, S., & Roy, S. K. (2016). Impact of roadside friction on travel speed and LOS on rural highways in India. |
| [10] | Pallavi, G., & Apran, M. (2018). Analysis of side friction on urban arterials. Transport and Telecommunication, 19(1), 21–30. |
| [11] | Richard, R., & Bent, T. (2004). Road engineering for development (2nd ed.). |
| [12] | WHO. (1999). World health report: Making a difference. World Health Organization. |
APA Style
Lekariap, E. M., Abiero-Gariy, Z. C., Nyomboi, T. (2024). Influence of Side Friction on Average Width Loss in Urban Roads Links; A Case Study of Nakuru Town. American Journal of Engineering and Technology Management, 9(3), 56-65. https://doi.org/10.11648/j.ajetm.20240903.12
ACS Style
Lekariap, E. M.; Abiero-Gariy, Z. C.; Nyomboi, T. Influence of Side Friction on Average Width Loss in Urban Roads Links; A Case Study of Nakuru Town. Am. J. Eng. Technol. Manag. 2024, 9(3), 56-65. doi: 10.11648/j.ajetm.20240903.12
AMA Style
Lekariap EM, Abiero-Gariy ZC, Nyomboi T. Influence of Side Friction on Average Width Loss in Urban Roads Links; A Case Study of Nakuru Town. Am J Eng Technol Manag. 2024;9(3):56-65. doi: 10.11648/j.ajetm.20240903.12
@article{10.11648/j.ajetm.20240903.12,
  author = {Edwin Mararo Lekariap and Zachary C. Abiero-Gariy and Timothy Nyomboi},
  title = {Influence of Side Friction on Average Width Loss in Urban Roads Links; A Case Study of Nakuru Town
},
  journal = {American Journal of Engineering and Technology Management},
  volume = {9},
  number = {3},
  pages = {56-65},
  doi = {10.11648/j.ajetm.20240903.12},
  url = {https://doi.org/10.11648/j.ajetm.20240903.12},
  eprint = {https://article.sciencepublishinggroup.com/pdf/10.11648.j.ajetm.20240903.12},
  abstract = {This study investigated the impact of side friction factors on the reduction of effective carriageway width in urban road links in Nakuru Town, Kenya. Linear regression models were developed for each road link, revealing a strong positive relationship between the frequency of side friction factors and the average carriageway width reduction (AVWR). The prediction models highlighted the varying influence of specific side friction factors, such as pedestrians, entry and exit maneuvers, parked vehicles, motorbikes, and bicycles, on AVWR across different road segments. The findings emphasize the importance of context-specific analysis and tailored interventions to effectively address traffic congestion in urban areas, as the complex interplay of side friction factors necessitates comprehensive approaches to traffic management. Regression analyses were conducted on data from 11 major arterial roads, considering factors like pedestrian activity, entry/exit maneuvers, parking situations, and presence of motorbikes, bicycles, and tuk-tuks. Results showed significant positive correlations for most links, with pedestrians, entry/exit maneuvers, and parked vehicles consistently contributing to carriageway width reduction. However, the impact of motorbikes and bicycles varied across locations, underlining the need for location-specific strategies. The study also revealed the intricate interplay among side friction factors, necessitating a holistic approach to traffic management. By understanding these relationships, urban planners and traffic managers can develop targeted strategies to mitigate the impact of side friction factors, improve traffic flow, and enhance overall road network efficiency.
},
 year = {2024}
}
TY  - JOUR
T1  - Influence of Side Friction on Average Width Loss in Urban Roads Links; A Case Study of Nakuru Town

AU  - Edwin Mararo Lekariap
AU  - Zachary C. Abiero-Gariy
AU  - Timothy Nyomboi
Y1  - 2024/09/26
PY  - 2024
N1  - https://doi.org/10.11648/j.ajetm.20240903.12
DO  - 10.11648/j.ajetm.20240903.12
T2  - American Journal of Engineering and Technology Management
JF  - American Journal of Engineering and Technology Management
JO  - American Journal of Engineering and Technology Management
SP  - 56
EP  - 65
PB  - Science Publishing Group
SN  - 2575-1441
UR  - https://doi.org/10.11648/j.ajetm.20240903.12
AB  - This study investigated the impact of side friction factors on the reduction of effective carriageway width in urban road links in Nakuru Town, Kenya. Linear regression models were developed for each road link, revealing a strong positive relationship between the frequency of side friction factors and the average carriageway width reduction (AVWR). The prediction models highlighted the varying influence of specific side friction factors, such as pedestrians, entry and exit maneuvers, parked vehicles, motorbikes, and bicycles, on AVWR across different road segments. The findings emphasize the importance of context-specific analysis and tailored interventions to effectively address traffic congestion in urban areas, as the complex interplay of side friction factors necessitates comprehensive approaches to traffic management. Regression analyses were conducted on data from 11 major arterial roads, considering factors like pedestrian activity, entry/exit maneuvers, parking situations, and presence of motorbikes, bicycles, and tuk-tuks. Results showed significant positive correlations for most links, with pedestrians, entry/exit maneuvers, and parked vehicles consistently contributing to carriageway width reduction. However, the impact of motorbikes and bicycles varied across locations, underlining the need for location-specific strategies. The study also revealed the intricate interplay among side friction factors, necessitating a holistic approach to traffic management. By understanding these relationships, urban planners and traffic managers can develop targeted strategies to mitigate the impact of side friction factors, improve traffic flow, and enhance overall road network efficiency.

VL  - 9
IS  - 3
ER  -
School of Civil, Environmental & Geospatial Engineering at Jomo Kenyatta University of Agriculture and Technology (JKUAT), Nairobi, Kenya
School of Civil, Environmental & Geospatial Engineering at Jomo Kenyatta University of Agriculture and Technology (JKUAT), Nairobi, Kenya
School of Civil, Environmental & Geospatial Engineering at Jomo Kenyatta University of Agriculture and Technology (JKUAT), Nairobi, Kenya
Information