1. Introduction
According to
| [21] | UNICEF. (2023). Countdown to 2030: RMNCAH country profiles annexes. Retrieved from UNICEF Data. |
[21]
reproductive, maternal, neonatal, child and adolescent health (RMNCAH) encompasses health issues through the course of life from when a girl is an adolescent to women before and during pregnancy, parturition and consequently for the children. Globally, a substantial efforts and investments have been made to improve RMNCAH outcomes since 2000. The MDGs have been one focus for efforts. At the heart of the post-2015 sustainable development framework should be ensuring that women and children get access to health care that is equitable and of high quality over the period 2016-2030
| [23] | United Nations Statistics Division (UNSD). (2024). The Sustainable Development Goals Report 2024. Retrieved from UNSD. |
[23]
.
An approximate 600,000 maternal deaths happen globally, with a daily reporting of up to 800 maternal deaths
| [24] | World Health Organization (WHO). (2023). Maternal mortality. |
[24]
. Over 90% of these deaths are found in countries of middle and low income, especially the continents of Asia and Sub-Saharan Africa (SSA), as documented by
| [25] | World Health Organization. (2021). Evidence, policy, impact: WHO guide for evidence-informed decision-making. World Health Organization. https://iris.who.int/handle/10665/350994 License: CC BY-NC-SA 3.0 IGO. |
[25]
, Sub-Saharan Africa has the poorest performance indicators as compared to the rest of the world
| [20] | Stokes. MJ., and Wilkinson. JP., (2018). The causes of maternal mortality are changing. |
[20]
Women and new-born are at highest risk around and at birth time, sick and small new-born are mostly vulnerable. In SSA, RMNCAH outcomes are not doing well because of poor economies and inadequate supplies and equipment, a trained healthcare workers shortage, a rapid population growth rate, and high costs for individuals in need of maternal services
| [20] | Stokes. MJ., and Wilkinson. JP., (2018). The causes of maternal mortality are changing. |
[20]
Though there has been constant improvement in health industry infrastructure in the recent past, women are still living distant from health facilities and are unable to get the required fee for services of maternal health
| [20] | Stokes. MJ., and Wilkinson. JP., (2018). The causes of maternal mortality are changing. |
[20]
. Over 100,000 maternal deaths, more than half a million stillbirths, and more than one million neonatal deaths are preventable through the provision of proper delivery and maternal care at health facilities
| [21] | UNICEF. (2023). Countdown to 2030: RMNCAH country profiles annexes. Retrieved from UNICEF Data. |
[21]
.
A new constitution was adopted by Kenya in 2010, service provision and governance structure were decentralized with 47 counties being established as governance units that are semi-autonomous with the devolvement of healthcare services to these counties
| [22] | UNICEF. (2024). Maternal and newborn health. Retrieved from UNICEF. |
[22]
. The expectations were, with devolution, innovative interventions could be designed in concurrence with community health needs and contextual realities. The Kenyan constitution is calling for the greatest attainable health standard and that includes including reproductive health for the citizens. The 2014-30 Kenyan Health Policy has a commitment to strengthen service delivery and health care system through the Kenya Health Sector Strategic and Investment Plan (2018 to 2023)
| [22] | UNICEF. (2024). Maternal and newborn health. Retrieved from UNICEF. |
[22]
. The Kenya Reproductive Maternal New-born, Child and Adolescent Investment Framework among others aims at achieving the greatest probable health standards that respond to the needs of the people
| [14] | Ministry of Health [Kenya]. 2018. Monitoring and Evaluation Framework for Universal Health Coverage in Kenya 2018 – 2022. Nairobi, Kenya: Ministry of Health [Kenya]. |
| [15] | Ministry of Health [Kenya]. 2018. Roadmap towards Universal Health Coverage in Kenya – 2018 – 2022. Nairobi, Kenya: Ministry of Health [Kenya]. |
| [16] | Ministry of Health [Kenya]. 2018. The Kenya Health Sector Strategic Plan (KHSSP) 2018 – 2023. Nairobi, Kenya: Ministry of Health [Kenya]. |
[14-16]
.
Kenya, as a member of the UN, is obligated to implement SDG three (3), which is on promoting well-being as well as ensuring healthy lives at all ages. The first target of SDG three spells out that by the year 2030, worldwide MMR should have declined to below 70 per 100,000 live births with not more than twice the global average maternal mortality rate in the country. Further, SDG 3.2 sets out that by the same year, under-five mortality should have reduced to as low as 25 in every 1 1,000ive births, while neonatal mortality declines to 12 in every 1 1,000ive births
| [24] | World Health Organization (WHO). (2023). Maternal mortality. |
[24]
. New policies like user fee elimination for public facilities offering primary health care, free maternity care, and initiatives like Beyond Zero affirm that RMNCAH is recognized by Kenya as a priority in development and reflect its strongest commitment to bringing change and accelerated RMNCAH outcomes achievement
| [14] | Ministry of Health [Kenya]. 2018. Monitoring and Evaluation Framework for Universal Health Coverage in Kenya 2018 – 2022. Nairobi, Kenya: Ministry of Health [Kenya]. |
[14]
.
Due to emerging diseases like the current COVID-19 crisis that is spreading human suffering, destabilizing the economy and upending the lives of people health, achieving these targets require re-engineering of high impact intervention
| [17] | Ministry of Health [Kenya]. 2020. Kenya Progress Report on Health and Health –Related SDGs. Nairobi, Kenya: Ministry of Health [Kenya]. |
[17]
. In ensuring that underserved individuals have access to services and for acceleration of coverage that is equitable, prioritized investments are needed
| [18] | Ministry of Health. Kenya Health policy 2014-2030. |
[18]
. Improvement of high impact interventions, like family planning and institutional deliveries is crucial in improving indicators of RMNCAH performance
| [13] | Ministry of Health [Kenya]. 2017. Kenya Reproductive, Maternal, Newborn, Child and Adolescent Health (RMNCAH) Investment Framework. Nairobi, Kenya: Ministry of Health [Kenya]. |
[13]
. Innovative RMNCAH approaches can potentially accelerate progress and result into improved health outcomes for females and new-borns, but their benefit to health systems is still not comprehended
| [14] | Ministry of Health [Kenya]. 2018. Monitoring and Evaluation Framework for Universal Health Coverage in Kenya 2018 – 2022. Nairobi, Kenya: Ministry of Health [Kenya]. |
[14]
. As part of efforts to improve accountability and monitoring of the delivery of RMNCAH services, the RMNCAH scorecard was adopted by the Kenyan government as a tool for management and accountability in driving improvements in maternal and child health. UNICEF has been supporting RMNCAH scorecard roll-out at decentralized level (national), with near real-time health services monitoring with some significant improvement in health outcomes
| [22] | UNICEF. (2024). Maternal and newborn health. Retrieved from UNICEF. |
[22]
. Key lessons learned are the need to rework on practicability of the scorecard to accommodate lower level of monitoring and evaluation (M&E) knowledge among low level health facility managers to use for improvement of health indicators
| [13] | Ministry of Health [Kenya]. 2017. Kenya Reproductive, Maternal, Newborn, Child and Adolescent Health (RMNCAH) Investment Framework. Nairobi, Kenya: Ministry of Health [Kenya]. |
[13]
.
Despite the potentials positive suggested impact by several studies, scorecard usage in improving RMNCAH performance indicators is still limited in middle- and low-income nations like Kenya which have the biggest the maternal and child mortality burden. As such, the research aimed at determining the factors related to the use (enablers) and barriers of scorecards as a tool to improve RMNCAH performance indicators in public primary care health facilities in selected counties in Kenya.
1.1. Problem Statement
The Kenyan Health System’s transformational changes with the devolution were expected to give a unique opportunity window of addressing long-standing health sector inefficiencies and inequities. However, several years after devolution; minimal outcomes have been public sector reforms tasked for addressing these challenges
| [14] | Ministry of Health [Kenya]. 2018. Monitoring and Evaluation Framework for Universal Health Coverage in Kenya 2018 – 2022. Nairobi, Kenya: Ministry of Health [Kenya]. |
[14]
. Despite the push globally for fostering accountability, improving maternal health and reducing child mortality in an equitable manner, over the last two decades, progress in RMNCAH in Kenya has not been consistent. Kenya fell short of its MDGs targets for child and maternal mortality, indicating inconsistent trend progress between 1990 and 2015 (KNBS, 2019).
Though there is some decrease in both neonatal and maternal mortality rates in Kenya, the rate of reduction is not satisfactory and the maternal mortality ratio (355/100 000 live births) remains unacceptably high as reported in 2022 by Kenya National Bureau of statistics (KNBS) on mortality rate. There are wide regional disparities in the maternal mortality ratio across the 47 counties, with Kwale (464/100 000) and Kilifi (532/100 000) being among the worst counties according to KNBS in 2022. Accelerated efforts will be necessary to lower maternal and neonatal mortality, hence reaching the SDG (3) focus of 12 neonatal deaths per 1 1,000ive births and 70 maternal deaths per 100 000 live births by 2030
| [20] | Stokes. MJ., and Wilkinson. JP., (2018). The causes of maternal mortality are changing. |
[20]
.
Despite implementation of several strategies geared towards improving RMNCAH health outcomes in Kwale and Kilifi Counties there is no significant improvement of the indicator for the last five years (APR, 2023). Health facility deliveries for Kwale and Kilifi stands at 52% and 56% respectively, which is far below the national 66%
. UHC service coverage index for the Kwale (42%) and Kilifi (46%) are low compared to national 62%
. Moreover, at the sub-national level, context-specific evidence innovation is limitedly used to make decisions and interventions prioritization in the planning process. Understanding on the utility of tools promoting county specific evidence usage in the process of planning is low, but could be contributing to high-impact interventions prioritization for children and women
| [14] | Ministry of Health [Kenya]. 2018. Monitoring and Evaluation Framework for Universal Health Coverage in Kenya 2018 – 2022. Nairobi, Kenya: Ministry of Health [Kenya]. |
[14]
.
Though facility managers had been holding quarterly review meetings to discuss performance, there had been no significant improvement in health outcomes
| [13] | Ministry of Health [Kenya]. 2017. Kenya Reproductive, Maternal, Newborn, Child and Adolescent Health (RMNCAH) Investment Framework. Nairobi, Kenya: Ministry of Health [Kenya]. |
[13]
. The review meetings had turned into a routine process, with some managers demotivated and not showing up. An assessment of the country’s status on information usage reported that for routinely collected data, this area was very weak. Available evidence was not the basis for resource allocation, and health information and planning were not connected. Recognizing that progress would not be accelerated by business as usual, relevant innovations and approaches were recommended by the RMNCAH investment framework to the local context to address prioritized challenges. One way to counter the problem was to present the routine data collected at health facilities visually on a single screen. Scorecards had contributed to improved health performance indicators in African countries
| [1] | Blake C, et al. (2016). Scorecards and social accountability for improved maternal and newborn health services: a pilot in the Ashanti and Volta regions of Ghana. Int J Gynecol Obstet, 135(3): 372–9. |
[1]
. Research in Uganda showed overall improvement in common health indicators
| [10] | Kiracho, E. E., Namuhani, N., Apolot, R. R., et al. (2020). Influence of community scorecards on maternal and newborn health service delivery and utilization. International Journal for Equity in Health, 19, Article 145. https://doi.org/10.1186/s12939-020-01184-6 |
[10]
. This enabled facility health manager to monitor a comprehensive set of performance indicators and make informed decisions. There had been little attempt at using scorecards at the national and community levels in Kenya. This study therefore investigated the experiences of public primary care health facility managers in using scorecard as a tool to improve RMNCAH performance indicators.
1.2. Research Objectives
The study investigated the factors associated with the use of scorecard to improve RMNCAH performance indicators and its barriers in public primary health facilities in selected counties, Kenya. The specific objectives included:
1. To establish individual characteristics associated with use of scorecard to improve RMNCAH performance indicators in public primary health facilities.
2. To determine health system structural factors associated with use of scorecard to improve RMNCAH performance indicators in public primary health facilities.
3. To assess behavioural factors associated with use of scorecard to improve RMNCAH performance indicators in public primary health facilities.
4. To identify perceived barriers associated with the successful implementation of scorecard to improve RMNCAH performance indicators in public primary health facilities.
5. To determine effects of training on use of scorecard to improve RMNCAH performance indicators in public primary care health facilities.
1.3. Statement of the Problem
In spite of the significance of scorecards in enhancing RMNCAH outcomes, gaps remain in understanding the individual characteristics, health systems structures, behavioural and perceived barriers to scorecard use in public primary care health facilities. Many healthcare workers may lack the necessary training or awareness of the benefits of scorecards, leading to suboptimal performance in RMNCAH measures. Also, most public primary care health facilities may have insufficient health system structures that could hinder implementation of scorecard to improve RMNCAH outcome. This study intends to fill these gaps by identifying the specific characteristics that facilitate or hinder scorecard utilization. The beneficiaries of this study include healthcare workers, facility managers, policymakers, and ultimately, the communities served by these health facilities.
1.4. Theoretical Framework
The study was premised on the Roger’s 1962 Diffusion of Innovation (DOI) theory. In public health, DOI theory has been used to accelerate adoption programs of importance, and those such as RMNCAH programme that aim at changing behavior of a social system. Success in adoption of public health programs can only be a product of understanding the population targeted and the factors that influence their adoption rate.
2. Material and Methods
2.1. Study Location
The study was carried out in Kwale county (intervention group) and Kilifi County (control group) which were among the six counties in Coast region, Kenya. According to 2019-population census Kwale and Kilifi had a population of 876,529 and 1,545,211 persons respectively. Public primary care health facilities, mainly level 2 (dispensaries) and 3 (health centres) facilities were owned by government (MoH), Non-Governmental Organization (NGO) or Faith Based Organization (FBO). Majority of the health facilities were public primary care facilities accounting for over 75% of the service workload. According to Kenya Master Health Facility List (KMHFL) reports of February 2022, Kwale and Kilifi had a total of 120 and 161 public primary care facilities respectively.
2.2. Study Design and Data Collection Techniques
The study employed quasi-experimental design using both quantitative as well as qualitative approaches in data collection and analysis due to logistical constraints and ethical concerns associated with random assignment. Additionally, the study recruited sixty-two (62) and fifty-seven (57) public primary care health facilities from intervention and control counties respectively. Semi-structured questionnaires were used to collect quantitative data from 119 healthcare workers, selected through stratified random sampling from selected public primary health facilities in Kwale and Kilifi counties, Kenya. Besides, qualitative data were collected using Focus Group Discussions (FGDs) guides and Key Informant Interview (KII) guides.
2.3. Inclusion Criteria and Exclusion Criteria
Health workers who were willing to participate in study and had been working for not less than six months prior to the time of the survey as they had some familiarity and exposure to routine health information generated and knew how it could be utilized. The study excluded those who were unwell or did not consent as they were unwilling to participate.
2.4. Sample Size and Sampling and Data Collection Techniques
Stratified random sampling techniques was used to select the study participant from all the public primary care health facilities in all the sub-counties. The public primary care health facilities were selected equivalent to the number of dispensaries and health centers using simple randomly sampling. A total of 119 health workers were recruited for the study and all administered the same tool to ensure homogeneity. Since the study was conceptualized as an interventional, the formula by Stanley et al., (1990) was applied for calculation of sample size (n) for comparison between two groups when the endpoint is data that is quantitative.
Where;
SD is standard deviation from previous studies or pilot study.
Z α//2 is standard errors from the mean corresponding to 95% confidence interval (1.96).
Z β is power of the test (1.28 for β = 10% and 0.842 for β = 20% from Z table).
d is the effect size = difference between the mean values.
Using standard deviation found in recent studies done with similar design as 10 and level of significance as 5% and the power of study at 80% with effect size of 5.5.
Hence sample size was:
To account for a likely non-response rate of 10% informed by past studies, the effective sample size was adjusted to 57 participants. The study needed at least 57 subjects in each group; hence, the researcher recruited a total of 119 participants.
2.5. Data Analysis
Descriptive statistics were used to summarize key variables of the study findings. Inferential statistical tests were also conducted to identify factors associated with use of scorecard (null hypotheses). Chi-square test analysis was used to establish independent variables that were significantly associated with use of scorecard at a P-value of less than 0.05 (95% confidence interval). Further statistical tests on linear regression models including simple and multiple linear regression, were done to determine the statistical significance of the association between the dependent variable and the combined factors, to identify which were predictors (regressors) hereby rejecting or failing to reject the null hypotheses. Results generated were presented in tables, figures, and textual summaries. The qualitative data from FGDs and KIIs were analyzed using QSR International NVivo 11 into themes and used to interpret, support, discuss, and triangulate the quantitative data findings.
3. Findings
3.1. Individual Characteristics Associated with Use of Scorecard to Improve RMNCAH Performance Indicators
The findings indicated that several individual characteristics were significantly associated with the use of scorecards to improve RMNCAH performance indicators. The study noted that facility in-charge designation played a significant role, with nurses being more likely to use scorecards compared to RCOs (p = 0.007). Additionally, age category was an influential factor, as younger healthcare workers (HCWs), particularly those in the 30-39 age group, were more prevalent in the intervention group (p = 0.004). This suggested that younger professionals may be more open to adopting new monitoring tools compared to their older counterparts.
In terms of marital status, the married individuals were more likely to be in the control group (91% vs. 81% in the intervention), with a statistically significant difference (p = 0.006). Similarly, education level was a major determinant of scorecard use (p = 0.003), as more diploma holders were involved, while no certificate holders were found in the control group. Moreover, level of professional training (nurse vs. RCO) was also significantly associated with scorecard use (p = 0.007), suggesting that nurses were more engaged in monitoring RMNCAH indicators.
In addition, experience in the healthcare field also had a strong influence, with HCWs’ years of experience showing a statistically significant association (p = 0.001). Less experienced healthcare workers (0-4 years) were more likely to be in the intervention group, while those with 10-14 years of experience were more prominent in the control group. This could indicate that newer HCWs are more inclined toward using structured monitoring tools like scorecards. Furthermore, facility location was another determinant (p = 0.034), with rural facilities having the highest proportion of scorecard users, while urban facilities had none in the control group. However, facility type (p = 0.071), sex of HCW (p = 0.096), and size of staff (p = 0.061) were not strongly associated with whether a facility used scorecards. This suggested that the type of facility, gender of the HCW, and number of staff members do not necessarily influence the adoption of scorecards.
Regarding the performance ratings and prior experience with scorecards emerged as the most significant determinants. Facilities that rated their RMNCAH performance indicators as high/good were far more likely to use scorecards (p = 0.000), highlighting the strong correlation between perceived performance and monitoring practices. Additionally, previous use of a scorecard was highly significant (p = 0.000), with 100% of the intervention group having used a scorecard compared to only 14% in the control group. Similarly, training on scorecard use played a crucial role (p = 0.000), as nearly all participants in the intervention group had received training, compared to only 5% in the control group.
Moreover, the type of scorecard trained on was also a key factor, with 97% of the intervention group using facility-based scorecards, while none in the control group had used them (p = 0.000). This highlighted the importance of structured training programs and the type of scorecard implemented in influencing monitoring practices.
3.2. Health System Structural Factors Associated with Use of Scorecard
The finding of the study revealed that at baseline, 74% of facilities in the intervention group monitored RMNCAH indicators compared to 99% in the control group, but this difference was not statistically significant (p = 0.134). However, by the endline, all intervention facilities (100%) monitored RMNCAH performance, while the control facilities slightly decreased to 98%. This suggested that facilities trained on scorecards were more likely to sustain consistent performance monitoring.
Moreover, the results revealed that at baseline, a majority of facilities in the intervention group (76%) monitored performance monthly, compared to only 56% in the control group (p = 0.006). This difference became even more pronounced at endline, where 92% of intervention facilities monitored monthly, while only 53% of control facilities did so (p = 0.001). The sharp increase in monthly monitoring within the intervention group suggests that scorecard use encourages more frequent performance tracking, which is crucial for timely decision-making and improvements in RMNCAH services.
The findings indicated that facilities using scorecards were more likely to monitor RMNCAH performance indicators more frequently, analyze data regularly, and involve nurses in decision-making. The intervention group saw significant improvements in the monthly monitoring and analysis of RMNCAH indicators, which suggests that scorecards may be an effective tool for strengthening data-driven decision-making in healthcare facilities. These results emphasized the importance of integrating scorecard systems into routine facility performance monitoring to enhance maternal and child health outcomes.
3.3. Behavioral Factors Associated with Use of Scorecard
At baseline, most HCWs in the intervention group (73%) had a low rating for behavioral factors, but this decreased significantly to just 5% at endline (Chi-Square = 21.68, p < 0.001). Conversely, those with a high rating increased from 27% to 95%. The control group, however, saw only a marginal improvement, with 63% still rating behavioral factors as low at endline. These results indicate that behavioral change interventions significantly enhance the willingness and capacity of HCWs to engage with performance monitoring tools. The high chi-square value reflects a strong statistical significance, emphasizing the intervention's effectiveness in promoting positive behavioral changes. The findings emphasize that behavioral change interventions, including leadership support, training, and motivation-enhancing strategies, play a vital role in promoting the use of scorecards in health facilities. Positive attitudes, high motivation levels, and organizational readiness for change significantly contribute to the successful adoption of M&E tools. To sustain these improvements, health facilities should continue to invest in behavioral change strategies that foster a culture of performance monitoring, accountability, and data-driven decision-making.
3.4. Perceived Barriers, and the Successful Implementation of Scorecard to Improve RMNCAH Performance Indicators
At baseline, 66% of healthcare workers (HCWs) in the intervention group and 63% in the control group reported holding staff and stakeholder meetings to discuss or review performance. By endline, the proportion in the intervention group increased significantly to 98% (Chi-Square = 3.15, p = 0.700), while it remained unchanged at 63% in the control group. The frequency of these meetings also changed over time. At baseline, 35% of the intervention group and 35% of the control group held monthly meetings, while 27% of the intervention group and 26% of the control group held quarterly meetings. At endline, 98% of the intervention group reported holding monthly meetings (Chi-Square = 34.75, p < 0.001), compared to 35% in the control group. Quarterly and biannual meetings declined in the intervention group, with only 2% reporting quarterly meetings and none holding biannual meetings. In contrast, the control group showed no significant change in meeting frequency (35% monthly, 26% quarterly, and 2% biannually).
Furthermore, the inclusion of all staff and community representatives in performance review meetings improved significantly in the intervention group, increasing from 47% at baseline to 97% at endline (Chi-Square = 16.00, p = 0.220). However, in the control group, involvement remained unchanged at 39% throughout the study period.
Moreover, at baseline, 48% of the intervention group and 47% of the control group reported developing action points with designated personnel and timelines for follow-up. By endline, the proportion in the intervention group increased to 94% (Chi-Square = 10.50, p = 0.050), while it remained unchanged at 47% in the control group. Similarly, the proportion of facilities that tracked and reviewed action plans to take corrective actions if performance did not improve increased from 60% to 90% in the intervention group (Chi-Square = 3.50, p = 0.061), while the control group remained stagnant at 47%.
In addition, at baseline, only 16% of staff in the intervention group reported high commitment to using the scorecard for performance monitoring. By endline, this increased to 55% (Chi-Square = 12.50, p = 0.020), while commitment in the control group remained low at 11%.
Also, at baseline, 84% of healthcare workers in both groups had received training in Data Demand and Information Use (DDIU). By endline, the intervention group saw an increase in trained staff to 97% (Chi-Square = 21.01, p = 0.030), while the control group remained at 84%.
Finally, at baseline, 52% of the intervention group and 42% of the control group reported low perceived barriers to scorecard implementation, while 48% of the intervention group and 58% of the control group perceived barriers as high. By endline, 98% of the intervention group reported low perceived barriers (Chi-Square = 29.00, p < 0.001), compared to 42% in the control group. The proportion of healthcare workers perceiving barriers as high dropped significantly to 2% in the intervention group, while it remained unchanged at 58% in the control group.
3.5. Effects of Training on Use of Scorecard to Improve RMNCAH Performance Indicators
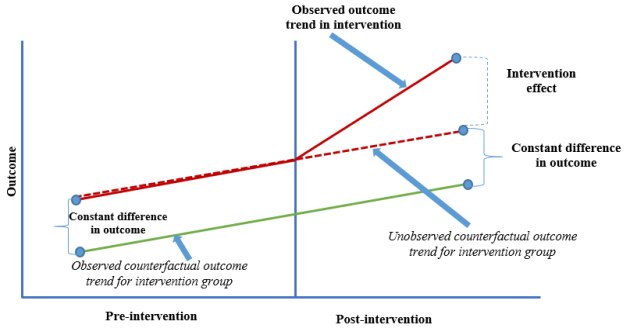
Improved RMNCAH performance indicators attributed to scorecard use between treatment and control group was measured using RMNCAH index (mean) derived from mean/average of means of agreed set of four (4) tracer interventions namely – women of reproductive age receiving family planning commodities, pregnant women attending 4th Antenatal care visits, skilled birth attendant and immunization. Difference-in-differences (DID), method was used to compare the changes in outcome during the nine months’ period between treatment and comparison groups to estimate intervention effect/impact. DID is a powerful statistical method for evaluating the causal impact of a treatment or intervention. It compares changes in outcomes between a treatment group and a control group before and after the treatment is implemented.
Figure 1 below illustrated how the training effect was estimated.
Figure 1. Effects of training on use of scorecard to improve RMNCAH performance indicators.
The regression result (Coefficient: 0.5550, p = 0.0005) showed that training on the scorecard use had a significant positive effect on RMNCAH performance indicators. Therefore, the study concluded that training on the scorecard use significantly improved RMNCAH performance indicators and played a critical role in promoting scorecard adoption.
Table 1. Regression analysis - RMNCAH performance indicators.
Indicator | Unadjusted Difference | Adjusted Difference | Odds Ratio (OR) | p-value |
WRA receiving FP commodities | 78.9 | 96.47 | 1.533 | 0.126 |
Pregnant women completing 4 ANC | 72.6 | 114.13 | 0.761 | 0.005 |
Skilled Birth Attendant | 64.9 | 98.26 | 0.622 | 0.000 |
DPT/Hep+HiB3 (Penta 3) | 141.2 | 186.98 | 0.252 | 0.000 |
RMNCAH Index | 89.4 | 119.2 | 0.312 | 0.000 |
Keys: OR: odds ratios; CI: confidence intervals; WRA: women of reproductive age; FP: family planning; ANC: Ante natal care
The adjusted regression analysis in
Table 1 confirms that the intervention using scorecards significantly improved RMNCAH performance indicators, especially for vaccination coverage, skilled birth attendance, and ANC visit completion. Despite these positive outcomes, some indicators, such as WRA receiving FP commodities, were not statistically significant. This suggests the need to address external barriers and further refine the intervention approach. Overall, the findings highlight the effectiveness of targeted interventions in improving maternal and child health outcomes and emphasize the importance of sustained investment and policy focus on critical health services.
3.6. Discussions
The study’s results highlight how demographic factors (such as age, gender, education level, professional training, and work experience) influenced the use of scorecards to track RMNCAH (reproductive, maternal, newborn, child, and adolescent health) performance in healthcare facilities. According to the study, newer practitioners were more receptive to the scorecards compared to the old staffs. This is in support with the prior research that suggested that employees with short tenure are more receptive to changes than old staff members since they have a set way of doing things
| [4] | Huang, X., Gao, Q., & Wang, D. (2025). The impact of top management team tenure heterogeneity on innovation efficiency of declining firms. PLOS ONE. |
[4]
. Also, training played a vital role in promoting scoring. As expected, the intervention group had higher instrument adoption than the control group since the officials were trained. In addition, at their facilities, the intervention group had a more positive perception of RMNCAH performance compared to the control group. This concurs with
| [19] | Slide Team. (2023). Top 7 training scorecard templates with samples and examples. |
[19]
who affirmed that the hospitals that adopt scorecards usually identify improvements in performance, which may be as a result of better understanding and supervision of key health markers. The findings point to the importance of providing the frontline health care staff members, particularly those who are involved in service delivery responsibilities with adequate training in order to enhance their receptiveness to the scorecards.
In regards to the health systems structural factors, the intervention's success in increasing performance monitoring from 90% to 100% suggested that structured and frequent data reviews help institutionalize routine monitoring. This aligns with
| [3] | Hitt, M. A., Ireland, R. D., & Hoskisson, R. E. (2022). Strategic management: Competitiveness and globalization. Cengage Learning. |
[3]
who emphasized that leadership is a driving force in successful organizational change. Strong leadership was necessary to sustain M&E systems and ensure that scorecard initiatives gain credibility. Moreover, increased involvement of nurses in RMNCAH data analysis (from 60% to 82%) demonstrated the value of capacity building in M&E. This shift aligns with
| [9] | Kilonzo, S. J. (2018). Organizational capacity and institutionalization of monitoring and evaluation in government agencies in the Ministry of Health in Kenya. Kenyatta University Repository. |
[9]
who found that many healthcare workers possess only basic data capture and reporting skills, with limited ability to analyze and interpret health information. Training and education on data management are crucial for strengthening decision-making
| [2] | Giovanelli, L., Rotondo, F., & Fadda, N. (2024). Management training programs in healthcare: Effectiveness factors, challenges, and outcomes. BMC Health Services Research, 24(904). |
[2]
. This implied that lack of training can negatively impact scorecard implementation, as staff who are unfamiliar with M&E practices may fail to utilize data effectively
| [26] | Yeshaw, S., Asrade, G., Hagos, A., Chanie, M. G., & Worku, N. (2025). Practice of balanced scorecard implementation and its contributing factors among public primary hospital professionals in Central Gondar zone, Northwest Ethiopia. Frontiers in Public Health, 12, Article 1424133. https://doi.org/10.3389/fpubh.2024.1424133 |
[26]
. Further, sharing of RMNCAH data with stakeholders enhances transparency, fosters trust, and encourages community participation in health service improvements. The integration of data dissemination mechanisms, such as review meetings, strengthens accountability and ensures that decision-making is informed by accurate and up-to-date information
| [6] | Kamaku, P. M., Ndegwa, J., Kamau, J., & Mbugua, L. (2021). Influence of organizational culture as key strategy implementation dimension on organizational performance of commercial state corporations in Kenya. The International Journal of Business & Management, 9(8). https://doi.org/10.24940/theijbm/2021/v9/i8/165386-400709-3-SM |
[6]
. Promoting a culture of open communication around health data can lead to better stakeholder engagement and service delivery outcomes.
On behavioural factors, the study findings revealed that behavioral factors are critical influencers for effective use and application of M&E tools like the scorecards in the context of healthcare facilities. This demonstrated that targeted interventions are effective for increasing the HCWs’ positive attitude, motivation, management support, and organizational readiness for change. These behavioral changes justify how the scorecards can be effectively implemented for performance monitoring and these changes inform decision making in health services. This was in line with
| [11] | Madzík, P., Soukup, P., Zimon, D., Droppa, M., Štichhauerová, E., Šírová, E., & Lysenko-Ryba, K. (2025). The impact of motivation and management system on individual and organizational performance. The TQM Journal. |
[11]
who highlighted that perceived usefulness and user perceptions had the ability to predict the level of willingness towards the adoption of performance monitoring tools. Additionally, the improvement in behavioral factors within the intervention group demonstrates the effectiveness of structured behavioral change interventions. A decline in HCWs with a low behavioral rating and a corresponding increase in those with a high rating highlight the importance of fostering a supportive work environment Employee attitudes and trust toward their organization and work setting significantly impact job performance and commitment
| [5] | Irimia-Diéguez, A., Velicia-Martín, F., & Aguayo-Camacho, M. (2023). Predicting Fintech innovation adoption: The mediator role of social norms and attitudes. Financial Innovation, 9(36). |
[5]
. When behavioral factors are positively reinforced, HCWs become more engaged, motivated, and proactive in utilizing scorecards for performance monitoring.
In regard to the perceived barriers, failure to engage all the healthcare staff and other stakeholders in the performance review meetings can significantly affect scorecard adoption
| [18] | Ministry of Health. Kenya Health policy 2014-2030. |
[18]
. The study showed that all employees within the organization like the community representatives must be involved in the program, so that there could be ownership of the program. This concurs with the observation made by
| [12] | Martikainen, S., Korpela, M., & Tiihonen, T. (2020). End-user participation in health information systems development: Physicians' and nurses' experiences. International Journal of Medical Informatics, 134, 104018. https://doi.org/10.1016/j.ijmedinf.2019.104018 |
[12]
on how the use of participatory techniques makes sure all the stakeholders participate in performance monitoring by ensuring that they take part in scoring it. Another factor that helped in reducing the perceived barriers was the Training in Data Demand and Information Use (DDIU). This concurred with
| [19] | Slide Team. (2023). Top 7 training scorecard templates with samples and examples. |
[19]
who established that health care personnel that went through DDIU training were better placed to use health information in decision-making. This underscores the need for continuous capacity strengthening efforts.