Ration formulation plays a crucial role in the profitability and sustainability of animal farming, particularly in developing economies like Nigeria, where feed costs can account for 60-80% of production expenses. Traditional methods such as the Pearson Square and matrix techniques are limited in flexibility, scope, and ability to handle multiple constraints. This study introduces a novel approach by integrating graph theory (network models) with the Pearson Square method to develop diverse, cost-effective, and nutritionally balanced animal feed rations. Using secondary data from agricultural by-products sourced predominantly from Benue State, Nigeria, a directed multi-stage network was constructed with 50 vertices (ingredients) and 237 edges (ingredient interactions), representing nine stages of feed formulation, ranging from energy and protein sources to vitamins and minerals. The developed model generated over 30,000 unique feed formulations. Analytical results showed average nutritional outputs of metabolizable energy at 28g 6.86 kcal/kg, crude fibre at 8.13%, dry matter at 80.75%, nitrogen at 34.33%, and calcium at 0.28%, all within acceptable ranges for animal nutrition. The model offers flexibility to accommodate cultural and regional ingredient restrictions and addresses feed preservation concerns. This research demonstrates the potential of network optimization techniques in enhancing ration formulation processes in animal agriculture.
| Published in | American Journal of Operations Management and Information Systems (Volume 10, Issue 3) |
| DOI | 10.11648/j.ajomis.20251003.11 |
| Page(s) | 55-62 |
| Creative Commons |
This is an Open Access article, distributed under the terms of the Creative Commons Attribution 4.0 International License (http://creativecommons.org/licenses/by/4.0/), which permits unrestricted use, distribution and reproduction in any medium or format, provided the original work is properly cited. |
| Copyright |
Copyright © The Author(s), 2025. Published by Science Publishing Group |
Network Model, Graph Theory, Pearson Square Method, Feeds Rations, Feed Formulas, Network Analysis, Mathematical Feed Formulation
S/N | Ingredients | CP | Availability (%) | Dry Matter | Ether Extract | Crude Fibre | Nitrogen | Energy | Ca | Phosphorus | Hygiene | Methionine |
|---|---|---|---|---|---|---|---|---|---|---|---|---|
1 | Maize (Yellow) | 8.8 | 60 | 89.60 | 4.8 | 1.9 | 67.58 | 3333 | 0.02 | 0.27 | 0.20 | 0.15 |
2 | Sorghum (red) | 8.0 | 60 | 90.00 | 3.0 | 5.0 | 0 | 3300 | 0.04 | 0.32 | 0.21 | 0.16 |
3 | Sunflower seed | 41.0 | 10 | 93.00 | 7.60 | 21.00 | 4.89 | 2310 | 0.43 | 1.00 | 2.00 | 1. 60 |
4 | Wheat | 13.5 | 5 | 88.00 | 1.9 | 3.00 | 0 | 3035 | 0.05 | 0.41 | 0.40 | 0.25 |
5 | Millet | 12.00 | 5 | 90.0 | 4.2 | 1.8 | 70.07 | 3440 | 0.05 | 0.30 | 0.35 | 0.28 |
6 | Cassava Flour Meal | 3.10 | 80 | 89.42 | 0.99 | 3.73 | 89.90 | 3090 | 0.14 | 0.37 | 0.07 | 0 |
7 | Rice Grain (Broken) | 8.50 | 20 | 89.00 | 0.60 | 0.20 | 88.4 | 3472 | 0.32 | 0.34 | 0.32 | 0.25 |
8 | Rice Bran | 13.50 | 70 | 91.00 | 5.90 | 13.00 | 30.23 | 2040 | 0.10 | 1.70 | 0.50 | 0.17 |
9 | Sweet Potato | 2.76 | 20 | 94.25 | 1.87 | 1.20 | 90.68 | 0.60 | 0.02 | 0.03 | 0.23 | 0.09 |
10 | Cowpea Taste | 16.97 | 30 | 95.75 | 2.65 | 2035 | 4.58 | 1005 | 2.06 | 6.31 | 0 | 0 |
11 | Plantain peels | 14.03 | 2 | 91.29 | 5.74 | 4.72 | 10.71 | 1367 | 0.10 | 0.34 | 0 | 0 |
12 | Orange Pulp | 0 | 20 | 89.48 | 6.78 | 9.45 | 0 | 1049 | 0 | 0 | 0 | 0 |
13 | Melon fruit pulp | 8.48 | 10 | 93.50 | 4.17 | 31.06 | 14.01 | 1148 | 0 | 0 | 0 | 0 |
14 | Cassava Peels | 5.33 | 80 | 87.59 | 1.81 | 14.25 | 70.37 | 2807 | 0.65 | 0.25 | 0 | 0 |
15 | Maize Bran | 10.2 | 60 | 90.9 | 4 | 7.8 | . | 41.50 | 2.7 | 3 | 6.2 | 2 |
16 | Wheat Bran | 14.8 | 20 | 89.00 | 4.00 | 10.60 | 41.29 | 2320 | 0.14 | 1.17 | 0.60 | 0.20 |
17 | Brewer dried grains | 1.60 | 30 | 84.30 | 6.80 | 13.80 | 53.70 | 0 | 0.08 | 0.10 | 0.56 | 0.20 |
19 | Sweet Potato Peels | 5.8 | 20 | 40.0 | 0.54 | 1.20 | 90.68 | 3596 | 0 | 0 | 0 | 0 |
20 | Yam Peels Meal | 11.74 | 20 | 25.87 | 1.01 | 6.56 | 71.2 | 3009 | 0.38 | 0.1 | 0 | 0 |
21 | Blood Meal | 80.00 | 40 | 89.00 | 1.00 | 1.0 | 5.09 | 3220 | 0.28 | 0.22 | 6.90 | 1.0 |
22 | Fish meal | 65.00 | 20 | 92.00 | 8.50 | 0.40 | 22.35 | 2646 | 3.00 | 1.8 | 3.00 | 0.90 |
23 | Meat/bone meal | 52 | 20 | 92 | 0. | 0. | 0 | 2910 | 1001 | 04.8 | 1.5 | 2.7 |
24 | Maggot meal (dried) | 60 | 40 | 88.5 | 19.00 | 0.50 | 0 | 0 | 0.20 | 0.20 | 3.60 | 1.40 |
25 | Meal Offals | 56.5 | 20 | 8.0 | 0.4 | 4.8 | 1287 | 1.7 | 2.0 | |||
26 | Cottonseed | 23 | 2 | 92 | 19 | 26 | 0 | 1900 | 1.19 | 0.16 | 0.4 | 1.02 |
27 | Meal | 42 | 90 | 3 | 8.0 | 21.45 | 2550 | 0.20 | 0.20 | 1.60 | 0.48 | |
28 | G/nut cake | 40 | 80 | 90.0 | 6.0 | 8.0 | 17.01 | 2640 | 0.20 | 0.20 | 1.60 | 0.48 |
29 | Sesame Cake | 42 | 30 | 94.0 | 7.0 | 6.50 | 3.67 | 2255 | 2.00 | 1.3 | 1.37 | 1.48 |
30 | Soybean’s cake | 48 | 70 | 89 | 1.7 | 3.0 | 4210 | 02 | 0.65 | 6.11 | 1.34 | |
31 | Soybeans | 37 | 70 | 92 | 18 | 5.5 | 19.12 | 3100 | 0.20 | 4.50 | 2.25 | 0.49 |
32 | PKC | 21 | 30 | 90 | 4.40 | 17.5 | 0 | 2500 | 0.40 | 0.50 | 0.69 | 0.32 |
33 | Cassava leaf meal | 23.79 | 80 | 92.06 | 6.83 | 17.7 | 40.46 | 2856 | 1.24 | 0.6 | 1.04 | 0 |
34 | Toasted G/nut Taste | 18.98 | 80 | 99.00 | 10.00 | 10.00 | 0 | 912 | 0 | 0 | 0 | 0 |
High Energy | Medium Energy | Low Energy | High crude Protein | Medium crude protein | Low crude protein | Minerals | Amino Acid | Vitamins |
|---|---|---|---|---|---|---|---|---|
Maize, G/corn (Sorghum), Sunflower seed, Wheat, Barley, Millet, Acha, Cassava flour meal, Yam flour meal and Rice grain. | Cassava peeling, Maize bran, Wheat bran, Brewer dried grains, Sweet potato peeled and Yam peels meal | Rice bran, Stovers, Haulms, Straws, Sweet potato (unpeeled), Cow testa, Plantain peels, Orange pulp and Melon fruit pulp. | Blood meal, Fish meal, Meat/bone meal, Maggot meal, Hatchery waste (dead embryo) and Meat offers | Palm kernel cake, Cottonseed cake, G/nut cake, Rapeseed cake, Rapeseed meal Sesame cake, Sunflower seed cake, Soybean cake and Soybean full-fat. | Cassava leaf meal, Cowpea testa, Toasted G/nut testa, Soybean testa, Ripe pawpaw seeds and Rice bran | Bone ash, Limestone, Monocalcium phosphate Salt, Shells grit, Oster shells, Di-calcium phosphate, Iron extreme and Common sand. | phenylalanine, valine, threonine, tryptophan, isoleucine, methionine, histidine, arginine, leucine and lysine. | vitamins A, C, D, E, K, and the B vitamins (thiamine, riboflavin, niacin, pantothenic acid, biotin, B6, B12, and folate) |
CP | Crude Protein |
Ca | Calcium |
G/corn | Guinea Corn |
G/Nut | Ground Nut |
| [1] | Ghosh S., Ghosh J., Pal D. T. and Gupta R. (2014). Current Concepts of Feed Formulation for Livestock Using Mathematical Modeling. Animal Nutrition and Feed Technology. 14: 205-223. |
| [2] | Tamber A. J., Ikpotokin F. O., Oladejo M. O., Okafor L. U. and Odeh J. O. (2019). Mathematical Formulation of the Nigeria Road Network Model of Multiple Sources to Multiple Destinations. International Journal of Mathematics and Statistics Invention. |
| [3] | Ikpotokin F. O. and Tamber A. J. (2017). An algorithm for Finding Critical Path Activities and Total Duration of Multiple Projects (Multiple Sources to Multiple Destinations). Journal of Scientific and Engineering Research 4(6): 99 - 102. |
| [4] | Dooren V. P. (2009). Graph Theory and Application. Lecture Note in Universite Catholique de Louvain. |
| [5] | Tamber, J. A.; Ikpotokin F. O.; Okafor L. U. and Odeh J. O. (2020). A Comparative Analysis of the Shortest Path Algorithms for Covid-19 Activities and Distribution of Palliatives Items. Proceedings of the 3rd International Conference of the Institute of Operational Research and Management Science of Nigeria (IORMS). |
| [6] | Tamber, A. J., Ikpotokin F. O., Okafor L. U., Ateata G. A., Odeh J. O. and Amon P. (2021). MS-MD-Shortest Route Pathfinder for Multiple Sources to Multiple Destinations of Directed Graph Models. International Journal of Computing, Programming and Database Management. 2(1): 01-07. |
| [7] | Terdoo, F., Gyang, T. and Iorlamen, T. R. (2016). Annual Cropped Area Expansion and Agricultural Production: Implications for Environmental Management in Benue State, Nigeria. Ethiopian Journal of Environmental Studies & Management 9(4): 430-442. |
| [8] | Abur, C. C. (2014). Assessment of Food Security Status among Rural Farming Households in Guma Local Government Area of Benue State, Nigeria. International Journal of Research in Humanities and Social Studies Volume 1, Issue 2, 34-42. |
| [9] | Singh, R. (2019). Method of Feed Formulation for Commercial Layers and Broilers Ration: Making your Own Quality Chicken Feed at Home to Cut Costs. Livestock Institute of Training and development. |
| [10] | Singh, R. (2021). Method of Formulation for Least Cost Dairy Cattle Feed/ Ration. Livestock Institute of Training and development. |
| [11] | Wagner J. and Stanton T. L. (2021). Formulating Rations with the Pearson Square. Colorada State University Extension - A division of the Office of Engagement. Providing trusted, practical education to help you solve problems, develop skills and build a better future. |
| [12] |
Byrne J. (2021). New Guide Brings Updated and Precise Ingredient Values for Efficient Feed Formulation. News &Analysis on the Global Feed industry.
https://www.feednavigator.com/Article/2019/10/02/New-matrix-for-efficient-feed-formulation |
| [13] | Thuleswar N. & Ashok T. (2014). Linear Programming Technique in Fish Feed Formulation. International Journal of Engineering Trends and Technology. Vol. 17: 3 |
APA Style
Tamber, A. J., Tamber, D. D., Anongo, T. (2025). A Pearson-network Approach to Animals’ Feed Formulation. American Journal of Operations Management and Information Systems, 10(3), 55-62. https://doi.org/10.11648/j.ajomis.20251003.11
ACS Style
Tamber, A. J.; Tamber, D. D.; Anongo, T. A Pearson-network Approach to Animals’ Feed Formulation. Am. J. Oper. Manag. Inf. Syst. 2025, 10(3), 55-62. doi: 10.11648/j.ajomis.20251003.11
@article{10.11648/j.ajomis.20251003.11,
  author = {Abraham Jighjigh Tamber and Dooshima Deborah Tamber and Titu Anongo},
  title = {A Pearson-network Approach to Animals’ Feed Formulation
},
  journal = {American Journal of Operations Management and Information Systems},
  volume = {10},
  number = {3},
  pages = {55-62},
  doi = {10.11648/j.ajomis.20251003.11},
  url = {https://doi.org/10.11648/j.ajomis.20251003.11},
  eprint = {https://article.sciencepublishinggroup.com/pdf/10.11648.j.ajomis.20251003.11},
  abstract = {Ration formulation plays a crucial role in the profitability and sustainability of animal farming, particularly in developing economies like Nigeria, where feed costs can account for 60-80% of production expenses. Traditional methods such as the Pearson Square and matrix techniques are limited in flexibility, scope, and ability to handle multiple constraints. This study introduces a novel approach by integrating graph theory (network models) with the Pearson Square method to develop diverse, cost-effective, and nutritionally balanced animal feed rations. Using secondary data from agricultural by-products sourced predominantly from Benue State, Nigeria, a directed multi-stage network was constructed with 50 vertices (ingredients) and 237 edges (ingredient interactions), representing nine stages of feed formulation, ranging from energy and protein sources to vitamins and minerals. The developed model generated over 30,000 unique feed formulations. Analytical results showed average nutritional outputs of metabolizable energy at 28g 6.86 kcal/kg, crude fibre at 8.13%, dry matter at 80.75%, nitrogen at 34.33%, and calcium at 0.28%, all within acceptable ranges for animal nutrition. The model offers flexibility to accommodate cultural and regional ingredient restrictions and addresses feed preservation concerns. This research demonstrates the potential of network optimization techniques in enhancing ration formulation processes in animal agriculture.
},
 year = {2025}
}
TY  - JOUR
T1  - A Pearson-network Approach to Animals’ Feed Formulation

AU  - Abraham Jighjigh Tamber
AU  - Dooshima Deborah Tamber
AU  - Titu Anongo
Y1  - 2025/09/19
PY  - 2025
N1  - https://doi.org/10.11648/j.ajomis.20251003.11
DO  - 10.11648/j.ajomis.20251003.11
T2  - American Journal of Operations Management and Information Systems
JF  - American Journal of Operations Management and Information Systems
JO  - American Journal of Operations Management and Information Systems
SP  - 55
EP  - 62
PB  - Science Publishing Group
SN  - 2578-8310
UR  - https://doi.org/10.11648/j.ajomis.20251003.11
AB  - Ration formulation plays a crucial role in the profitability and sustainability of animal farming, particularly in developing economies like Nigeria, where feed costs can account for 60-80% of production expenses. Traditional methods such as the Pearson Square and matrix techniques are limited in flexibility, scope, and ability to handle multiple constraints. This study introduces a novel approach by integrating graph theory (network models) with the Pearson Square method to develop diverse, cost-effective, and nutritionally balanced animal feed rations. Using secondary data from agricultural by-products sourced predominantly from Benue State, Nigeria, a directed multi-stage network was constructed with 50 vertices (ingredients) and 237 edges (ingredient interactions), representing nine stages of feed formulation, ranging from energy and protein sources to vitamins and minerals. The developed model generated over 30,000 unique feed formulations. Analytical results showed average nutritional outputs of metabolizable energy at 28g 6.86 kcal/kg, crude fibre at 8.13%, dry matter at 80.75%, nitrogen at 34.33%, and calcium at 0.28%, all within acceptable ranges for animal nutrition. The model offers flexibility to accommodate cultural and regional ingredient restrictions and addresses feed preservation concerns. This research demonstrates the potential of network optimization techniques in enhancing ration formulation processes in animal agriculture.

VL  - 10
IS  - 3
ER  -
Department of Statistics, Joseph Sarwuan Tarka University Makurdi. Benue State University, Makurdi, Nigeria
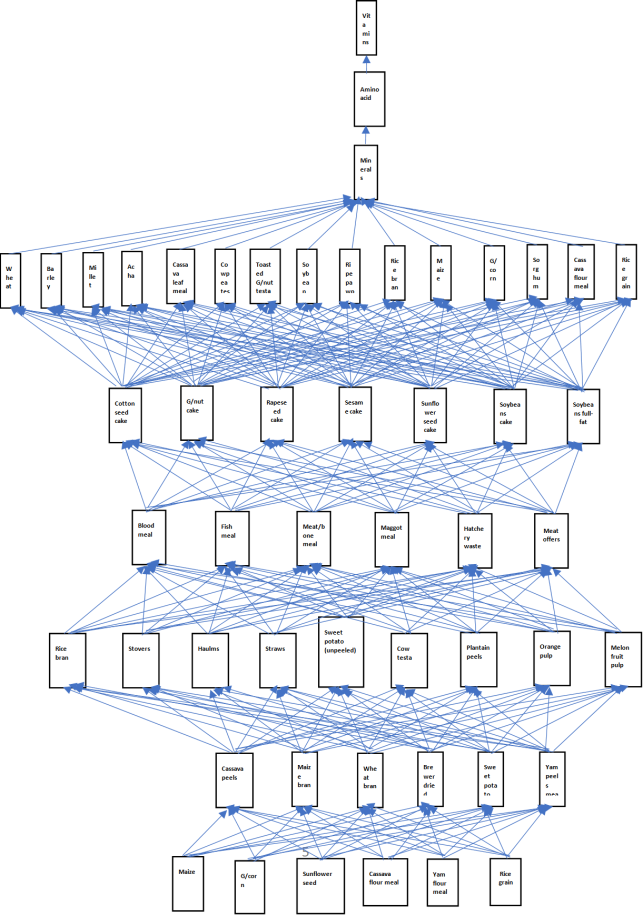
Figure 1. Animal Feeds’ Ingredients Interaction Network.
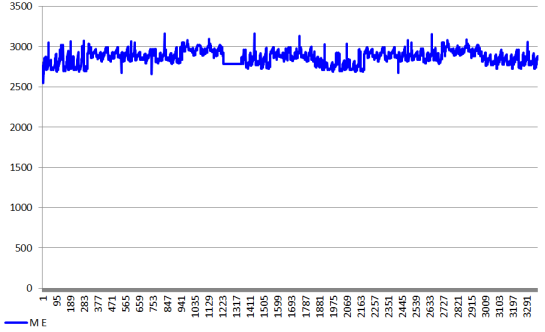
Figure 2. Metabolizable Energy Content in the Formulated Feeds.
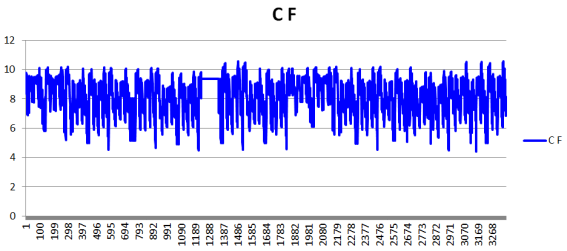
Figure 3. Crude Fibre Content in the Formulated Feeds.
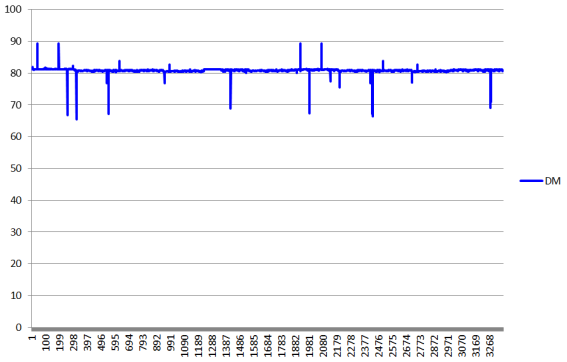
Figure 4. Dry Matter Content in the Formulated Feeds.
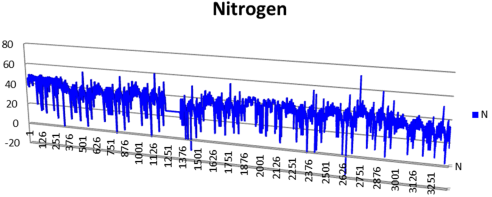
Figure 5. Nitrogen Content in the Formulated Feeds.
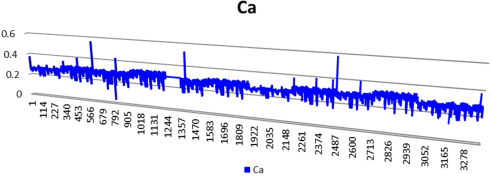
Figure 6. Calcium Content in the Formulated Feeds.
Information

