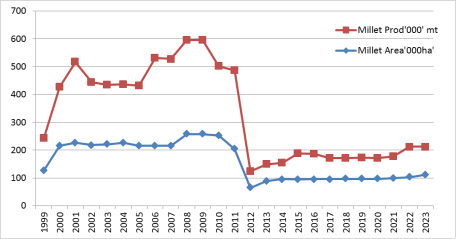
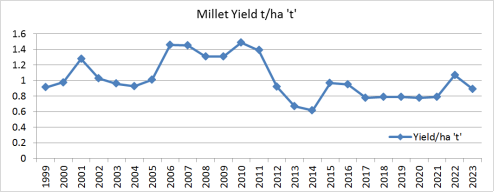
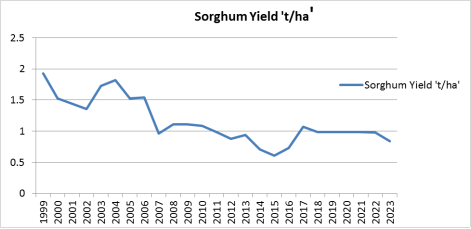
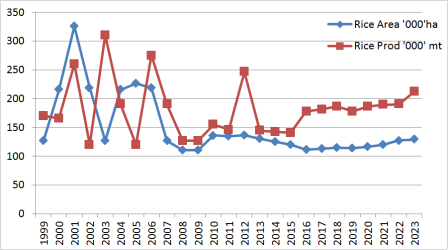
The study examined the impacts of Boko Haram (BH) insurgency on output of crops in Borno, Adamawa and Yobe (BAY) states, Northeast, Nigeria. Time Series data from 1999-2023 was used which was sub divided into 1999-2008 (Period before Boko Haram), 2009-2017 (Period during the peak of Boko Haram) and 2020-2023 as current period. Percentage change, Instability Index and Hazell Decomposition models were used to determined changes, variability and its sources in area, production and productivity of major staple crops (Maize, Millet, Sorghum, Cowpea and Rice) in the study area. The results revealed that, millet recorded the highest decrease in area between period before BH and during the peak period of the insurgent’s activities. Decrease in yield was noticed in all the states and was higher in sorghum, millet and cowpea, so does instability in area, production and productivity of the crops during the period of the insurgency. Similarly sources of change in average of production were majorly as a result of change in mean yield and change in mean area. The findings implied that, farmers has abandoned their farm lands for fear of attacks during the BH period and that poor management practices and inaccessibility to inputs resulted in low yield of crops, The study recommends employing all measures that would in the short and long run increase yield of crops and ‘returnees’ should be giving adequate attention to go back to active farming.
| Published in | International Journal of Agricultural Economics (Volume 10, Issue 5) |
| DOI | 10.11648/j.ijae.20251005.15 |
| Page(s) | 255-270 |
| Creative Commons |
This is an Open Access article, distributed under the terms of the Creative Commons Attribution 4.0 International License (http://creativecommons.org/licenses/by/4.0/), which permits unrestricted use, distribution and reproduction in any medium or format, provided the original work is properly cited. |
| Copyright |
Copyright © The Author(s), 2025. Published by Science Publishing Group |
Boko Haram, Insurgency, Instability, Crop Production, North East
Crops | Borno state | Before BH period (2005-2008) | During the peak of BH (2013-2016) | Difference | % change | During the peak of BH (2013-2016) | Current Period (2020-2023) | Difference | % change |
|---|---|---|---|---|---|---|---|---|---|
Millet | Area | 225.99 | 93.78 | -132.21 | -58.51 | 93.78 | 102.29 | 8.51 | 9.08 |
Production | 295.52 | 232.29 | -63 | -21.39 | 232.29 | 90.78 | -141.51 | -60.92 | |
Productivity | 1.307 | 0.805 | -0.502 | -38.41 | 0.805 | 0.882 | 0.077 | 9.59 | |
Sorghum | Area | 279.63 | 193.09 | -86.54 | -30.95 | 279.63 | 355.57 | 75.94 | 45.69 |
Production | 361.78 | 213.56 | -148.22 | -40.96 | 213.56 | 337.48 | 123.94 | 58.02 | |
Productivity | 1.28 | 0.75 | -0.53 | -41.72 | 0.75 | 0.95 | 0.2 | 27.09 | |
Cowpea | Area | 177.72 | 175.82 | -1.9 | -1.07 | 175.82 | 187.05 | 11.23 | 6.38 |
Production | 119.47 | 76.62 | -42.85 | -35.86 | 76.62 | 149.43 | 72.81 | 95.02 | |
Productivity | 0.67 | 0.45 | -0.22 | -33.46 | 0.45 | 0.81 | 0.36 | 81.01 | |
Maize | Area | 323.16 | 310.92 | -12.24 | -3.78 | 310.92 | 395.89 | 84.97 | 27.33 |
Production | 428.00 | 338.31 | -89.69 | -20.96 | 338.31 | 546.96 | 208.65 | 61.67 | |
Productivity | 1.47 | 1.38 | -0.09 | -5.46 | 1.38 | 1.39 | 0.01 | 0.54 | |
Rice | Area | 195.38 | 121.86 | -73.52 | -37.63 | 121.86 | 128.79 | 6.93 | 1.18 |
Production | 178.15 | 151.58 | -26.57 | -14.91 | 151.58 | 194.63 | 43.05 | 28.41 | |
Productivity | 1.11 | 1.25 | 0.14 | 13.03 | 1.25 | 1.64 | 0.39 | 30.42 | |
Groundnut | Area | 153.66 | 147.6 | -6.06 | -3.94 | 147.6 | 159.96 | 12.36 | 8.38 |
Production | 252.74 | 163.24 | -89.5 | -35.4 | 163.24 | 193.56 | 30.32 | 18.57 | |
Productivity | 1.92 | 1.11 | -0.81 | -42.31 | 1.11 | 1.21 | 0.11 | 9.48 |
Crops | Adamawa State | Before BH period (2005-2008) | During the peak of BH (2013-2016) | Difference | % change | During the peak of BH (2013-2016) | Current Period (2020-2023) | Difference | % change |
|---|---|---|---|---|---|---|---|---|---|
Millet | Area | 48.75 | 52.72 | 3.9 | 8.15 | 52.72 | 138.66 | 83.9 | 161.87 |
Production | 39.287 | 52.307 | 13.0 | 33.14 | 52.307 | 172.75 | 120.4 | 230.27 | |
Productivity | 0.812 | 0.662 | -0.15 | -18.46 | 0.662 | 1.127 | 0.47 | 70.188 | |
Sorghum | Area | 123.59 | 154.185 | 30.6 | 42.75 | 154.185 | 269.84 | 115.6 | 75.01 |
Production | 165.24 | 173.55 | 8.31 | 5.03 | 173.55 | 293.2 | 119.7 | 68.94 | |
Productivity | 1.34 | 1.18 | -0.16 | -11.38 | 1.18 | 1.06 | -0.12 | -10.32 | |
Cowpea | Area | 63.475 | 76.755 | 13.3 | 20.92 | 76.755 | 201.84 | 125.1 | 162.96 |
Production | 51.733 | 103.42 | 51.7 | 99.92 | 103.42 | 204.82 | 101.4 | 98.04 | |
Productivity | 0.815 | 1.74 | 0.93 | 113.34 | 1.74 | 1.09 | -0.6 | -37.36 | |
Maize | Area | 159.30 | 205.81 | 46.5 | 25.19 | 205.81 | 209.78 | 3.97 | 1.93 |
Production | 179.35 | 206.78 | 27.4 | 15.95 | 206.78 | 429.18 | 222.4 | 106.65 | |
Productivity | 1.13 | 1.16 | 0.03 | 2.58 | 1.16 | 1.22 | 0.06 | 5.38 | |
Rice | Area | 68.157 | 90.125 | 21.9 | 32.23 | 90.125 | 178.12 | 87.9 | 97.63 |
Production | 119.65 | 130.156 | 10.5 | 8.77 | 130.156 | 281.08 | 150,9 | 115.96 | |
Productivity | 1.756 | 1.725 | -0.03 | -1.78 | 1.725 | 1.6175 | -0.11 | -6.209 |
Crops | Yobe State | Before BH period (2005-2008) | During the peak of BH (2013-2016) | Difference | % change | During the peak of BH (2013-2016) | Current Period (2020-2023) | Difference | % change |
|---|---|---|---|---|---|---|---|---|---|
Millet | Area | 298.65 | 209.87 | -88.8 | -29.73 | 209.87 | 215.10 | 5.3 | 2.49 |
Production | 301.08 | 154.0 | -147.1 | -48.85 | 154.0 | 235.36 | 81.4 | 52.83 | |
Productivity | 0.985 | 0.733 | -0.25 | -25.63 | 0.733 | 1.095 | 0.362 | 49.48 | |
Sorghum | Area | 168.89 | 170.26 | 1.9 | 0.811 | 170.26 | 206.36 | 36.1 | 21.21 |
Production | 185.63 | 142.08 | -43.6 | -23.46 | 142.08 | 205.19 | 63.11 | 44.42 | |
Productivity | 1.11 | 0.82 | -0.29 | -26.14 | 0.82 | 0.99 | 0.17 | 21.34 | |
Cowpea | Area | 120.95 | 107.38 | -13.57 | -11.22 | 107.38 | 122.72 | 15.34 | 4.97 |
Production | 67.93 | 68.22 | 0.29 | 0.434 | 68.22 | 204.32 | 136.1 | 199.49 | |
Productivity | 0.56 | 0.42 | -0.14 | -26.24 | 0.42 | 1.83 | 1.41 | 341.56 | |
Maize | Area | 8.48 | 7.94 | -0.54 | -6.36 | 7.94 | 9.15 | 1.21 | 15.24 |
Production | 13.66 | 12.8 | -0.86 | -6.31 | 12.8 | 13.88 | 1.08 | 8.46 | |
Productivity | 1.63 | 1.17 | -0.46 | -17.0 | 1.17 | 1.52 | 0.35 | 30.04 | |
Rice | Area | 23.56 | 36.54 | 12.98 | 55.10 | 36.54 | 97.19 | 60.65 | 165.95 |
Production | 30.46 | 36.85 | 6.39 | 21.01 | 36.85 | 174.64 | 137.8 | 373.88 | |
Productivity | 1.28 | 1.02 | -0.26 | -20.97 | 1.02 | 1.79 | 0.77 | 77.09 |
Period | Crops | Borno State | Adamawa State | Yobe State | ||||||
|---|---|---|---|---|---|---|---|---|---|---|
Area | Production | Productivity | Area | Production | Productivity | Area | Production | Productivity | ||
CII in% | CII in% | CII in% | ||||||||
1999 -2008 | Millet | 18.83 | 28.11 | 18.81 | 19.95 | 27.78 | 14.41 | 14.47 | 26.58 | 14.47 |
Before BH | Maize | 13.28 | 19.94 | 21.56 | 10,69 | 14.54 | 4.21 | 24.82 | 24.18 | 12.93 |
Sorghum | 8.16 | 33.61 | 22.13 | 11.83 | 9.20 | 8.25 | 3.60 | 9.29 | 11.42 | |
Cowpea | 15.86 | 27.58 | 12.72 | 7.46 | 10.09 | 9.10 | 5.42 | 16.93 | 16,23 | |
Rice | 8.07. | 80.44 | 73.26 | 20.7 | 25.47 | 7.63 | 27.87 | 40.93 | 19.93 | |
G/nut | 12.82 | 42.30 | 61.34 | - | - | - | - | - | - | |
2009 -2018 | Millet | 29.12 | 56.65 | 24.52 | 83.97 | 48.86 | 40.88 | 10.48 | 27.88 | 16.18 |
BH period | Maize | 15.53 | 21.57 | 27.51 | 14.05 | 32.37 | 27.46 | 6.33 | 10.29 | 21.68 |
Sorghum | 23.05 | 20.65 | 22.94 | 18.50 | 22.92 | 9.83 | 6.22 | 17.26 | 12.37 | |
Cowpea | 11.06 | 28.97 | 24.87 | 29.83 | 48.07 | 40.26 | 7.86 | 44.41 | 37.84 | |
Rice | 50.47 | 24.10 | 23.03 | 27.44 | 33.98 | 21.23 | 31.93 | 53.22 | 25.58 | |
G/nut | 11.13 | 10.70 | 13.21 | - | - | - | - | - | - | |
State | Crop | Change in mean Area | Change in mean Yield | Interaction between mean Yield and mean Area | Changes in Area - Yield covariance |
|---|---|---|---|---|---|
Borno | Millet | -7.60 | 160.74 | -59.59 | 6.51 |
Maize | -419.91 | 472.47 | 26.65 | 21.07 | |
Sorghum | 1.69 | 101.83 | -0.66 | -1.83 | |
Cowpea | 536.45 | -373.69 | -63.26 | -5.93 | |
Rice | 159.06 | -88.48 | 31.33 | -1.08 | |
Groundnut | -110.87 | 158.31 | 51.23 | 1.29 | |
Adamawa | Maize | 45.08 | 42.74 | 10.23 | 2.01 |
Millet | 168.72 | -52.89 | -19.03 | 4.11 | |
Sorghum | 116.04 | -8.76 | -1.33 | -6.67 | |
Cowpea | 24.49 | 55.54 | 21.81 | -1.83 | |
Rice | 120.08 | -13.11 | -2.96 | -3.60 | |
Groundnut | - | - | - | - | |
Yobe | Millet | 76.48 | 31.49 | 1.85 | -4.50 |
Maize | 359.71 | -207.19 | -54.90 | 2.32 | |
Sorghum | -197.6 | 251.46 | 50.05 | -3.18 | |
Cowpea | -85.36 | 211.49 | -21.55 | -4.49 | |
Rice | 122.23 | -13.16 | -14.19 | 4.98 | |
Groundnut | -18.06 | 144.14 | -26.66 | 1.39 |
States and Crops | Change in mean Yield | Change in mean Area | Change in area variance | Change in yield variance | Interaction b/w changes in mean area and mean yield | Changes in area-yield covariance | Interaction b/w changes in mean yield and area varianc | Interaction b/w changes in mean area and yield variance | Interaction between changes in mean area and mean yield and area- yield covariance | Changes in residuals |
|---|---|---|---|---|---|---|---|---|---|---|
Borno State | ||||||||||
Maize | -15.99 | -0.35 | -5.89 | 363.1 | 0.03 | -280.8 | 0.72 | 42.12 | 2.98 | -5.9 |
Millet | 6.90 | -0.14 | 0.19 | 70.51 | -0.41 | 6.85 | 14.83 | -42.59 | 37.41 | 6.45 |
Sorghum | 23620 | 52.16 | 12372.2 | 11081.68 | 39.12 | -1407.8 | -7783.77 | -144.14 | 5536.16 | -30598.7 |
Cowpea | -230.93 | 11.96 | 252.36 | -70.09 | 3.75 | -90.09 | -56.03 | -25.74 | -2.28 | 307.62 |
Rice | 480.71 | -82.89 | 1524.7 | -413.2 | -80.78 | -784.47 | 659.79 | 240.8 | 177.53 | -1622.2 |
Groundnut | 64.69 | -1.08 | 5.63 | -10.45 | 0.48 | 60.95 | -4.00 | -7’86 | -17.53 | 9.17 |
Adamawa State | ||||||||||
Maize | 3.03 | 0.57 | 2.79 | 34.22 | 0.08 | 25.29 | 1.41 | 18.34 | 13.25 | 0.99 |
Millet | 3.63 | 7.23 | 109.8 | -5.65 | -0.17 | 15.66 | -23.80 | -4.91 | 3.31 | -5.1 |
Sorghum | -37.72 | -1.34 | 264.97 | 24.63 | 0.06 | -173.79 | -6.03 | 8.03 | -23.88 | 45.08 |
Cowpea | 2.45 | 0.21 | 36.13 | 0.96 | 0.11 | -12.17 | 92.97 | 0.91 | -19.59 | -1.98 |
Rice | 8.39 | 7.48 | 170.12 | -9.49 | -0.05 | -39.27 | -8.29 | -4.77 | -7.67 | -16.46 |
Groundnut | - | - | - | - | - | - | - | - | - | - |
Yobe state | ||||||||||
Maize | 38.23 | 0.14 | 107.48 | -1.21 | -0.02 | -11.09 | -30.30 | -0.73 | -0.79 | -1.71 |
Millet | -69.94 | -6.65 | 22.23 | 19.81 | -0.09 | 28.03 | 1.08 | 2.38 | 2.37 | 100.6 |
Sorghum | -101.19 | -3.43 | -78.87 | 25.62 | 2.61 | 120.85 | 34.89 | 11.21 | -12.65 | 100.97 |
Cowpea | -1.88 | 25.50 | -6.09 | 32.42 | 0.05 | 47.97 | -3.46 | -6.27 | 5.97 | 5.78 |
Rice | -1.26 | 1.32 | 75.23 | 0.45 | 0.13 | 18.55 | -16.45 | 1.51 | 15.83 | 4.68 |
Groundnut | 4.43 | -11.11 | -0.17 | 145.15 | -0.89 | 2.81 | -0.86 | -51.74 | 2.93 | 0.45 |
BAY | Borno, Adamawa and Yobe States |
BH | Boko Haram |
CBN | Central Bank of Nigeria |
CII | Coppock’s Instability Index |
FAO | Food and Agriculture Organization |
FEWS NET | Famine Early Warning Systems Network |
GDP | Gross Domestic Product |
HA | Hectre |
ISIL | Islamic State of Iraq and Levant |
ISWAP | Islamic State’s West Africa Province |
KG | Kilogram |
LCB | Lake Chad Basin |
MOA | Ministry of Agriculture |
NAERLS | National Agricultural Extension and Research Liaison Services |
NBS | National Bureau of Statistics |
NiMet | Nigerian Meteorological Agency |
WFP | World Food Program |
| [1] | Samson, E. L. (2013). Re-thinking Counterinsurgency. MSc thesis submitted to European Peace University (EPU) Private Universität Stadtschlaining, Austria in Partial fulfillment of the requirement for a Master of Arts Degree in Peace and Conflict Studies. |
| [2] | Kimenyi Mwangi, Jideofor Adibe, Moussa Djiré, Abigail J. Jirgi, Alpha Kergna, Temesgen T. Deressa, Jessica E. Pugliese and Andrew Westbury, (2014). The Impact of Conflict and Political Instability on Agricultural Investments in Mali and Nigeria. Africa Growth Initiative Working Paper 17. |
| [3] | Taylor, H., David, K.. Bohl, M. R. & Jonathan, D. M. (2021). Assessing the Impact of Conflict on Development in North-East Nigeria. United Nation Development Program (UNDP). |
| [4] | Makfah, O. J. & Idahosa, S. O. (2021). The dilemma of recurrent insurgency the security situation in Nigeria: Boko Haram in perspective. 94(470): 127-139 |
| [5] | Solomon, T. A., (2018). The Behaviour and Evolution of Boko Haram: A Multi-Level Analysis Published PhD Thesis submitted to University of Lincoln, School of Social and Political Sciences, College of Social Science. |
| [6] | Onuoha, F. (2014). A Danger not to Nigeria alone-Boko Haram’s Transnational Reach And Regional Responses, Publish by: Friedrich-Ebert-Stiftung, Regional office Abuja 12 Marrakesh Street, Wuse II, Abuja, Nigeria. |
| [7] | Shuaibu, S. S., Salleh, M. A, & Shehu, A. Y. (2015). The Impact of Boko Haram Insurgency on Nigerian National Security. International Journal of Academic Research in Business and Social Sciences, 5(6), 254-266. |
| [8] | Ismail, H. & Murtala M, (2021). Boko Haram Terrorism and Restoration of Peace in Northeast, Nigeria: In Sunday A, NwaneRi, M and Ikechuku, M. U (edts) Africa and Emerging Trends in Global Politics: Festschrifts in honour of Rev. Fr. Dr. Tyomilia Juji. Pyla-Mak Publishers ltd. |
| [9] | Barkindo, A. A, (2017). History, Memory and Resistance in Northern Nigeria: The Transformation of Boko Haram. Published PhD Thesis submitted to Department of Politics and International Studies, SOAS, University of London. |
| [10] | Hansen, W. W., & Musa, U. A. (2013). Fanon, the wretched and Boko Haram. Journal of Asian and African studies, 48(3): 281-296. |
| [11] | Maiangwa, B., Uzodike, U. O., Whetho, A., & Onapajo, H. (2012). Baptism by fire: Boko Haram and the reign of terror in Nigeria. Africa Today, 59(2), 41-57. |
| [12] | IOM-DTM, (2022). IDP and Returnee Atlas Nigeria - North-East July 2022. |
| [13] | FAO, (2017). Nigeria at a Glance. Food and Agricultural Organisation, Rome. Available at |
| [14] | Adelaja, A. & George. J, (2019). Effects of Conflict on Agriculture: Evidence from the Boko Haram Insurgency. World Development 117: 184–95. |
| [15] | FAO and ICRISAT (2019). Climate-Smart Agriculture in Borno, Adamawa and Yobe States of Nigeria. CSA Country Profiles for Africa Series. International Center for Tropical Agriculture (CIAT); International Crops Research Institute for the Semi-Arid Tropics (ICRISAT); Food and Agriculture Organization of the United Nations (FAO). Rome, Italy. 22 p. |
| [16] | NBS, (2014). National Bureau of Statistics- Agriculture. |
| [17] | NBS, (2019). National Bureau of Statistics. Demographic Statistics Bulletin, 26 p. |
| [18] | FAO, (2016). Food security assessment in northeastern states of Nigeria. Food and Agriculture Organization, Rome. 64 Pp. |
| [19] | NBS, (2020). General Household Survey, Panel (GHS-Panel) 2015- 2016. Ref. NGA_2015_GHSP-W3_v02_M. |
| [20] | Eme, O. I., Onyishi, A. O., Uche, O. A., & Uche, I. B. (2014). Food insecurity in Nigeria: A thematic exposition. Arabian Journal of Business and Management Review, 4(1), 1–14. |
| [21] | World Bank, (2016). Northeast Nigeria: Recovery and Peace Building Assessment. Volume II Synthesis Report. |
| [22] | Van Den Hoek. J. (2017). Agricultural market activity and Boko Haram attacks in northeastern Nigeria, West African Papers, No. 09, Paris: OECD Publishing. Available at |
| [23] | Anjikwi, Y., Bashir A. B., Pilngwa, T. & Adamu AG, (2022). Assessment of the Effect of Boko Haram Insurgency on Crop Production in Hawul Local Government Area, Borno State, Nigeria. Journal of Agricultural Economics, Environment and Social Science 7(1): 266 – 277. |
| [24] | Tafida, A. A., Tukur, A. L., Adebayo, E. F., Ndaghu, A. A, (2023). Boko Haram insurgency and livelihood vulnerability of rural households in Northern Adamawa State, Nigeria. Research in Globalization 6 (2023) 100116 |
| [25] | Achumba, I. C., Akpan-Robero, M., & Ighomereho, O. S. (2013). Security challenges in Nigeria and the implications for business activities and sustainable development. Journal of Economics and Sustainable Development, 4(2), 79-99. |
| [26] | Blench, R, (2004). Natural resource conflicts in North-Central Nigeria: A handbook and Case studies. Cambridge: Mallam Dendo Ltd. |
| [27] | Kilcullen, D. (2006). Counter-Insurgency Redux, in: Survival: The IISS Quarterly, Vol. 48, No. 4, United Kingdom. |
| [28] | Sambanis, S & Collier, P, (2008). Understanding Civil War: Evidence and Analysis, Vol 1: Africa. Hernon VA, USA: World Bank. |
| [29] | Schmid, A. (2004). Terrorism – The Definitional Problem, 36 Case W. Res J. Int. 375(2004) |
| [30] | Kah, H. K. (2017). Boko Haram is losing, but so is food production: Conflict and food insecurity in Nigeria and Cameroon. Africa Development, 42(3), 177–196. |
| [31] | PCNI, (2016) Presidential Committee on the North east Initiatives: Rebuilding the North East -The Buhari Plan Volume I. Federal Government of Nigeria. |
| [32] | Foyou, V. E, Ngwafu, P., Santoyo, M. & Ortiz, A (2018). The Boko Haram Insurgency and its Impact on Border Security, Trade and Economic Collaboration between Nigeria and Cameroon: An Exploratory Study, African Social Science Review: Vol. 9(1): 66-77. |
| [33] |
GTI, (2015). Global Terrorism Index. Institute for Economics and Peace.
http://economicsandpeace.org/wpcontent/uploads/2015/11/Global-T |
| [34] | Adebisi, S. A., Azeez, O. O & Oyedeji, R, (2017). Appraising the effect of Boko Haram Insurgency on the Agricultural Sector of Nigeria Business Environment. Journal of Law and Governance, 11(1): 14-25. |
| [35] | Adewusi, O. A. & Jibril, K, (2022). Impact of Boko-Haram Insurgency on Agriculture in Adamawa State, International Journal of Education and Social Science Research (IJESSR) 5(5): 209-223 Article No. 678, Sub Id 875. |
| [36] | WFP, (2023). Nigeria 2023 Cropland change detention analysis: Analysis of satellite images on the dynamics of agricultural areas in difficult-to-access areas in 2023 |
| [37] | Dogo, A. N., Ibrahim, M. H., Ibrahim, M. B., Bukar, Z. S. & Ihsan, M. (2022). Assessment of Variation in Evaporation Rate as Evidences of Climate Change in Some Communities of Former Mega Chad, Borno State North East Nigeria. African Scholar Journal of Built Env. & Geological Research (JBEGR-4) Vol. 26(4): 215-222. |
| [38] | Ugonabo, O. J, Ernest, B. I & Alfa, A. (2023). Rainfall and sea-surface temperature analyses over Maiduguri, Nigeria using Mann-Kendall test. International Journal of Physical Sciences Vol. 18(2): 65-71 |
| [39] | NPC, (2006). National Population Commission- Population Census of the Federal Republic of Nigeria. Census Report, National Population Commission, Abuja. |
| [40] | Jamala, G., and Oke, D. O, (2013). Soil profile characteristics as affected by land use system in Southeastern Adamawa state, Nigeria. Journal of Agriculture and Veterinary Science 6(4): 4-11. |
| [41] | Ambrose, A. Z., Yarima, U. & Nankap, LB, (2018). Climatic information as evidence of desertification processes in Northern Yobe state, Nigeria: Implications for agriculture and ecosystem. Global Journal of Pure and Applied Sciences. Vol. 24: 117-124 |
| [42] | Acresal, (2023) Agro-Climatic Resillience in Semi-Arid landscape Yobe state |
| [43] | Umar, S. M, Suhasini, K., Jainuddin, S. M & Makama, S. A. (2019). Sources of Growth and Instability in Cassava Production in Nigeria: An evidence from Hazell’s Decomposition Model. SKUAST Journal of Research. Vol. 21(1): 86-95. |
| [44] | Hazell, PBR, (1984). Instability in Indian Foodgrains Production. Research Report No. 30, International Food Policy Research Institute, Washington D. C. |
| [45] | Huseyin, O, Behiye, T. C & Odebola, T. J. (2022). The Boko Haram Terrorism and Nigerian Economic Contraction. Arabian Journal of Business and Management Review (Kuwait Chapter). Vol. 8(4): 47-80. |
| [46] | Onwuaroh, A, (2017). Assessment of the Impact of Insurgency on Livelihoods of Farmers In Northeastern Nigeria A Ph.D. thesis submitted to the school of postgraduate studies, Ahmadu Bello University, Zaria, in partial fulfillment of the requirements for the award of the degree of Doctor of Philosophy in Rural Development. |
APA Style
Maiadua, U. S., Iliyasu, A., Janga, M. M., Auwal, S., Lawan, N. A., et al. (2025). The Boko Haram Insurgency and Its Effects on Crop Production in Northeast, Nigeria. International Journal of Agricultural Economics, 10(5), 255-270. https://doi.org/10.11648/j.ijae.20251005.15
ACS Style
Maiadua, U. S.; Iliyasu, A.; Janga, M. M.; Auwal, S.; Lawan, N. A., et al. The Boko Haram Insurgency and Its Effects on Crop Production in Northeast, Nigeria. Int. J. Agric. Econ. 2025, 10(5), 255-270. doi: 10.11648/j.ijae.20251005.15
@article{10.11648/j.ijae.20251005.15,
  author = {Umar Safiyanu Maiadua and Abdullahi Iliyasu and Madaki Musa Janga and Salisu Auwal and Ngoma Abubakar Lawan and Bulama Lawan and Sanusi Saheed Olakunle},
  title = {The Boko Haram Insurgency and Its Effects on Crop Production in Northeast, Nigeria
},
  journal = {International Journal of Agricultural Economics},
  volume = {10},
  number = {5},
  pages = {255-270},
  doi = {10.11648/j.ijae.20251005.15},
  url = {https://doi.org/10.11648/j.ijae.20251005.15},
  eprint = {https://article.sciencepublishinggroup.com/pdf/10.11648.j.ijae.20251005.15},
  abstract = {The study examined the impacts of Boko Haram (BH) insurgency on output of crops in Borno, Adamawa and Yobe (BAY) states, Northeast, Nigeria. Time Series data from 1999-2023 was used which was sub divided into 1999-2008 (Period before Boko Haram), 2009-2017 (Period during the peak of Boko Haram) and 2020-2023 as current period. Percentage change, Instability Index and Hazell Decomposition models were used to determined changes, variability and its sources in area, production and productivity of major staple crops (Maize, Millet, Sorghum, Cowpea and Rice) in the study area. The results revealed that, millet recorded the highest decrease in area between period before BH and during the peak period of the insurgent’s activities. Decrease in yield was noticed in all the states and was higher in sorghum, millet and cowpea, so does instability in area, production and productivity of the crops during the period of the insurgency. Similarly sources of change in average of production were majorly as a result of change in mean yield and change in mean area. The findings implied that, farmers has abandoned their farm lands for fear of attacks during the BH period and that poor management practices and inaccessibility to inputs resulted in low yield of crops, The study recommends employing all measures that would in the short and long run increase yield of crops and ‘returnees’ should be giving adequate attention to go back to active farming.
},
 year = {2025}
}
TY  - JOUR
T1  - The Boko Haram Insurgency and Its Effects on Crop Production in Northeast, Nigeria

AU  - Umar Safiyanu Maiadua
AU  - Abdullahi Iliyasu
AU  - Madaki Musa Janga
AU  - Salisu Auwal
AU  - Ngoma Abubakar Lawan
AU  - Bulama Lawan
AU  - Sanusi Saheed Olakunle
Y1  - 2025/09/26
PY  - 2025
N1  - https://doi.org/10.11648/j.ijae.20251005.15
DO  - 10.11648/j.ijae.20251005.15
T2  - International Journal of Agricultural Economics
JF  - International Journal of Agricultural Economics
JO  - International Journal of Agricultural Economics
SP  - 255
EP  - 270
PB  - Science Publishing Group
SN  - 2575-3843
UR  - https://doi.org/10.11648/j.ijae.20251005.15
AB  - The study examined the impacts of Boko Haram (BH) insurgency on output of crops in Borno, Adamawa and Yobe (BAY) states, Northeast, Nigeria. Time Series data from 1999-2023 was used which was sub divided into 1999-2008 (Period before Boko Haram), 2009-2017 (Period during the peak of Boko Haram) and 2020-2023 as current period. Percentage change, Instability Index and Hazell Decomposition models were used to determined changes, variability and its sources in area, production and productivity of major staple crops (Maize, Millet, Sorghum, Cowpea and Rice) in the study area. The results revealed that, millet recorded the highest decrease in area between period before BH and during the peak period of the insurgent’s activities. Decrease in yield was noticed in all the states and was higher in sorghum, millet and cowpea, so does instability in area, production and productivity of the crops during the period of the insurgency. Similarly sources of change in average of production were majorly as a result of change in mean yield and change in mean area. The findings implied that, farmers has abandoned their farm lands for fear of attacks during the BH period and that poor management practices and inaccessibility to inputs resulted in low yield of crops, The study recommends employing all measures that would in the short and long run increase yield of crops and ‘returnees’ should be giving adequate attention to go back to active farming.

VL  - 10
IS  - 5
ER  -
Department of Agricultural Economics and Extension, Federal University, Gashua, Nigeria
Department of Economics, American University of Nigeria, Yola, Nigeria
Department of Agricultural Economics and Extension, Federal University, Gashua, Nigeria
Department of Islamic Studies, Federal University, Gashua, Nigeria
Department of Economics and Developmental Studies, Federal University, Gashua, Nigeria
Department of Geography, Federal University, Gashua, Nigeria
Department of Agricultural Economics and Extension, Federal University, Gashua, Nigeria
Information