This research assesses long-term trends in Jama District, South Wollo Zone, Ethiopia, of temperature and precipitation extremes using daily meteorological data (1981-2020) from Ethiopian Meteorology Institute (EMI). A total of 22 climate extreme indices—12 are for temperature and 10 are for precipitation—were computed following Expert Team on Climate Change Detection and Indices (ETCCDI) recommendations. The non-parametric Mann-Kendall test and Sen's slope estimator were applied to identify trends. Results show a statistically significant warming trend for several indices: rising hot days (SU25) by 3.936 days/year (p < 0.001), warm nights (TN90p) by 0.538 days/year (p = 0.001), and warm days (TX90p) by 0.597 days/year (p = 0.008). In contrast, cool nights (TN10p), cool days (TX10p), and cold spell duration (CSDI) decreased significantly by −0.541, −0.384, and −0.098 days/year, respectively (all p < 0.05), indicative of a sharp shift towards heat extremes. Precipitation indices were in overall positive but statistically not significant trends. Wet-day precipitation throughout the year (PRCPTOT) rose by 2.999 mm/year (p = 0.224), while heavy rainfall days (R10 and R20) rose by 0.170 and 0.076 days/year, respectively. Rainfall intensity (SDII) rose slightly by 0.027 mm/day/year. Extreme rainfall amounts (RX1day, RX5day) and wet/dry spell lengths (CWD, CDD) saw no changes. These findings confirm a clear warming signal and moderate rainfall variability, with important implications for agriculture, water resources, and climate adaptation planning in this vulnerable highland region.
| Published in | International Journal of Energy and Environmental Science (Volume 10, Issue 4) |
| DOI | 10.11648/j.ijees.20251004.14 |
| Page(s) | 92-102 |
| Creative Commons |
This is an Open Access article, distributed under the terms of the Creative Commons Attribution 4.0 International License (http://creativecommons.org/licenses/by/4.0/), which permits unrestricted use, distribution and reproduction in any medium or format, provided the original work is properly cited. |
| Copyright |
Copyright © The Author(s), 2025. Published by Science Publishing Group |
Climate Extremes Indices, Rainfall, Temperature, CDO, Mann-Kendall Test, Jama, South Wollo, Ethiopia
Index | Description | Definition | Units |
|---|---|---|---|
PRCPTOT | Wet day precipitation | Annual total precipitation from wet days (> 1 mm) | mm |
R95p | Very wet days | Annual total PRCP when RR > 95th percentile | mm |
R99p | Extremely wet days | Annual total PRCP when RR > 99th percentile | mm |
R10 | Number of heavy precipitation days | Annual count of days when PRCP ≥ 10 mm | days |
R20 | Very heavy precipitation | Annual count of days when PR ≥ 20 mm | Days |
SDII | Simple daily intensity index | Annual total precipitation divided by the number of wet days (defined as PR ≥ 1.0 mm) in the year | mm per day |
CDD | Consecutive dry days | Maximum number of consecutive days with RR < 1 mm | Days |
CWD | Consecutive wet days | Maximum number of consecutive days with RR ≥ 1 mm | Days |
RX1day | Max 1-day precipitation amount | Monthly maximum 1-day precipitation | mm |
Rx5day | Max 5-day precipitation amount | Monthly maximum 5-day precipitation | mm |
Index | Description | Definition | Units |
|---|---|---|---|
SU25 | Hot days | Annual count when TX>25℃ | Days |
TN10p | Cool nights | Percentage of days when TN < 10th percentile | Days |
TX10p | Cool days | Percentage of days when TX < 10th percentile | Days |
TN90p | Warm night | Percentage of days when TN > 90th percentile | Days |
TX90p | Warm days | Percentage of days when TX > 90th percentile | Days |
WSDI | Warm spell duration indicator | Annual count of days with at least 6 consecutive days when TX > 90th percentile | Days |
CSDI | Cold spell duration indicator | Annual count of days with at least 6 consecutive days when TN < 10th percentile | Days |
DTR | Diurnal temperature range | Monthly mean difference between TX and TN | ˚C |
TXn | Min Tmax | Monthly minimum value of daily maximum temperature | ˚C |
TXx | Max Tmax | Monthly maximum value of daily maximum temperature | ˚C |
TNn | Min Tmin | Monthly minimum value of daily minimum temperature | ˚C |
TNx | Max Tmin | Monthly maximum value of daily minimum temperature | ˚C |
Index | Description | Units | Slope | P-Value |
|---|---|---|---|---|
PRCPTOT | Wet day precipitation | mm | 2.999 | 0.224 |
R95p | Very wet days | mm | 0.493 | 0.777 |
R99p | Extremely wet days | mm | -0.207 | 0.783 |
R10 | Number of heavy precipitation days | days | 0.170 | 0.157 |
R20 | Very heavy precipitation | Days | 0.076 | 0.347 |
SDII | Simple daily intensity index | mm per day | 0.027 | 0.349 |
CDD | Consecutive dry days | Days | 0.206 | 0.449 |
CWD | Consecutive wet days | Days | 0.129 | 0.363 |
RX1day | Max 1-day precipitation amount | mm | 0.076 | 0.632 |
Rx5day | Max 5-day precipitation amount | mm | 0.133 | 0.821 |
Index | Description | Units | Slope | P-Value |
|---|---|---|---|---|
SU25 | Hot days | Days | 3.936 | 0.000 |
TN10p | Cool nights | Days | -0.541 | 0.030 |
TX10p | Cool days | Days | -0.384 | 0.000 |
TN90p | Warm night | Days | 0.538 | 0.001 |
TX90p | Warm days | Days | 0.597 | 0.008 |
WSDI | Warm spell duration indicator | Days | 0.019 | 0.433 |
CSDI | Cold spell duration indicator | Days | -0.098 | 0.039 |
DTR | Diurnal temperature range | ˚C | -0.008 | 0.750 |
TXn | Min Tmax | ˚C | 0.053 | 0.064 |
TXx | Max Tmax | ˚C | 0.096 | 0.024 |
TNn | Min Tmin | ˚C | 0.087 | 0.006 |
TNx | Max Tmin | ˚C | 0.043 | 0.388 |
CDD | Consecutive Dry Days |
CDT | Climate Data Tool |
CSDI | Cold Spell Duration Indicator |
CWD | Consecutive Wet Days |
DTR | Diurnal Temperature Range |
EMI | Ethiopian Meteorology Institute |
ENACT | Enhancing National Climate Service |
ETCCDI | Expert Team on Climate Change Detection and Indices |
IPCC | Intergovernmental Panel on Climate Change |
MK | Mann-Kendall |
PRCPTOT | Precipitation Total |
SDII | Simple Daily Intensity Index |
WSDI | Warm Spell Duration Indicator |
| [1] | Alexander, L., & Herold, N. (2016). ClimPACT2: Indices and software. |
| [2] | Ali Mohammed, J., Gashaw, T., Worku Tefera, G., Dile, Y. T., Worqlul, A. W., & Addisu, S. (2022). Changes in observed rainfall and temperature extremes in the Upper Blue NileBasin of Ethiopia. Weather and Climate Extremes, 37(June), 100468. |
| [3] | Asfaw, A., Simane, B., Hassen, A., & Bantider, A. (2018). Variability and time series trend analysis of rainfall and temperature in northcentral Ethiopia: A case study in Woleka sub-basin. Weather and Climate Extremes, 19, 29-41. |
| [4] | Endris, H. S., Omondi, P., Jain, S., Lennard, C., Hewitson, B., Chang’a, L., Awange, J. L., Dosio, A., Ketiem, P., & Nikulin, G. (2013). Assessment of the performance of CORDEX regional climate models in simulating East African rainfall. Journal of Climate, 26(21), 8453-8475. |
| [5] | Garba, H., & Udokpoh, U. U. (2023). Analysis of trend in meteorological and hydrological time-series using Mann-Kendall and Sen’s slope estimator statistical test in Akwa Ibom state, Nigeria. International Journal of Environment and Climate Change, 13(10), 1017-1035. |
| [6] | Gebrechorkos, S. H., Hülsmann, S., & Bernhofer, C. (2019). Regional climate projections for impact assessment studies in East Africa. Environmental Research Letters, 14(4). |
| [7] | Hailu, D., Woldetsadik, M., & Ayal, D. Y. (2025). Changes in extreme rainfall indices in Wereilu district, northeastern Ethiopian highlands, using innovative trend analysis. Discover Applied Sciences, 7(3). |
| [8] | Intergovernmental Panel on Climate Change (IPCC). (2023). Climate Change 2021 - The Physical Science Basis. In Climate Change 2021 - The Physical Science Basis. |
| [9] | Jury, M. R. (2011). Long-term variability and trends in the Caribbean Sea. International Journal of Oceanography, 2011(1), 465810. |
| [10] | Karl, D. M. (1999). A sea of change: biogeochemical variability in the North Pacific Subtropical Gyre. Ecosystems, 2, 181-214. |
| [11] | Kassie, B. T. (2014). Climate variability and change in Ethiopia: Exploring impacts and adaptation options for cereal production. Wageningen University and Research. |
| [12] | Kendall, K. (1975). Thin-film peeling-the elastic term. Journal of Physics D: Applied Physics, 8(13), 1449. |
| [13] | Mann, H. B. (1945). Nonparametric tests against trend. Econometrica: Journal of the Econometric Society, 245-259. |
| [14] | MEKONNEN, et al. (2024). Trends in rainfall and temperature extremes during 1954-2019 in Addis Ababa, Ethiopia. Journal of Agrometeorology, 6(1), 5-9. |
| [15] | Mekonnen, E. F., Assefa, M. A., & Ayele, A. G. (2024). Trends of Extreme Temperature and Rainfall Indices for Addis Ababa City, Ethiopia. Journal of Environmental Science and Agricultural Research. |
| [16] | Mengistu, D., Bewket, W., Dosio, A., & Panitz, H.-J. (2021). Climate change impacts on water resources in the upper blue nile (Abay) river basin, ethiopia. Journal of Hydrology, 592, 125614. |
| [17] | Meressa, A. M., & Bantie, L. (2024). The impacts of climate change on peasant’s crop production in major crop producing zones in Ethiopia. Discover Sustainability, 5(1). |
| [18] | Mewded, M., Abebe, A., Tilahun, S., & Agide, Z. (2022). Climate variability and trends in the Endorheic Lake Hayk basin: implications for Lake Hayk water level changes in the lake basin, Ethiopia. Environmental Systems Research, 11(1), 1-17. |
| [19] | Moges, D. M., & Bhat, H. G. (2021). Climate change and its implications for rainfed agriculture in Ethiopia. Journal of Water and Climate Change, 12(4), 1229-1244. |
| [20] | Peterson, A. T., Sánchez-Cordero, V., Soberón, J., Bartley, J., Buddemeier, R. W., & Navarro-Sigüenza, A. G. (2001). Effects of global climate change on geographic distributions of Mexican Cracidae. Ecological Modelling, 144(1), 21-30. |
| [21] | Pyrgou, A., Santamouris, M., & Livada, I. (2019). Spatiotemporal analysis of diurnal temperature range: Effect of urbanization, cloud cover, solar radiation, and precipitation. Climate, 7(7), 1-13. |
| [22] | Seleshi, Y., & Camberlin, P. (2006). Recent changes in dry spell and extreme rainfall events in Ethiopia. Theoretical and Applied Climatology, 83, 181-191. |
| [23] | Sen, P. K. (1968). Estimates of the Regression Coefficient Based on Kendall’s Tau. Journal of the American Statistical Association, 63(324), 1379-1389. |
| [24] | Siabi, E. K., Awafo, E. A., Kabo-bah, A. T., Derkyi, N. S. A., Akpoti, K., Mortey, E. M., & Yazdanie, M. (2023). Assessment of Shared Socioeconomic Pathway (SSP) climate scenarios and its impacts on the Greater Accra region. Urban Climate, 49. |
| [25] | Tashebo, G. B. (2022). Analysis of Trend in Extreme Temperature and Rainfall over Addis Ababa City, Analysis of Trend in Extreme Temperature and Rainfall over Addis Ababa City, the Case of Bole Meteorological Station Gezahegn Bekele Tashebo. July. |
| [26] | Tashebo, G. B., & Mekonnen, E. F. (2021). Trends in Daily Temperature and Precipitation Extremes over Dire-Dawa, 1980-2018. Journal of Environment and Earth Science, October, 5-12. |
APA Style
Wasihun, E. W. (2025). Evidence of Warming and Rainfall Variability in a Highland Region of Ethiopia: Climate Extremes in Jama District (1981 to 2020). International Journal of Energy and Environmental Science, 10(4), 92-102. https://doi.org/10.11648/j.ijees.20251004.14
ACS Style
Wasihun, E. W. Evidence of Warming and Rainfall Variability in a Highland Region of Ethiopia: Climate Extremes in Jama District (1981 to 2020). Int. J. Energy Environ. Sci. 2025, 10(4), 92-102. doi: 10.11648/j.ijees.20251004.14
@article{10.11648/j.ijees.20251004.14,
  author = {Endalamaw Wende Wasihun},
  title = {Evidence of Warming and Rainfall Variability in a Highland Region of Ethiopia: Climate Extremes in Jama District (1981 to 2020)
},
  journal = {International Journal of Energy and Environmental Science},
  volume = {10},
  number = {4},
  pages = {92-102},
  doi = {10.11648/j.ijees.20251004.14},
  url = {https://doi.org/10.11648/j.ijees.20251004.14},
  eprint = {https://article.sciencepublishinggroup.com/pdf/10.11648.j.ijees.20251004.14},
  abstract = {This research assesses long-term trends in Jama District, South Wollo Zone, Ethiopia, of temperature and precipitation extremes using daily meteorological data (1981-2020) from Ethiopian Meteorology Institute (EMI). A total of 22 climate extreme indices—12 are for temperature and 10 are for precipitation—were computed following Expert Team on Climate Change Detection and Indices (ETCCDI) recommendations. The non-parametric Mann-Kendall test and Sen's slope estimator were applied to identify trends. Results show a statistically significant warming trend for several indices: rising hot days (SU25) by 3.936 days/year (p < 0.001), warm nights (TN90p) by 0.538 days/year (p = 0.001), and warm days (TX90p) by 0.597 days/year (p = 0.008). In contrast, cool nights (TN10p), cool days (TX10p), and cold spell duration (CSDI) decreased significantly by −0.541, −0.384, and −0.098 days/year, respectively (all p < 0.05), indicative of a sharp shift towards heat extremes. Precipitation indices were in overall positive but statistically not significant trends. Wet-day precipitation throughout the year (PRCPTOT) rose by 2.999 mm/year (p = 0.224), while heavy rainfall days (R10 and R20) rose by 0.170 and 0.076 days/year, respectively. Rainfall intensity (SDII) rose slightly by 0.027 mm/day/year. Extreme rainfall amounts (RX1day, RX5day) and wet/dry spell lengths (CWD, CDD) saw no changes. These findings confirm a clear warming signal and moderate rainfall variability, with important implications for agriculture, water resources, and climate adaptation planning in this vulnerable highland region.},
 year = {2025}
}
TY  - JOUR
T1  - Evidence of Warming and Rainfall Variability in a Highland Region of Ethiopia: Climate Extremes in Jama District (1981 to 2020)

AU  - Endalamaw Wende Wasihun
Y1  - 2025/08/08
PY  - 2025
N1  - https://doi.org/10.11648/j.ijees.20251004.14
DO  - 10.11648/j.ijees.20251004.14
T2  - International Journal of Energy and Environmental Science
JF  - International Journal of Energy and Environmental Science
JO  - International Journal of Energy and Environmental Science
SP  - 92
EP  - 102
PB  - Science Publishing Group
SN  - 2578-9546
UR  - https://doi.org/10.11648/j.ijees.20251004.14
AB  - This research assesses long-term trends in Jama District, South Wollo Zone, Ethiopia, of temperature and precipitation extremes using daily meteorological data (1981-2020) from Ethiopian Meteorology Institute (EMI). A total of 22 climate extreme indices—12 are for temperature and 10 are for precipitation—were computed following Expert Team on Climate Change Detection and Indices (ETCCDI) recommendations. The non-parametric Mann-Kendall test and Sen's slope estimator were applied to identify trends. Results show a statistically significant warming trend for several indices: rising hot days (SU25) by 3.936 days/year (p < 0.001), warm nights (TN90p) by 0.538 days/year (p = 0.001), and warm days (TX90p) by 0.597 days/year (p = 0.008). In contrast, cool nights (TN10p), cool days (TX10p), and cold spell duration (CSDI) decreased significantly by −0.541, −0.384, and −0.098 days/year, respectively (all p < 0.05), indicative of a sharp shift towards heat extremes. Precipitation indices were in overall positive but statistically not significant trends. Wet-day precipitation throughout the year (PRCPTOT) rose by 2.999 mm/year (p = 0.224), while heavy rainfall days (R10 and R20) rose by 0.170 and 0.076 days/year, respectively. Rainfall intensity (SDII) rose slightly by 0.027 mm/day/year. Extreme rainfall amounts (RX1day, RX5day) and wet/dry spell lengths (CWD, CDD) saw no changes. These findings confirm a clear warming signal and moderate rainfall variability, with important implications for agriculture, water resources, and climate adaptation planning in this vulnerable highland region.
VL  - 10
IS  - 4
ER  -
Development Meteorology, Ethiopian Meteorology Institute, Kombolcha, Ethiopia
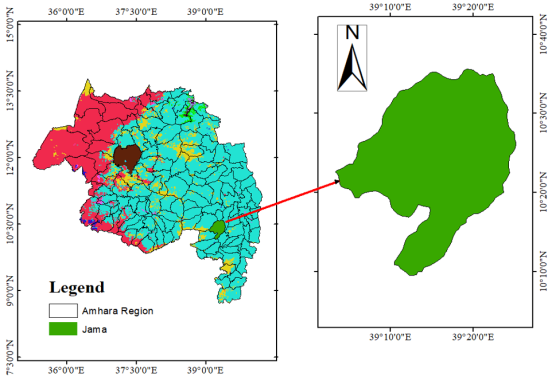
Figure 1. Map of the study area.
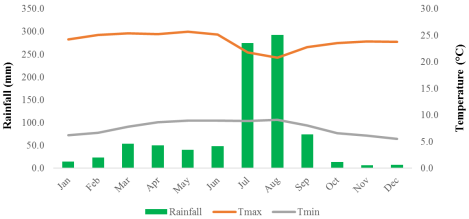
Figure 2. Long-term average monthly rainfall, maximum temperature (Tmax), and minimum temperature (Tmin) of Jama.
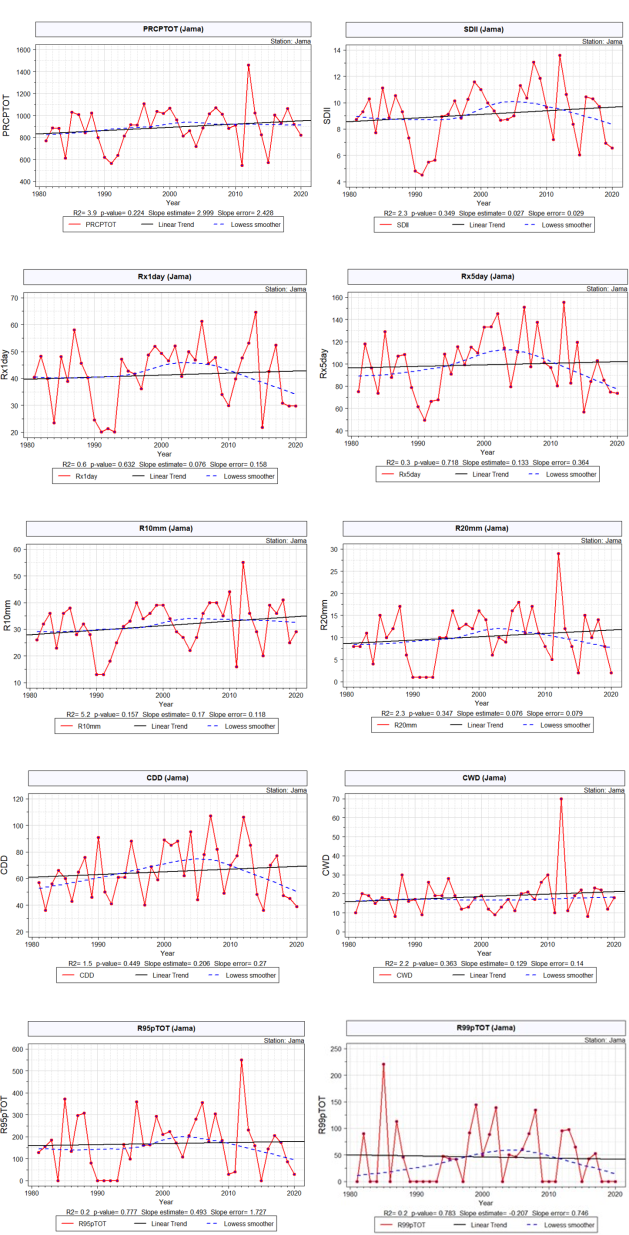
Figure 3. Average annual trends of extreme precipitation indices for PRCPTOT, SDII, Rx1day, Rx5day, R10mm, R20mm, CDD, CWD, R95p, and R99p from 1981 to 2020.
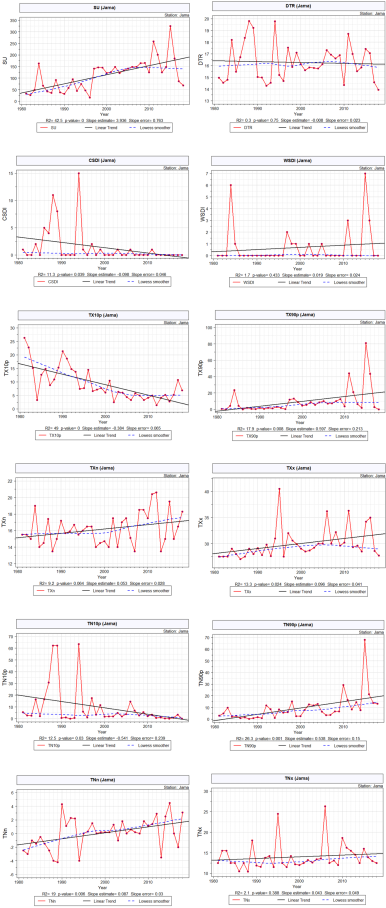
Figure 4. Average annual trends of extreme temperature indices for SU, DTR, CSDI, WSDI, TX10p, TX90p, TXn, TXx, TN10p, TN90p, TNn and TNx from 1981 to 2020.
Information

