2. Materials and Methodes
2.1. Materials
The study involved beneficiaries of power as witnesses to acts of vandalism, chosen for structured interviews using a stratified sampling technique
| [25] | Rahman, M. M., Tabash, M. I., Salamzadeh, A., Abdul, S. & Rahaman, S. (2022). Sampling Techniques (Probability) for Quantitative Social Science Researchers: A Conceptual Guidelines with Examples. South East European University Journal. Vol. 17 Issue 1, pp. 41-51. |
[25]
from wards of Moivo and Sokoni II wards. Elerai, Endamarariek, Namanga, Olasit, Sokoni I, Sombetini, Maji ya Chai, Usariver, Monduli Juu, and Sepeko were involved for field observations testing, and measuring parameters. 242 utility employees were involved in questionnaire using purposive sampling
| [15] | Kothari, C. R. (2014). Research Methodology and Techniques (3rd Edition). New Delhi: NewAge International. |
[15]
from Arusha regional office and districts of Karatu, Usariver, Monduli, Longido, Ngorongoro, Muriet and Mererani. Specimens for experiments included 4 species of plants, 4 types of soils, 3 water bodies, MV lines (4 km), transformers (9) of sizes ranging from 50 kVA to 500 kVA, mineral oils from transformers, land surface places (9) and consumer load tariffs (T0 and T1) (4). Experiments included various samples of mineral oils from places of defective power distribution transformers, plants, soils and waters as shown in
Table 2.
Table 2.
Matrix summary of samples for field and laboratory observations. Ward | Sample | Total |
| MV line km | Transformers | T0 | T1 | |
Elerai | 4 | 4 | 4 | 4 | 16 |
Endamarariek | 4 | 4 | 4 | 4 | 16 |
Moivo | 0 | 4 | 0 | 0 | 4 |
Namanga | 4 | 4 | 4 | 4 | 16 |
Olasit | 4 | 4 | 4 | 4 | 16 |
Sokoni I | 4 | 4 | 4 | 4 | 16 |
Sokoni II | 0 | 5 | 0 | 0 | 5 |
Sombetini | 4 | 4 | 4 | 4 | 16 |
Total | 24 | 33 | 24 | 24 | 105 |
| Oils/places | Plants | Soils | Waters | |
Maji ya Chai | 4 | 4 | 4 | 3 | 15 |
Moivo | 4 | 0 | 0 | 0 | 4 |
Monduli Juu | 4 | 4 | 4 | 3 | 15 |
Sepeko | 4 | 4 | 4 | 3 | 15 |
Sokoni II | 5 | 0 | 0 | 0 | 5 |
Usariver | 4 | 4 | 4 | 3 | 15 |
Total | 25 | 16 | 16 | 12 | 69 |
2.2. Methodes
The study focused on the assessment of transformer failure through diagnostic testing, internal inspections, teardown inspections and failure analysis
| [10] | Jaspreet, S. & Sanjeev, S. (2016). Transformer Failure Analysis: Reasons and Methods: Punjab State Power Corporation Ltd, Moga & Longowal, India. International Journal of Engineering Research & Technology, Vol. 4 Issue 15, pp. 1-5. |
[10].
Three basic assumptions were made before regression modelling of distribution transformer internal and external failure related causes of land oil spills to calculate the combined energy loss that would be served from
PE,
PO and
PV and load currents
IE,
IO and
IV, respectively as follows:
1) Load current (IE) found between overload and nominal values
2) Overload currents (IO) found greater than nominal values
3) Vandalism currents (IV) found equal to nominal values
To achieve mitigating measures based on load currents:
Equation (
1) was modified to calculate individual variables
PE, PO and
PV as follow:
PE = Energy loss due to MV line parts failures PO = Energy lost due to overloads
PV = Energy lost due to vandalism
NE = Number of defective transformers due to external parts
NO = Number of defective transformers due to overloads
NV = Number of defective transformers due to vandalism
IE = Load currents due to MV line parts failures
IO = Load currents due to overloads
IV = Load currents due to vandalism
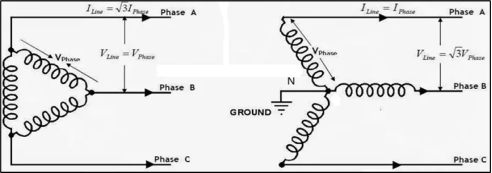
√3 = 1.732 for 3-phase distribution transformers
Cosθ = Industrial standard Power Factor 0.8
Equations (
2)-(
4) applied in three-phase balanced systems for real power may be A phase current, B phase current or C phase current as in
Figure 2.
The slope (S) of the land over which distribution systems are installed is denoted as S that increases as the land surface becomes more inclined, as stated by
| [7] | Farrar, W. Galagan, C. Isaji, T. & Knee, K. (2014). GIS Technology Applied to Modeling Oil Spills on Land.
proceedings.esri.com/library/userconf/proc05/papers/pap2129.pdf retrieved on 01/01/2021. |
[7]
. In the process, the (x, y) coordinates indicated the degree to which the oil spills spread across the inclined land surfaces and descended onto the ground. Following geometric principles, measuring the x and y axes from the coordinates (0, 0) to (x, y) determines the slope S. The magnitude of S differed based on the characteristics of the terrain or topography. Mathematical representation of S resembles the gradient of linear algebra (Equation (
5)).
s = Slope y = Vertical axis x = Horizontal axis
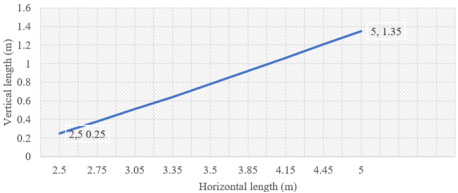
The modality to obtain S in Equation (
1) is used to get the horizontal lengths from the position of the oil leaked transformer as zero or reference point (0,0) using a tape measure to as far as the destination of the oil spill (x, y). The horizontal lengths were x coordinates (abscissa), while the vertical lengths were y coordinates (ordinates) measured from the ground level upward to the equilibrium point of the level meter, where the oil spill terminated as displayed in
Figure 3.
The
S variables computed from each oil spill place referred to velocities of the travelling oil spills on slopes sampled from different places, indicating the data for the x and y coordinates and the corresponding
S. Using the values of S, the values of
V were computed from Equation (
6) for regression analysis of the soil-based model
| [7] | Farrar, W. Galagan, C. Isaji, T. & Knee, K. (2014). GIS Technology Applied to Modeling Oil Spills on Land.
proceedings.esri.com/library/userconf/proc05/papers/pap2129.pdf retrieved on 01/01/2021. |
[7].
Data
with oil spill lengths and velocities of oil spills could be used to compute the time the oil spills travelled to the destinations Equation (
7)
| [19] | Marija, E. (2019). A Comprehensive Planning Framework for Urban Inland Oil Spill Management (PhD Dissertation). Ryerson University Toronto, Ontario, Canada. |
[19]
.
Computation of S for individual oil spills was referred to as Equation (
5) where x is the oil spill length denoted as
L and
Y the vertical displacement from where the oil spill terminates.
Substituting Equation (
8) into Equation (
6) gives:
Equation (
9) was used as a tool for oil spill management to generate a regression analysis model from Analysis of Variance (ANOVA). The Velocity of an oil spill from Equation (
9) was used to develop (Equation (
10)).
(10)
V = velocity of the travelling oil spill, ß0 = Intercept ß = Regression coefficient, Y = Vertical length at oil spill terminal and L = Horizontal length of oil spill.
Proper selection of x and y coordinates may decide the speed and the spread of oil spills. The study seeks to develop a regression model as a tool for the ground on which the distribution transformer is positioned to zero the oil spill height (Y) within the MV line corridors The ground on which the distribution transformer is to be mounted requires careful selection of the type of soil. This chapter describes clay, gravel, sand, and silt soils, the suitable soil should allow for the effective implementation of the model. When mixed with water and cement in a good ratio, its particles must make a block of concrete that effectively fills the pore spaces to hinder penetration of oil spills underground.
3. Results and Discussion
3.1. Power Distribution Systems
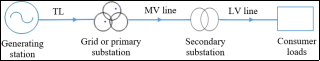
Power distribution system is the final stage in the delivery of electric power carrying electricity from the transmission system to individual consumers. Distribution substations connect to the transmission system and lower the transmission voltage to medium voltage
| [36] | Tanwar, K. S. & Choubisa, V. (2017). An Overview of Electrical Power Distribution. International Journal of Technical Research & Science (Special Issue), pp. 4-9. |
[36].
Assessment of power distribution systems focused on construction practices, maintenance strategies and vandalism cases to identify anomalies posing land oil spills.
3.1.1. Construction Practices
Karatu district has one two MV line with route lengths exceeding the recommended 200 km
| [34] | TANESCO. (2024). Engineering Instruction and Construction manuals, Vol 9 Issue 3, pp. 1-155. |
[34]
and many secondary substations. A 33 kV Manyara line (343.10 km) that supplies the Karatu district and a portion of Monduli district has 115 secondary substations, and a 33 kV Ngorongoro line (238.14 km) that supplies Karatu and Ngorongoro district has 71 secondary substations
| [35] | TANESCO. (2023). Report of Board of Directors and the Financial Statements, AR/PA/TANESCO/2022/23, pp. 1-203. |
[35]
. Wooden poles from eucalyptus and pine trees used in power distribution systems are treated using CCA
| [31] | Singh, T. & Page, D. (2016). CCA Treated Wood, Will It Last 100 Years? 47th Annual Meeting of International Research Group on Wood Protection, Lisbon-Portugal. Proceedings of Annual Meeting (IRG/WP 16-20575). |
[31]
or creosote
| [32] | Smith, S. T., (2023). Coal Tar Distillate (Creosote)—The First and Still Great Choice to Preserve Utility Poles. Forest Products Journal, Vol 73 Issue 1, pp. 1-5.
https://doi.org/10.13073/2376-9637-73.1.1 |
[32]
to stay longer in the field without rotting as the preservatives protect the wood against various attacks like fungus, wood borers and other insects and the worst effects of weathering. The overall measurements of the Copper Chrome Arsenic (CCA) and creosote retention by X-ray Photoelectron Spectroscopy and vernier calliper indicated deviation of the readings from the accepted specs to signal that CCA and creosote preservatives were insufficient. Further, some wooden poles indicated that the plants were prematurely harvested. Insufficient preservative treatment and premature tree harvesting have contributed to the quick rotting of the wooden poles found at secondary substations, leading to fallen transformers, broken High Voltage (HV) and LV bushings, and oil spills. The construction of MV lines include horizontal, triangular and vertical overhead conductor styles. The construction manual requires that conductors be equally spaced from 3ʹ11ʺ to 4ʹ3ʺ for 33 kV power distribution lines to enhance a balanced power system
| [34] | TANESCO. (2024). Engineering Instruction and Construction manuals, Vol 9 Issue 3, pp. 1-155. |
[34].
Taking note of the recommended spacing of MV line conductors for 33 kV lines in the construction manual, it was observed that the 7ʹ length of the galvanized steel cross-arm commonly applied mathematically disagrees with reality. The calculation indicated that for the galvanized steel cross-arm having a length of 7ʹ for 33kV lines, the actual spacing between conductors is nearing 3ʹ 2ʺ instead of 3ʹ11ʺ. Suppose the spacing was intended to avoid the possible overcurrent due to induced emf between conductors. Another observation was unequal spacing between line conductors. The middle conductor for horizontal style was not fixed at the centre of the two outer conductors between successive spans as required during the implementation of previous projects. In such case, one of the causes for the failure of distribution transformers is the narrow line spacing between conductors due to the application of short galvanized cross-arms or unequal line spacing between conductors. This could superimpose emf induction between conductors and cause a severe overcurrent in adjacent phases, especially at peak load. The overcurrent is likely to stress the transformer windings, generate excessive heat with gases released pushing out the gaskets and allowing oil to penetrate outside the transformer tanks.
Based on the rotating ellipsoid method and mean potential method regarding the calculation of single and multiple rods earthing resistance in one-layer soil types
| [17] | Malanda, S. C., Davidson, I. E., Clemson, E. B. & Singh, E. (2018). Analysis of Soil Resistivity and its Impact on Grounding Systems Design. Conference Paper, Cape Town South Africa, pp. 1-7.
https://doi.org/10.1109/PowerAfrica.2018.8520960 |
[17]
, tests from recently commissioned projects with four secondary substations at Wards of Endabash and Endamarariek indicated to have an insufficient earthing system to the distribution transformers, whereby earth resistance measurements to depth of 1m in different soil types had resistance above 120 Ω on MV and 30 Ω on LV side (sandy soil) during dry season as in
Table 3 instead of the all-time recommended 7.5 Ω and 2.5 Ω respectively
| [34] | TANESCO. (2024). Engineering Instruction and Construction manuals, Vol 9 Issue 3, pp. 1-155. |
[34].
The substandard earthing system leads to power distribution transformers being easily struck by lightning; hence the occurrence of oil spills as found at various secondary substations.
Table 3.
Measurements of earthing resistance values at various soil types. Soil type | Ward | Voltage (kV) | Transformer (kVA) | Earthing resistance (Ω) |
MV side | LV side |
Clay | Endabash | 33 | 100 | 150.23 | 33.13 |
Gravel | 33 | 100 | 130.26 | 36.14 |
Sandy | Endamarariek | 33 | 100 | 142.22 | 47.20 |
Silt | 33 | 100 | 100.10 | 50.15 |
Some span lengths are incredibly long. As such, the sag towards the ground between two successive poles is lower than recommended. Results from at least four spans measured along the MV lines at Wards of Mang’ola and Rhotia indicated span lengths exceeding 50 metres as in
Table 4, different from the recommended ones for safety purposes
| [34] | TANESCO. (2024). Engineering Instruction and Construction manuals, Vol 9 Issue 3, pp. 1-155. |
[34]
. Long spans crossing over the roads were touched, and conductors broken by high trafficking lorries Moreover, MV lines constructed along the roadsides had some poles knocked by vehicles driven by reckless drivers causing the fall of nearby distribution transformers that pose oil spills. Most poles erected alongside the road were not protected by guards whatsoever.
Table 4. Span lengths exceeding standards at various places in Karatu district.
Ward | Transformers | Span from transformer | Span length (m) |
Standard | Measured |
Mang’ola | 100 kVA, 33 kV | 2 | 50 | 85 |
100 kVA, 33 kV | 3 | 50 | 78 |
Rhotia | 100 kVA, 33 kV | 5 | 50 | 70 |
100 kVA, 33 kV | 7 | 50 | 80 |
3.1.2. Maintenance Strategies
The maintenance strategies found are Run-To-Failure (RTF), Preventive Maintenance (PM), Predictive Maintenance (PdM) and Proactive Maintenance (PaM) as defined by
| [20] | Mkilania J. N. & Mjema E. A. M, (2012). Overview of Factors Influencing the Quality of Maintenance and their Impact on Products and Services Offered by Tanzanian Industries. 2nd Proceedings of the International Conference Mechanical and Industrial Engineering, Arusha Tanzania. |
[20]
. The RTF (46.67%) carried out when there were a total failure and no power to consumers. As such, the transformer might have been reported overloaded or had its supporting poles rotten, but no immediate efforts made to replace the rotten poles or shift some of the connected power consumers to the nearby transformer to avoid overloads. Eventually, the overloaded transformer busted or fell down for rotten poles, posing land oil spills. Although efforts are made to replace the then rotten poles or busted transformer through RTF, the oil spills had already spread. This meant replacement of the rotten or broken poles was done at worst case scenario for lack of the essential items in warehouses. Inspection reports on sampled feeders indicated a substantial number of secondary substations had their pole supports rotten to signal for transformer fall, leading to broken bushings, the situation that causes land oil spills. Rotten poles adjacent to and those supporting the transformer at secondary substations would fall easily through strong winds as natural calamity or knocked by vehicles. As displayed in
Table 5, the PM (23.33%) and a bit PdM (20.00%), with a combined 43.33%, were next to RTF. The remaining 10.00% was literary, referred to as PaM. The PM, defined as periodic maintenance
| [16] | Mageme M, (2017). Model for Unpaved Roads to Enhance Maintenance Decision Making in Tanzania. MMEng Dissertation. Dar Es Salaam Institute of Technology. |
[16]
, involve such activities as checking the oil level, replenishing and improving transformer earth resistance, tightening loose parts of Circuit Breakers (CBs) and replacement of oil, cleaning connecting lids of auto re-closers, installation of transformers to relieve loads of others in the circuit. PdM
| [18] | Manikandan, S. & Duraivelu, K. (2021). Fault diagnosis of various rotating equipment using machine learning approaches–A review. Proceedings of the Institution of Mechanical Engineers, Part E: Journal of Process Mechanical Engineering, Vol. 235 Issue 2, pp. 629-642. |
[18]
was rarely applied in the distribution systems. Accordingly, three respondents (19.84%) out of 15 could define the predictive strategy based on tools and equipment.
Table 5. Summary of power distribution maintenance types.
Maintenance strategies | Frequency | Proportion (%) |
RTF | 28 | 46.67 |
PM | 14 | 23.33 |
PdM | 12 | 20.00 |
PaM | 6 | 10.00 |
Total | 60 | 100.00 |
The equipment was serviced beyond their predetermined mileage and time of service such that certain sounds, smells, and vibrations were used to detect the unavoidable limitation of services. No predictive devices
| [29] | Shil, P. & Anderson, T. (2019). Distribution Transformer Health Monitoring and Predictive Asset Maintenance. Paper 3944 -2019, pp. 1-11. |
[29]
were installed on the power distribution system to sense and give feedback to responsible personnel. Neither were personnel assigned for predictive maintenance. 10.00% of respondents were well informed on proactive maintenance based on construction and maintenance manuals provided for operations to improve equipment conditions and degradation rate through better design, installation procedures, failure analysis, quality, and scheduling in power distribution systems. Few respondents are aware that Reliability Centred Maintenance (RCM), failed parts analysis that included Root Cause Failure Analysis (RCFA) and Failure Mode and Effect Analysis (FMEA), reliability engineering, age exploration and recurrence control were rarely applied in power distribution systems.
3.1.3. Vandalism Cases
Other transformer external failure-related causes were noted when the transformer tank was pierced, its cork underneath was removed, and bushing gaskets failed to enable the mineral oil flow out. It could be realized that there was vandalism for the removed or pierced cork prompted by black markets of transformer mineral oil sold as cooking oil for frying potato chips, fuel for vehicles and as medication of wounds
| [14] | Kirunguru, E. K., Huang, Q. & Ayambire, P. N. (2018). Design and Implementation of a Transformer Vandalism Monitoring System. International Journal of Sensors and Sensor Networks. Vol. 5 Issue 6, pp. 76-80.
https://doi.org/10.11648/j.ijssn.20170506.12 |
[14].
3.1.4. Manufacturing Defects
Meanwhile, some transformers were found with unsatisfactory tank welding. Due to the influence of external environment, temperature, experience skills, welding materials, plates and other factors, the quality results after welding must be satisfactory to avoid welding cracks and blisters, which cause oil leakage. Transformer leaks were most commonly caused by degrading cork gaskets, holes radiator fins or steel tank.
3.1.5. Summary of Causes of Land Oil Spills
Table 6 summarises the internal-related failures with 24.62%, as a combination of lightning (3.52%) and overloads (21.10%), and external-related failures making 75.38% as a combination of vandalism (60.30%), improper construction practices (6.03%), improper maintenance (7.04%) and manufacturing defects (2.01%).
Table 6. Summary of causes of causes of land oil spills.
Causes of failure | Frequency | Proportion (%) |
Improper construction | 12 | 6.03 |
Improper maintenance | 14 | 7.04 |
Lightning | 7 | 3.52 |
Manufacturing defects | 4 | 2.01 |
Overload cases | 42 | 21.10 |
Vandalism cases | 120 | 60.30 |
Total | 199 | 100.00 |
3.2. Oil Spill Places
According to
| [37] | Vankore, A. & Nikam, J. (2024). Oil Spills. International Journal of Multidisciplinary Education and Research. Vol. 9 Issue 1, pp. 45-47. |
[37],
oil spills have a number of effects on the environment. On a basic level, oil spills damage waterways, plants and animals on the land. Further, when oils ring or machinery malfunction or break, thousands of tons of oil can seep into the environment. Habitats can be catastrophic; killing plants and animals; disturbing salinity/PH level, and pollute air, water and more.
Table 7.
Analysis of accessible witnesses on structured interviews Arusha district. Interviews | Ward respondents | Total respondents |
Moivo | Sokoni II |
Stayed period | ˃5 Years | 21 | 24 | 45 |
˂5 Years | 0 | 0 | 0 |
Informed on transformers | | 21 | 24 | 45 |
Informed on oil theft | | 21 | 24 | 45 |
Source of information for power restoration | Rumors | 9 | 10 | 19 |
Local leaders | 12 | 14 | 26 |
Replenished transformers | | 2 | 2 | 4 |
New transformers | | 2 | 3 | 5 |
Replenished/power restored intervals | ˃3 Days | 9 | 14 | 23 |
˂3 Days | 12 | 10 | 22 |
Places with oil spills | | 4 | 5 | 9 |
The review focused on distribution transformers at Moivo and Sokoni II wards in Arusha district as portrayed in
Table 7. The findings from both wards suggested that they lived in their places for more than five years and witnessed TANESCO teams with Police investigating transformers affected by vandalism. Further interviews disclosed transformer mineral oil in the street, such as cooking oil for frying potato chips. Some were sold as fuel for vehicles at a cheap price in the black markets. The interviewed 24 (53.33%) respondents at Sokoni II, and 21 (46.67%) respondents at Moivo had knowledge of distribution transformers and witnessed the transformer mineral oil theft. Further, a total of nine oil-immersed distribution transformers were damaged due to vandalism, with the majority of the incidents occurring in the Sokoni II ward, accounting for five transformers (55.56%) and the remaining four transformers (44.44%) in the Moivo ward. Four of the nine vandalized transformers were still operational and promptly repaired, with two located in Sokoni II and two in Moivo. However, the other five transformers, three in Sokoni II and two in Moivo were deemed irreparable and required replacement. Five distinct areas indicated the vandalized transformers; four at Sokoni II ward and the remaining at Moivo ward. Oil spills were detected in all nine locations, indicating a widespread environmental concern. The replacement and restoration of power to the vandalized transformers faced a significant delay of over three days, causing inconvenience and disruption to the affected areas. Based on the report, 51.11% of the respondents (14 from Sokoni II and nine from Moivo) reported that power was restored three days after the necessary arrangements for replenishing mineral oil. In contrast, 48.89% (10 from Sokoni II and 12 from Moivo). Notably, 57.78% of the respondents received information regarding power restoration from their local leaders, highlighting the importance of effective communication channels. Conversely, 42.22% relied on rumors, indicating a potential lack of reliable information dissemination in certain areas.
Mineral oil spills on plant, soil and water samples indicate that in all types of soils, clay soils were much affected (12%), followed by silt soils (8%). In all types of water bodies, ponds were much affected (14%), followed by swamps (12%). Meanwhile, in all plant species sampled, forbs that do not grow much tall were much affected (13%), followed by grass (10%) as in
Table 8. The placement of secondary substations on sloping land surfaces may result in oil leaks that have the potential to reduce the width of the spill but increase its length, thereby reaching a distant area. It can lead to the contamination of plant species, particularly forbs and grass, commonly found on inclined land surfaces beneath secondary substations. Around 11% of defective distribution transformers with leaks were found installed on improper land surfaces, affecting clay soils (4%), gravel soils 2%, sandy soils (2%) and silt soils (3%). The selection of load centres for the secondary substation did not consider the different soil types, including clay, gravel, sand, and silt. Clay soil retains liquids (in this case mineral oils when leaked) for long time, followed by silt soils. Sand and gravel soils, relatively retain liquids for a short time following the large spaces between particles. At least 16% of defective transformers with oil leaks were found installed on improper soil types, affected clay soils (6%), gravel soils 3%, sandy soils 3% and silt soils 4%.
Table 8.
Oil leaked defective distribution transformers at plants, soils and water places. Locations | Improper soils (%) | Improper surfaces (%) | Improper screed concrete (%) | Total |
Clay soils | 6 | 4 | 2 | 12 |
Gravel soils | 3 | 2 | 1 | 6 |
Sandy soils | 3 | 2 | 2 | 7 |
Silt soils | 4 | 3 | 1 | 8 |
Total | 16 | 11 | 6 | 33 |
Gullies | 4 | 2 | 0 | 6 |
Ponds | 6 | 6 | 2 | 14 |
Swamps | 8 | 0 | 4 | 12 |
Total | 18 | 8 | 6 | 32 |
Forbs | 6 | 5 | 2 | 13 |
Grass | 4 | 4 | 2 | 10 |
Shrubs | 4 | 2 | 1 | 7 |
Trees | 3 | 2 | 0 | 5 |
Total | 17 | 13 | 5 | 35 |
Overall | 51 | 32 | 17 | 100 |
Plinths and floors under which distribution transformers were mounted could be found with improper and weakly screed concretes, whereby crakes allowed penetration of mineral oils and reached various soli types, plant species and water bodies. Places found with improper screed concretes and so vast effects of mineral oils on plants and soils were those with soil types retaining liquids much longer than others. These included clay (2%), gravel (1%), sand (2%) and silt (1%), making a total of (6%).
Plant samples included in this study were forbs (Colocasia and Sativa), grass (Poaceae), shrubs (Rhododendron) and trees (bamboo). Distribution transformers found on improper soil types were 17%, affecting forbs (6%), grass (4%), shrubs (4%) and trees (3%). Those found on improper land surfaces 13%, affected forbs (5%), grass (4%), shrubs (2%) and trees (2%). Only 5% of the distribution transformers at improper screed concretes affected forbs (2%), grass (2%) and shrubs (1%). No trees were found affected at improper screed concretes.
Oil spills generate several environmental impacts and have become more common with the increase in petroleum extraction, refining, transportation, and trade. In soil, oil contamination increases water and nutrient availability and compaction, directly affecting plant growth and development. Different aspects of phytotoxicity can be observed and will vary according to the characteristics of soil and plants. Oil-contaminated soil also results in negative effects on biomass and changes in leaves and roots
| [4] | Correa, H. D. S., Blum, C. T., Galvão, F. & Maranho, L. T. (2022). Effects of Oil Contamination on Plant Growth and Development: A Review. Environmental Science and Pollution Research Article. Vol. 29, pp. 43501–43515. |
| [39] | Yadav, K. K., Sing, K. K., Yadav, A. S. & Kumar, D. (2023). The Ecological Impact of Oil Spills on Soil Health. Vigyan Varta an International E-Magazine for Science Enthusiasts, Special Issue 3, pp. 92-96. |
[4, 39]
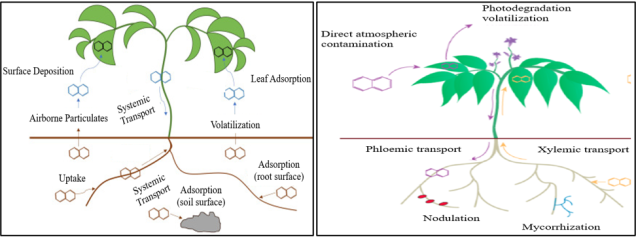
stated that the release of crude oil into the environment introduces toxic compounds, such as Polycyclic Aromatic Hydrocarbons (PAHs) as in
Figure 4, heavy metals, and volatile organic compounds, which can persist in soils long after the initial spill event. These contaminants can alter soil physical properties impeding water infiltration and reducing soil porosity. Oil penetration into the soil matrix can lead to the formation of hydrophobic layers, exacerbating issues related to water retention and affecting the availability of nutrients to plants. Further, the uptake of organic pollutants by plants from contaminated soils depends on abiotic factors that include physicochemical properties of the molecule and molecular weight and soil components (clays, iron oxides, organic matter) and biotic factors that involve transpiration rates on types and amounts of lipids in root cells, enzyme complements, root exudates and growth dilution.
| [33] | Song B, Zeng G, Gong J, Liang J, Xu P, Liu Z, Zhang Y, Zhang C, Cheng M, Liu Y, Ye S (2017). Evaluation methods for assessing effectiveness of in situ remediation of soil and sediment contaminated with organic pollutants and heavy metals. Environment international, Vol. 1 Issue 105, pp. 43-55. |
[33]
said that the evaluation of oil impact on soil ecology involves assessing the effects of oil contamination on the various components of the soil ecosystem, including plants, microorganisms, and invertebrates.
According to
responsiveness of vegetation to oil contaminant also depends on type of root system they contain. Further, as compared to plants containing stock roots, the plants having shallow roots are affected with oil spill. The oil spills show immediate influence on vegetation cover as within few days of the spill the vegetation turns yellow or brown in color, losing chlorophyll and falling of leaves.
The presence of mineral oil in soil that is already contaminated can have detrimental consequences, including the immediate death of plants upon contact, the suppression of growth, and the inhibition of germination-fact that it enhances the inhibition of activities of the soil micro-organisms by delimiting free water supply and aeration
| [23] | Pawar, R. M. (2015). The Effect of Soil pH on Bioremediation of Polycyclic Aromatic Hydrocarbons (PAHs). Journal of Bioremediation and Biodegradation, Vol 6 Issue 3, pp. 1-14.
https://doi.org/10.4172/2155-6199.1000291 |
[23].
The pH of oil spill-polluted places varied over a range of 5–8 affecting various types of soils as in
Table 9.
Table 9.
Chemical properties of tested soils. PH | Clay | Gravel | Sand | Silt |
Normal soil | 5.75 | 6.98 | 6.56 | 5.92 |
Polluted soil | 7.53 | 7.62 | 7.63 | 7.56 |
Increase (%) | 31.19 | 9.17 | 16.31 | 27.70 |
The ability of soil to allow water to flow through it is called soil permeability. Flow of water in soil takes place through void spaces, which are interconnected
| [3] | Arunkumar, S. (2021). Soil Water Movement – Saturated and Unsaturated Flow. Open Access Multidisciplinary Monthly Online Magazine Vol 2 Issue 11, pp. 29-33. |
[3]
. According to Darcy's law, gravel soil has the highest permeability of 100 cm/s, followed by sandy soil, which ranges from 10-2 to 100 cm/s. Clay soil has the lowest permeability, ranging from 10-6 to 10-4 cm/s, followed by silt soil, ranging from 10-4 to 10-2 cm/s. Permeability test methods performed included the constant head test method for permeable soils (k>10-4 cm/s) and the falling head test method mainly used for less permeable soils (k<10-4 cm/s) (viscosity
| [1] | Al-Obaidi, A. (2018). Soil Mechanics Notes Chapter Five (Permeability and Seepage through Soil). University of Tikrit, Iraq. |
[1]
. The constant head and falling methods are used for permeability tests on contaminated gravel and sandy soil, while the falling head method was applied to test clay and silty soils. The experiments revealed that the permeability of the contaminated soil types exhibited varying degrees of decrease. The findings indicated that both clay and silt soils experienced a significant reduction in permeability, ranging from 10% to 20%. In contrast, the permeability of gravel soil decreased by 10%, while sand soil decreased by 1% to 10%. The decline in permeability for all soil types was attributed to transformer oil, which became trapped in the soil's pore spaces, consequently diminishing the pore sizes and impeding water flow through the soil.
Based on improper soil types, 18% of the defective transformers with oil leaks affected gullies (4%), ponds (6%) and swamps (8%). Those on improper land surfaces 8% affected gullies (2%) and ponds (6%). No distribution transformers were found under swamps at improper land surfaces. Only 6% of the defective transformers with oil leaks were found on improper screed concretes, with ponds (2%) and swamps (4%). No defective distribution transformers with oil leaks were found on or near gullies. Oil spills on water itself can severely contaminate beaches and sediment and causes serious harm to marine wild life
| [37] | Vankore, A. & Nikam, J. (2024). Oil Spills. International Journal of Multidisciplinary Education and Research. Vol. 9 Issue 1, pp. 45-47. |
[37]
. Further, it suffocates fish, get caught in the feathers of birds and mammals and block light from photosynthetic plants in water, disturbing the food chain. Samples from distribution transformer mineral oil polluted inland waters in gullies, ponds and swamps at Maji ya Chai, Monduli Juu, Sepeko and Usariver Wards were tested on physical, chemical and biological changes, and the results displayed. Test results indicated that ponds were affected much in all sampled wards.
Table 10 indicates Usariver leads whereby pond samples were polluted to 4.66%, followed by Maji ya Chai (4.04%) and Sepeko (2.95%). Ponds were heavily affected, possibly because water was stagnant. Swamps were second from ponds, with Usariver ward heavily polluted (4.00%) again, followed by Maji ya Chai ward (3.71%) and Sepeko ward at somewhat 2.28%. Swamps tend to absorb and retain water for some time, and oil spills would likely have drained shortly underground. Swamps contain transformer oil, relatively similar to ponds, as water is stagnant. Gullies with average of 6.00% were not very much affected by oil spills, possibly because water therein is sometimes in motion.
Table 10.
Oil spills from inland water bodies. Water bodies | Wards | Total (%) |
| Maji ya Chai | Monduli Juu | Sepeko | Usariver | |
Gullies | 1.57 | 1.10 | 1.52 | 1.81 | 6.00 |
Ponds | 4.04 | 2.34 | 2.95 | 4.66 | 13.99 |
Swamps | 3.71 | 2.00 | 2.28 | 4.00 | 11.99 |
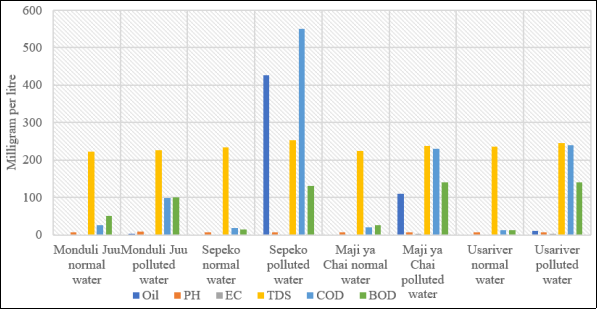
Generally, the alarming situation did not affect Monduli Juu ward, although the obtained statistics are negligible. Water samples were collected from Maji ya Chai and Usariver wards in Meru district, Monduli Juu and Sepeko wards in Monduli district (Plate 3). The test results for Potential of Hydrogen (PH), temperature, Electrical Conductivity (EC), Total Dissolved Solids (TDS), Biological Oxygen Demand (BOD) and Chemical Oxygen Demand (COD) in
Figure 5 indicated that the BOD at a temperature between 26°C and 29°C was found between 100 mg/l and 140 mg/l. The greater the concentration of organic pollution in the water, the greater the oxygen demand of the bacteria. The thin oil layer on the water surface inhibited the growth of microbiology that grows in shallow waters
| [30] | Singh, G., Singh, A., Singh, P. & Shukla, R., Tripathi, S. & Mishra, V. K. (2021). The Fate of Organic Pollutants and Their Microbial Degradation in Water Bodies. Banaras Hindu University, Varanasi, Uttar Pradesh, India: Institute of Environment and Sustainable Development. |
[30].
The COD was found between 98 mg/l and 550 mg/l.
The EC was measured between 0.31 and 2.89 mmhos/cm from the TDS ion concentration within the water, which was between 227 mg/l and 252 mg/l. pH of polluted water became more basic between 7.68 and 7.96. The oil spill at Maji ya Chai was caused by leakage from the distribution transformer resulting from lightning. The transformer burnt due to overload, causing an oil spill at Sepeko Ward. Meanwhile, the oil spill at Monduli Juu was caused by a distribution transformer rupturing due to manufacturing defects. The PH values recorded were within the permissible level of the World Health Organization (WHO)
| [9] | Haile, M. Z. & Endale, T. M. (2019). Analysis of Physico-chemical Characteristics of Water Collected from Different Sampling Sites of Lake Hawassa, Ethiopia. Journal of Environment Vol 9 Issue 2, pp 38-45
https://doi.org/10.5923/j.env.20190902.02 |
[9].
EC, TDS, and COD values increase significantly after plant exposure. High EC, TDS and COD are signs of pollution. The increase in EC indicates that most inorganic elements are abundant
| [5] | Edema, N. (2012). Effects of Crude Oil Contaminated Water on the Environment. Crude Oil Emulsions- Composition Stability and Characterization, pp. 170-180.
https://doi.org/10.5772/36105 |
[5]
. Although the TDS values increased, they were still within the highest desirable limit of WHO (500mg/l) and classification scheme of African water within conductivities between 6,000 – 16,000μScm-1. Continuous pollution may rise and exceed WHO values as described by the Environmental Protection Agency (EPA)
| [6] | EPA. (2017). Selected Analytical Methods for Environmental Remediation and Recovery. Washington DC: EPA. |
[6].
3.3. Mitigating Measures
Mitigating measures include but not limited to proper construction practices, maintenance strategies, proper procurement management unit, load current-based model, and alkane-degrading bacteria and their interaction with the plant.
3.3.1. Proper Construction and Maintenance
The first part that mitigates land oil spills from distribution transformer internal and external failures is the application of construction and maintenance standards. Maintenance is an all-life activity that has to be enhanced immediately after construction to standards. Regular maintenance should include activities to be carried out in the formalized priority as inspections, quick fixes, load balancing, load transfer to near secondary substation, upgrading the existing secondary substation, upgrading LV lines conductor size, introduction of new secondary substation, upgrading MV line conductor size and upgrading MV line from 11 kV to 33 kV.
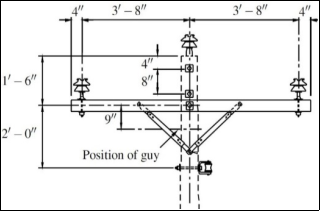
Figure 6. 33kV recommended line spacing.
Inspection is a proactive measure that aims to identify the problem in advance. It is through inspection that improper construction practices occur. Moreover, improper maintenance strategies can be identified and quickly fixed. Growth of load current in various secondary substations can be trended for decision-making on load balancing, load transfer, upgrading the existing secondary substation, upgrading the LV line conductor size, introduction of a new secondary substation, upgrading the MV line conductor size and upgrading the V line from 11kV to 33kV. The mitigating measures will help proactively avoid poor workmanship, manufacturing defects, lightning, overload and vandalism cases leading to land oil spills. Typically, the precise recommended spacing of 3ʹ8ʺ between conductors for an overhead horizontal 33 kV line with porcelain pin insulators should be fixed on an 8ʹ long galvanized steel cross-arm as illustrated in
Figure 6.
Accordingly, a typical wooden pole 44ʹ long applied on the MV line must have its length one-sixth immersed underground. Generally, it is recommended that the length of the galvanized cross-arm should be at least 8ʹ for a 33 kV line. This length should include at least 4ʺ m left from both ends of the applied cross-arms. The remaining 7ʹ4ʺ for 33 kV lines optimized for mounting the insulators
| [21] | Obi, P. I. & Iloh, J. P. (2016). Various Types of Insulators Used in Power System for Safe Operations of Transmission Lines. International Journal of Innovative Engineering, Technology and Science, Vol 1, Issue 1, pp. 10-17. |
[21]
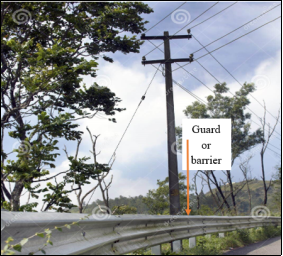
holding the conductors. The 5ʹ cross-arms currently used in 11 kV lines should be avoided; the 7ʹ cross-arms should be applied for the same reasons. The power utility (TANESCO) should consider using roadside barriers or guards on poles as found in few areas indicated in
Figure 7 to protect the MV line constructed along the roads so that the individual poles are not directly knocked by reckless drivers causing fall of a nearby distribution transformers that causes oil spills.
Figure 7. Typical guards near roadside MV line pole.
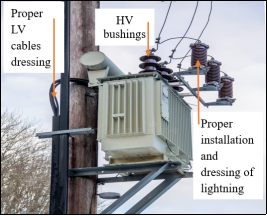
The best construction practice in areas with high level of isokeraunic is to install arrestors close to and in parallel with the transformer HV bushings as demonstrated in
Figure 8 to protect the transformer from thunderstorm causing land oil spills. It is therefore recommended to use steel rods coated with copper but the galvanization must be strong and proven to recommended thickness of pure copper layer on the pure steel or pure copper earth-rods. If preventive maintenance was well implemented, it would involve replacement of such electrodes and addition of organic manure to achieve the recommended values of the earthing system on both MV and LV sides periodically. The recommended dressing during construction of secondary substations is a panacea and proactive action to land oil spills. The ongoing exercise to improve the secondary substation dressing as witnessed at Mto wa Mbu, an area found in Monduli district but attended by Karatu district personnel should be rollout in Arusha region to alleviate land oil spills.
Figure 8. Proper dressing of substation with arrestors.
3.3.2. Proper Procurement Management Unit
To avoid the manufacturing defects, involvement of engineering teams during procurement processes is a must. The defective distribution transformer with oil leaks, which will be recognized and rejected at manufacturing factories. Transformer manufacturing defects that were a result of uncoordinated factory due diligence and acceptance tests to suppliers, manufacturers or project contractors in all materials and works procured and used in power distribution systems leading to procuring substandard materials and works that cause high rates of oil spills shall come to an end.
3.3.3. Proper Technological Tools
The power distribution metrics that is majorly applied included the data collected from defective distribution transformer load currents due to external failures (I
E), overloads (I
O) and vandalism (I
V) at large. The power distribution metrics (Equations (
2), (
3) and (
4)) consider the real energy power (P) that is lost due to power blackout resulted from failure of parts external to distribution transformers (P
E), unadministered overloads (P
O) and vandalism influences (P
V). The power distribution metrics considers the 3-phase transformer load power factor as 0.8 with line voltage 0.4 kV. Defective distribution transformers due to failure of MV line parts, overloads and vandalism were used as quantities to develop a proactive load current-based regression model as one means to mitigate the causes of land oil spills. Further, land oil spills in
Figure 3 were used to develop a reactive soil-based regression model as a means to mitigate the effects of land oil spills. Both models are hereby regarded as part and parcel of comprehensive construction and maintenance manuals.
The mitigating measures termed here as models include resource mobilization that includes manpower, tools and equipment, spare parts and man-hours as major components of the intended models. The same also includes 11 kV and 33 kV power distribution systems, having MV lines, transformers, LV lines, consumer loads and land surface. The mitigating measures have two parts, so designed to accommodate oil spills emanating from both distribution transformer internal and external failure arenas. The internal failure arena is an inbuilt fault oil spill conceptual model and the external failure arena is a human interruption oil spill model. The transformer internal and external failure oil spill models were hereby developed to bridge the gaps identified from models developed by
| [13] | Kabanda, P. & Ttondo, S. S. (2018). Technical Strategy to Curb Transformer Oil Theft on Distribution Networks: Case of Uganda’s Power Distribution Network. International Journal of Engineering Research & Technology, Vol. 7 Issue 5, pp. 283-288. |
[13, 14
,
24]. Specifically, soil-based model was developed to bridge the gap identified by
| [19] | Marija, E. (2019). A Comprehensive Planning Framework for Urban Inland Oil Spill Management (PhD Dissertation). Ryerson University Toronto, Ontario, Canada. |
[19].
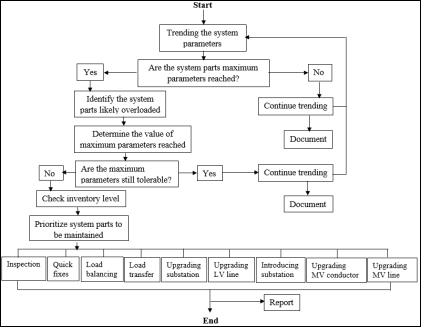
Load current-based oil spill model considers the best protection way is to monitor the load currents under individual distribution transformers so that the threshold is not exceeded. The load currents should exceed the nominal value only in a very short time but not frequently. So, the activity process should be carried out in the order of preference in the protected zone. Quick fixes may include replacement of a broken jumper after carrying out thorough inspections. The inspection must be carried out periodically after a set time in calendar. Load balancing is to be done when LV phases are realized to have different load current values after inspections. It has been noted that if load balancing is not carried out immediately, the overloaded phase conductors may puncture and stress the LV phase winding and damages the insulation leading to excessive mineral oil heating that threatens the bushing gaskets and so oil leaks. The model therefore consists of Equations carrying fundamental parameters that govern the maximum load currents to decide, through inspections when to carry out quick fixes and load balance. Quick fixes include such activities as cutting trees touching MV lines, replacement of defective parts, correction of earthing system, etc. Load balance includes shifting some consumers from phases that are more loaded to others with light loads so that there is balance of load currents. The same governs the transfer of consumer loads to the nearby substation if it has a room to accommodate the additional loads. Upgrading the existing secondary substation if the above options are covered is to follow or else, upgrading the LV lines conductor size is done before introducing a new secondary substation to relieve the likely overloaded transformer. Upgrading the MV line conductor size and upgrading the MV line from 11 kV to 33 kV should be the last resort. The qualified personnel will do all data acquisition from one window if there is a center for power distribution system Supervisory Control and Data Acquisition (SCADA).
A smart SCADA as
Figure 9 should have personnel at a control room who trend the readings or watching on dashboard or mobile smart phone when the indications are overcurrent and earth fault for quick fixes do inspection. The same should trend the readings to see when the maximum load current or any other parameters are reached at ±10% on a particular system part so that preventive maintenance is carried out. An inventory control system for replacement at all stages contains all system parts such as ACSR, arrestors, DOF, insulators and transformers. The same inventory control system should include the number of qualified personnel, tools and equipment as well as estimated man-hours. When started, there is a window for trending the system parameters, followed by another window for yes or no applied depending on the status. If the system maximum parameters are reached (Yes) it can identify the system parts in the list of inventories likely overloaded.
Kabanda et al
| [13] | Kabanda, P. & Ttondo, S. S. (2018). Technical Strategy to Curb Transformer Oil Theft on Distribution Networks: Case of Uganda’s Power Distribution Network. International Journal of Engineering Research & Technology, Vol. 7 Issue 5, pp. 283-288. |
[13]
developed a technical strategy to curb transformer oil theft on power distribution networks. The model gives out an audible alarm and communication between the 3-phase distribution transformer against external failures and the technical staff in charge. The model requires oil level monitoring device that can detect a fall in the level from vandalism; a stand-alone 12 V DC battery power independent of the power from the transformer; reliable Micro Controller Unit (MCU) that perform Application Delivery Controller (ADC) function and output digital signal to the existing Global System for Mobile (GSM) modem that sends Short Message Service (SMS) to a programmed Identification (ID) number of a technical officer. The model considered the fall of oil level due to vandalism without consideration to the condition of power distribution system. The gap here was that oil level could fall not necessarily due to vandalism but internal failure of the distribution transformer.
| [14] | Kirunguru, E. K., Huang, Q. & Ayambire, P. N. (2018). Design and Implementation of a Transformer Vandalism Monitoring System. International Journal of Sensors and Sensor Networks. Vol. 5 Issue 6, pp. 76-80.
https://doi.org/10.11648/j.ijssn.20170506.12 |
[14]
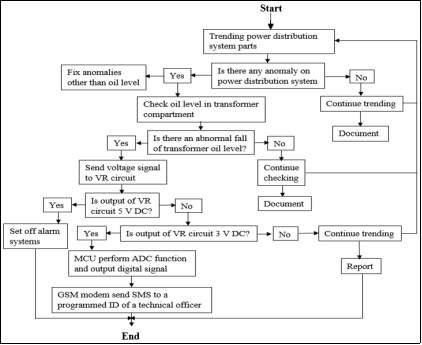
developed a technical design and implementation of transformer vandalism monitoring system. The model is inactive when there is no power from the transformer mains for lacking intelligence charging system. The model also responds unnecessarily to a person coming close to the secondary substation who is not intending to vandalize the transformer oil. The two were modified as one model to obtain an improved vandalism-based oil spill conceptual model. An improved vandalism-based oil spill conceptual model flow chart is hereby presented as in
Figure 10. When started, there is a window for trending the power distribution system parts, followed by another window for yes or no applied depending on the status. If there is any anomaly regarding power distribution system parts (Yes) the model can discriminate the defective power system parts other than transformer oil level to alarm for quick fixes prior to drop of oil level. If there is an abnormal fall of oil level in the transformer compartment, the signal is sent to Voltage Regulator (VR) circuit to validate the Direct Current (DC) voltage values 5 V and 3 V. The 5 V DC (Yes) sets off alarm system and 3 V DC (Yes) sets on alarm systems. If there is (No) anomalies in the power distribution system parts the model continues to trend anomalies and provide feedback. Likewise, if there is (No) abnormal fall of oil level in the transformer compartment, the model will continue checking the oil level and provide feedback.
Marija et al
| [19] | Marija, E. (2019). A Comprehensive Planning Framework for Urban Inland Oil Spill Management (PhD Dissertation). Ryerson University Toronto, Ontario, Canada. |
[19]
developed a comprehensive planning framework for urban oil spill management. The model lacks the impacts of land oil spills on soil environments since there is serious absorption by soils along the overland flow path of the spill as discussed in this chapter.
developed a model for investigation of transformer oil exposed to the atmosphere. The model is really a PM strategy to a lone transformer out of circuit. Consideration of PM on power distribution system as discussed in this chapter covers the model at large. The load current-based oil spill model is hereby integrated with the modified models developed by [
13, 14]. Three criteria were followed before integrating the three models as follows:
1) To ensure the oil spill variables of vandalism-based model are compatible with the load current-based oil spill model.
2) To determine how the oil spill control data from the load current-based oil spill model and from vandalism-based model should synchronize, and
3) To build interfaces to enable data sharing between the load current-based and vandalism-based oil spill model.
A need to integrate the load current-based oil spill model and improved vandalism-based oil spill model is to cover the gap realized when modeling the data for PV rejected by Xlstat simulation that indicated p-value greater than the usual 0.05% and recommended for removal. The aim is to achieve a unified load current-based and vandalism-based model.
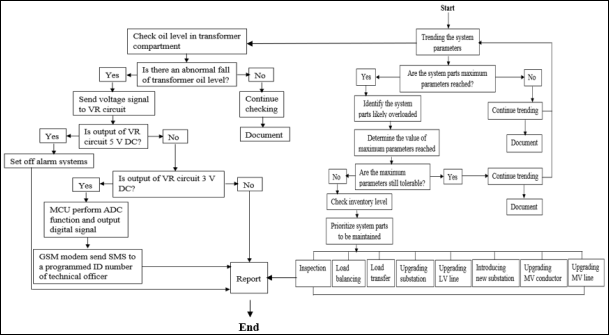
The input variables in the integrated models are power distribution lines, distribution transformers, distribution transformer mineral oil, personnel, spare parts, tools and equipment and man-hours. Qualified personnel, spare parts, tools and equipment are predetermined in the inventories. The intervention variables are activities done that includes calculations used to determine the parameters chosen for indications to the personnel officer on duty. These parameters include parameter-reading instruments not limited to oil level gauge, sound alarms, light alarms, current meters, voltage meters and resistance meters. The model hereby synchronizes at one window or dashboard the data for oil spill control. The output variable includes functionality of the generated model from input and intervention variables. The distribution system parts given priority included those listed in the load current-based oil spill model, attended according to the order in the list of priority activities.
Figure 11. Designed load current and vandalism-based oil spill conceptual model flow chart operations.
Load current and vandalism-based oil spill conceptual model flow chart as portrayed in
Figure 11 is an interface built after integrating the four models. The interface indicates that the load current-based oil spill model is a control circuit to the vandalism-based spill model in that the former ensures a continuous power supply to the latter so that the latter works for 24/7 without power interruptions. Since both circuits monitor the transformer, it is very possible that one operator can receive or take note on the signals for abnormal fall of oil level even when there is no vandalism but maximum parameters of a particular distribution system part reached for overloads and prioritize system parts to be maintained after checking the inventory level before it is too late. Since this model prevents oil spills whether it is accidental from vandalism or load current-based along the power distribution system, it will accommodate all unattended problems on the impacts of land oil spills on soil environments to cover the serious absorption by soils along the overland flow path of the spill.
The soil-based model has a window to initiate the process. Important information built-in with the model includes types of soil to select as described in the model block diagram. If suitable, the soil type is selected and the land slope determined for reduced Y/X ratio so that the land surface is horizontally levelled. The process is followed by preparation of concrete by taking the selected soil types, cement and water mixture stirred. If well mixed the concrete is poured on the levelled land surface and screed. The screed concrete is cured for seven days of compactness. The transformer with predetermined load currents is finally mounted on the screed concrete with connection of circuits done.
3.3.4. Application of Alkane-degrading Bacteria
Alkanes are saturated hydrocarbons present in transformer mineral oils. They are produced by geochemical processes from decaying plant and algal material throughout the biosphere Alkane-degrading bacteria are ubiquitous in environments and can play an important role in oil remediation from soil and water. They can utilize alkanes, of various chain lengths, branched and or straight, as nutrient source. The use of alkane-degrading bacteria in conjunction with plants offers much potential for bioremediation of oil-contaminated soil. This approach can be defined as rhizo-degradation, which is a specific type of phytoremediation that involves both plants and their associated microbes, and can occur naturally or can be actuated by deliberately introducing specific bacteria. These specific bacteria may be alkane-degrading bacteria that can degrade alkanes and other hydrocarbons present in oil. Alkane-degrading bacteria are widespread in oil-polluted environments Actually, many organisms (plants, insects, yeasts, and microorganisms) produce alkanes as a reserve material, pheromone, moisture barrier and metabolic overflow product. Accordingly, many microorganisms including bacteria have evolved to utilize alkanes as carbon and energy source and live in close association with the producing organisms, for example on the leaf and root surfaces of plants. Using alkane hydroxylase gene probes indicates that alkane-degrading bacteria are abundant in soils, sediments, water and plants.