Research Article | | Peer-Reviewed

GIS-Based Soil Erosion Assessment and Severity Mapping Using RUSLE Model for Planning of Conservation Measures at Selected Watershed in North Shewa Zone, Oromia, Ethiopia

Received: 5 May 2025     Accepted: 23 May 2025     Published: 23 June 2025
Views:       Downloads:
Abstract

Soil erosion is a common phenomenon in many parts of Ethiopian and it remains difficult to quantify and measure the amount of soil erosion. GIS provides spatial information to identify erosion potential areas and useful tools to estimate the annual soil loss based on Revised Universal Soil Loss Equation. The aim of this research was to estimate the annual soil loss from the watershed and to map soil erosion factors for planning and implementation of sustainable soil conservation and management system in the watershed. RUSLE model was employed rainfall erosivity factor, soil erodibility factor, topography factor, vegetation cover factor, management factor. The mean annual soil loss estimated in watershed was 44.67 tones ha-1yr-1 from 569.35 ha. The results revealed that about 23.44% of the watershed area undergoes moderate (5-10 tones ha-1 yr-1) to very slight (>2 tones ha-1 yr-1) erosion classes, 22.54% high (10-50 tones ha-1 yr-1) erosion class, 38.8% from severe (50-100 tones ha-1 yr-1) to very severe (100-500 tones ha-1 yr-1) erosion classes, and 15.23% catastrophic (>500 tones ha-1 yr-1) erosion class. Based on the findings it is recommended that, high to catastrophic erosion risk area of the watershed requires various soil and water conservation measures that intercept runoff by decreasing the transport capacity of flow and improving soil infiltration in the steep slope and rehabilitating hillside slope areas with different indigenous and exotic tree species should be embarked upon by participating farmers from plan preparation to implementation. Soil erosion hot spot areas that were identified in the soil erosion map should be given a serious attention and priorities for implementing soil conservation activities before the areas reached to irreversible soil degradations.

Published in International Journal of Environmental Monitoring and Analysis (Volume 13, Issue 3)
DOI 10.11648/j.ijema.20251303.11
Page(s) 74-86
Creative Commons

This is an Open Access article, distributed under the terms of the Creative Commons Attribution 4.0 International License (http://creativecommons.org/licenses/by/4.0/), which permits unrestricted use, distribution and reproduction in any medium or format, provided the original work is properly cited.

Copyright

Copyright © The Author(s), 2025. Published by Science Publishing Group

Keywords

Soil Loss, Erosion Class, Identification, and Prioritization

1. Introduction
Soil is the basic resource for economic development and for maintaining sustainable productive landscapes and people’s livelihoods especially for countries with agrarian economy like Ethiopia. However, soil degradation is a serious threat in agro-ecosystems and one of the global environmental problems . Globally, one-third of agricultural soils were reported as being affected by soil degradation , of which water and wind erosion account 56 and 28% of the observed damage, respectively .
Soil erosion by water has been a challenging and continuous problem in Ethiopia for decades . Especially, in Ethiopia highlands are vulnerable to severe erosion due to extreme deforestation, rugged topography, historical settlement, burning of crop residue, exploitative varieties of agriculture and improper/inappropriate land management practices . Several studies reported that the majority of cultivated lands within the highlands of Ethiopia have beyond the tolerable soil loss rate, which is between 5 to 11 ton/ha/year . In some cases, the average soil loss from croplands in the highlands of Ethiopia reached as high as 100 ton/ha/year and 130-170 ton/ha/year . Every year, an estimated 1.9–3.5 billion tons of top soil in Ethiopian highlands has been lost and as a result about 20,000–30,000 ha of cropland was taken out of production due to severe soil erosion in the earlier decades also indicated that 1.5 million tons of soil has been lost in the Ethiopian highlands each year, which also has resulted in a significant loss of grain from the country’s annual harvest. As a result of soil erosion, poverty and food insecurity are concentrated in rural areas . Thus, in order to achieve food security, poverty reduction and environmental sustainability in the country reversing soil erosion is a high priority .
In order to reverse soil erosion, several efforts have been exerted since the 1970s . However, past soil conservation efforts did not bring significant changes to the ongoing soil degradation problems . Erosion prediction involves the use of process based, empirical and conceptual models. Most recently, watershed management is an approach followed by the government of Ethiopia to protect soil from erosion in particular and to reverse land degradation in general . Although dramatic reduction has been made in arresting soil erosion, the approach has not been supported with intervention prioritizing techniques that identify highly susceptible areas using geospatial analysis. The intervention requires understanding of the rates of onsite soil erosion processes and its controlling factors that enhance or retard these processes. However, direct measurements of soil erosion are costly, labor intensive, and time consuming, spatial soil erosion model plays a vital role in the design of these interventions . A Revised Universal Soil Loss Equation (RUSLE) preferred for Ethiopian conditions and GIS was used to estimate soil losses and identify potential effect of erosion factors and its clear and relatively simple computational inputs requirement compared to others.
North Shewa zone is one of the northern parts of the Ethiopian highlands where soil erosion is severe. Hence, identifying and prioritizing erosion susceptible areas for soil and water conservation measures planning are quite essential. Therefore, the objective of this study is to assess and identify the erosion risk prone areas across the landscape of the watershed for planning of conservation measures in the watershed.
Objectives
1. To estimate the spatial distribution of soil erosion of the entire watershed
2. To provide a complete map of soil erosion susceptibility and land use/cover changes
3. To identify and prioritize erosion risk prone areas for intervention
2. Material and Methods
2.1. Description of the Study Area
2.1.1. Geographical Location
The study was conducted at Muziye watershed in Girar Jarso district of North Shewa zone, which is approximately located at 117 Km North of the capital city of Ethiopia (Addis Ababa) and 5 km from Fitche town which is capital city of North Shewa zone. The watershed is situated at 38°44’30’’E - 38°47’30’’E and 9°47’30’’N- 9°49’30’’N (Figure 1). The watershed covers a total area of 569.35 ha, and the watershed drain to abay basin.
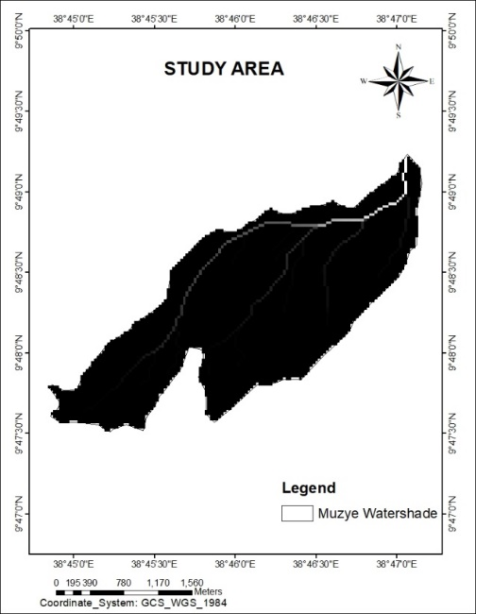
Figure 1. Map of Muziye watershed.
2.1.2. Topography and Climate
The landforms of the watershed are characterized by valleys, plateaus, hills and plains , and the altitude ranges from 1763m to 3096m above sea level. The watershed exhibits two major agro ecological conditions. These are lowland (gammojji), midland (badda-daree) which account, 71% and 29% of the watershed, respectively. The watershed receives an average annual rainfall of 1013 mm. The mean monthly temperature varies from 12.2°C to 28°C with mean annual temperature of 20.4°C.
2.1.3. Vegetation, Soil and Land Uses
The dominant trees and shrubs grown in the watershed include Cordia Africana, Ficus Spps and Eucalyptus. All these tree species provide economic and social benefits like firewood, forages for livestock, bee keeping, fencing, soil erosion control, maintain soil fertility and sheds. The major crops grown in the watershed are sorghum, wheat, barley and teff. However, there are other vegetable crops grown in the watershed such as potato, onion, cabbage and others.
The farming system in the watershed is mixed with dominantly oxen plough cereal crop production and livestock rearing, which is centuries old system. Accordingly, the major land use types in the watershed include cultivated, grazing, shrub/bushes, settlement natural forest and wood lands. Due to exploitive type of land use system, the watershed area is generally characterized with severe land degradation situation, evidenced with soil erosion and decline of soil fertility, deforestation and low vegetation cover, and progressively decline of land productivity. The most part of this watershed has relatively steep slope with shallow soil depth and endanger the remaining soil remnants on cultivated and grazing lands. This is due to total removal of top soil by accelerated erosion on steep lands.
2.1.4. Population
The total population of the peasant association in the watershed is about 14287 of which 7220 male and 7067 female constituting totals of 2926 households (HH) with 2507male headed HH and 419 females headed HH. The average family size is five persons per household and males are more in number.
2.2. Site Selection and Mapping of the Watershed
The watershed was purposively selected based on prevalence of resource management and land degradation problems, topography of watershed and road accessibility for this study. Based on the preliminary outlet identified during the site selection process, the watershed boundary was delineated using primary data (GPS readings).
2.3. Source of Data
Primary and secondary data was used as data sources. Primary data was collected by topographic transect walk and field observation. During transect walk, vegetation types, major LULC and land management practices including improved and local soil and water conservation measures implemented under different slope classes on agricultural land use in the study watershed were collected. In addition, a Global Positioning System (GPS) data collection was carried out to generate primary information regarding the ground truth for image classification and soil loss vulnerability verification. Secondary data such as Landsat 6 ETM+ image with spatial resolution of 30 × 30 m resolution acquired at March 5, 2016 from Ethiopian Mapping Agency for land use land cover classification, 30 m × 30 m resolution of FAO digital soil map, 30 m × 30 m resolution DEM, time series climatic data, particularly rainfall from National Meteorology Agency and Farm Management Information from Woreda Agriculture and Natural Resource Development Office was collected.
2.4. Methods of Determining RUSLE Factors
GIS techniques were integrated with Revised Universal Soil Loss Equation (RUSLE) empirical soil loss model to estimate mean annual soil loss of the watershed. Five major factors (Rainfall pattern, Soil type, Topography, Crop management system, and conservation practices) were used in RUSLE for computing the average annual soil erosion expected on the field slopes. The RUSLE has been widely adapted and used to estimate soil loss from watersheds having different or similar land uses elsewhere . The model has been popularly used because of its clear and relatively simple computational inputs requirement compared to others. The basic methodological approach followed in RUSLE has been detailed in the following simplified flow chart (Figure 2).
2.4.1. Determination of Rainfall Erosivity (R-factor)
The Rainfall erosivity factor (R) represents the erosive force of a specific rainfall event . It is actually determined by the amount, intensity and distribution of rainfall . Due to the absence of rainfall intensity data, we adopted the R-correlation established by for Ethiopia, which was used in other similar studies . It was calculated the mean annual rainfall based on monthly rainfall data of nine meteorological stations for the period 1990–2022 and computed the R-factor for each meteorological station using the following equation :
R= -8.12 + (0.562 x P)(1)
Where R is the rainfall erosivity factor in MJmm ha-1 yr-1
P is the mean annual rainfall (mm).
2.4.2. Determination of Soil Erodibility (K-factor)
The Soil erodibility factor (K) is an expression of inherent resistance to particle detachment and transport by rainfall and determined by the cohesive force between the soil particles, which may vary depending on the presence or absence of plant cover, the soil’s water content and the development of its structure and depends on the amount of organic matter in the soil, the texture of the soil, the structure of the surface horizon and permeability . But, for this study, FAO digital soil map was collected from Ministry of Agriculture (MoA) to derive soil map of the study watershed. Hence, the soil erodibility (K) factor for the watershed was estimated based on soil colors referred from soil database adapted to Ethiopia by as shown in the (Table 1).
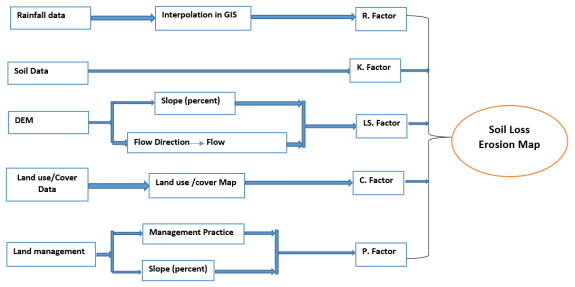
Figure 2. Conceptual framework of soil loss estimation.
Table 1. Soil color and K-value based on .

Soil color

Black

Brown

Red

Yellow

K-factor

0.15

0.2

0.25

0.3

2.4.3. Determination of Topographic (LS-factor)
The LS-factor in RUSLE is a combination of slope length (L) and slope steepness (S) factors . The steeper and the longer the slope, the higher is the rate of erosion by water because of the greater accumulation of runoff . In this study, the slope length and slope steepness factors were used to calculate and map the LS-factor as has been applied by other studies such as . The slope length and steepness values were drawn from the DEM (30 m resolution) using the ArcGIS Spatial analyst tool and the Arc Hydro tool.
L = (FA∗cell size/22.1)m(2)
S= (0.065 + 0.045 S + 0.0065 S2) (3)
LS = (FA∗cell size/22.1)m∗(0.065 + 0.045 S + 0.0065 S2)(4)
2.4.4. Determination of Crop and Management Cover (C-factor)
The C-factor represents the ratio of soil loss from land covered by vegetation to the corresponding loss from continuous fallow . Land use and land cover map of the study watershed was prepared from Landsat 6 ETM+ image with spatial resolution 30 m × 30 m resolution through supervised digital image classification technique. A field checking effort was also made in order to collect ground truth information. Land use and land cover and their C-values suggested by different authors as shown in (Table 2).
Table 2. Land cover and their C-values suggested by different authors for different LULC.

Land cover

C-value

References

Agricultural land

0.15

Hurni (1985); Bewket and Teferi (2009); Tadesse and Abebe (2014)

Forest land

0.001

Hurni (1985); Morgan (2005)

Degraded forest

0.005

Hurni (1985); Morgan (2005)

Shrub land

0.014

Wischmeier and Smith (1978); Abate (2011); Gelagay and Minale (2016)

Grazing land

0.01

Hurni (1985); Morgan (2005); Bewket and Teferi (2009); Abate (2011); Tadesse and Abebe (2014)

Bare land

0.6

Hurni (1985); Morgan (2005)

Settlement area

0.09

[33]/Ganasri and Ramesh (2015)

2.4.5. Determination of Conservation Practice (P-value) Factor
The P-factor is the specific soil and water conservation practices implemented to reduce run-off speed and increase infiltration, ultimately lowering soil loss and sediment delivery . The P-factor for RUSLE was developed through collecting data from field observations and assessment of conservation practice of the study area using ArcGIS. Accordingly, topographic transect walk was employed to assess major LULC and types of the existing soil and water conservation measures in agricultural land. The agricultural lands were classified into six slope categories. Because of no permanent soil and water conservation measures implemented to control runoff, the corresponding P-value for the study watershed were collected from similar techniques used in indicated in (Table 3) was assigned for each land use. Finally, the assigned P-factor value was looked up in spatial Analyst tool extension Re-class, converted into grid format with a cell size of 30 × 30 m.
Table 3. P -values suggested by for the different slope classes of agricultural land and other land.

Land use

Slope (%)

P-value

Agricultural land

0-5

0.1

5-10

0.12

10-20

0.14

20-30

0.19

30-50

0.25

50-100

0.33

Other land

All

1.00

2.4.6. Total Soil Loss Analysis (A)
Average annual soil loss rate was determined by a cell-by-cell analysis of the soil loss surface by multiplying the respective RUSLE factor values (R, K, LS, C, and P) interactively by using “Spatial Analyst Tool- Map in Arc GIS as shown equation . The output map was converted to hectare basis to obtain the annual soil loss per hectare per year.
A = R * K * LS * C * P (5)
Where: A= is the computed spatial average soil loss (ton/ha/year),
R= the rainfall erosivity factor (MJ mm/ (ha h yr)),
K= the soil erodibility factor (t ha h/ (ha MJ mm))
LS= the slope length and slope steepness factor (dimensionless)
C = Cover factor (dimensionless)
P = Conservation practice factor (dimensionless).
2.5. Data Analysis
Data analysis and processing were made by digitizing, calculating and classifying the necessary information of each thematic layers using Arc GIS. Furthermore, some simple statistical methods, such as percentage, and average were also employed for the analysis and interpretations.
3. Result and Discussion
3.1. Estimation of Soil Erosion Factor Values
3.1.1. Rainfall Erosivity Factor (R)
The distribution of average annual rainfall of the study area for 32 years period is different from place to place in the watershed. The result depicted that the rainfall of the study watershed areas ranged between 1213.78 mm to 1293.18 mm and the study watershed R-values fall within the range from 674.02 to 718.65 MJmm ha-1 yr-1 as shown in the (Figure 3). The average R factor value in the watershed was 695.76 MJmm ha-1 yr-1, which are within the ranges of estimated erosivity factor value for Jabi Tehinan Woreda, ANRS, and Ethiopia from 441.5 to 1166.4 MJmm ha-1 yr-1.
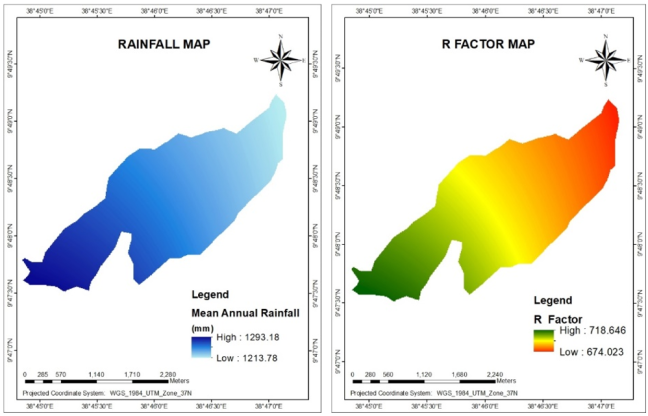
Figure 3. Mean annual RF and R-factor map of the watershed.
3.1.2. Soil Erodibility Factor (K-Values)
Two major soil types were identified from the study watershed including Orthic Luvisols, and Pellic Vertisols. The erodibility values and their proportion from the total area of the watershed are Orthic Luvisols- 0.20 (70.77%), and Pellic Vertisols- 0.15 (29.23%) (Table 4). The soils of the study area contain two distinctive erodibility values which range from 0.15 to 0.20. Higher value indicates more susceptibility while lower value indicates less susceptibility to erosion. The soil in the study area is dominated by Orthic Luvisols having brown to dark brown soil color. According to , soils have brown soil color and high in sand content were structurally weak which contribute to easy soil disintegration. Therefore, they were easily detached and transported by runoff (Figure 4).
Table 4. Soil types, coverage and K value based on [25, 30].

No.

Soil types

Soil color

K-value

Area (ha)

Area (%)

1

Orthic Luvisols

Brown to dark brown

0.2

403.32

70.77

2

Pellic Vertisols

Black

0.15

166.03

29.23

3.1.3. Slope Length and Slope Steepness Factor (LS-Values)
Interaction of angle and length of slope has an effect on the magnitude of erosion. As a result of this interaction, the effect of slope length and degree of slope should always be considered together . The result depicted that, the LS factors of the study area ranges from 0 in flat areas to 1842.23 steeper and longer slope area of the watershed. The increments of LS factors from 0 to 1842.23 shows that the potential erosion increases as the slope steepness increases. This clearly shows that the landform of the study area contributes to high soil loss rate. The steeper and longer slopes are combined in 68.95% of the area resulting to higher runoff velocities and, therefore, greater potential for erosion. Longer, steeper slopes especially those without adequate vegetative cover are more susceptible to very high rates of erosion during heavy rains than shorter, less steep slopes . The data shows that factors considering the topography (LS factor) are affecting in a stronger way the erosion process (Figure 5).
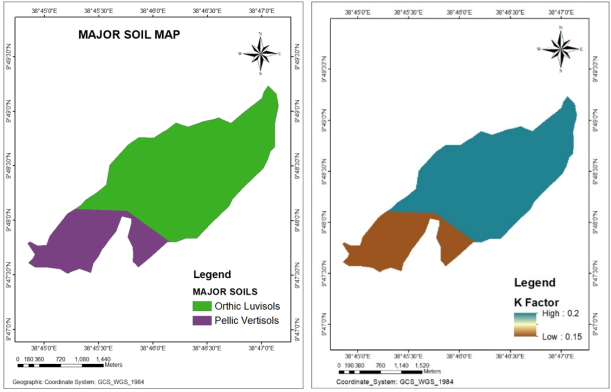
Figure 4. Soil types and K-factor map of the watershed.
3.1.4. Crop Management Factor (C-Values)
Based on the analysis, the study watershed LULC was classified into seven classes namely agricultural land, forest land, degraded forest land, shrubs, grazing land, bare land and settlement area. Agricultural land is the dominant land use type in the study watershed which covers 50.65% (288.33 ha) of the total study area, while other land use covers 49.35% (311.02ha) as shown in the (Table 5). The C-factor result for the study watershed ranges from 0.001 for the area covered by forest to 0.6 bare land. Based on the study area LULC result, there is variation on C-factor value. Thus, bare land has maximum C-value. This condition results to higher soil erosion rate. The study shows that bare surfaces of the land produce much run-off, leaving it susceptible to soil erosion (Figure 6).
Table 5. LULC area coverage and their C values suggested by different authors for different land use land cover.

Land cover

C-value

Area (ha)

Area (%)

Agricultural land

0.15

288.33

50.65

Forest

0.001

10.51

1.85

Degraded forest

0.005

23.90

4.20

Shrub land

0.014

110.27

19.37

Grazing land

0.01

73.29

12.87

Bare land

0.6

54.10

9.50

Settlement area

0.09

8.95

1.57

Total

569.35

100

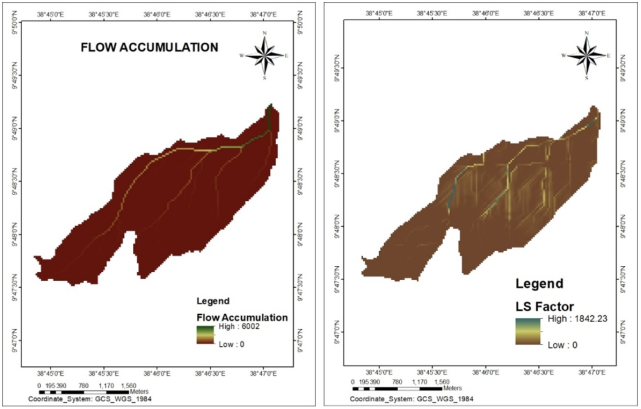
Figure 5. Flow accumulation and LS-factor map of the watershed.
3.1.5. Conservation Practice Factor (P)
In the study watershed, there is only a small part of watershed area was treated by terracing, periodic maintenance of structure by land users was ignored. Such condition coupled with poor vegetation cover in watershed area has large influence on soil loss rate. The result of the study shows that, the minimum p-value is 0.1 for the cultivated land with a slope of less than 5% and the maximum P-value is 1 which is the value assigned for other land use types excluding agricultural land (Figure 7). defined conservation practice factor as an expression of supporting conservation practices such as contour farming, strip cropping, terracing, and subsurface drainage on soil loss at a particular site, which principally affect water erosion by modifying the flow pattern, grade, or direction of surface runoff and by reducing the volume and rate of runoff.
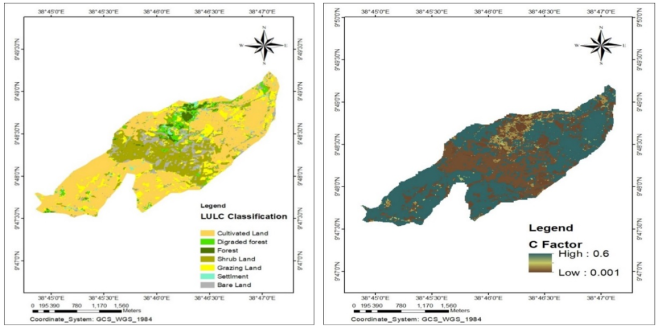
Figure 6. Land use land cover and C-factor map of the watershed.
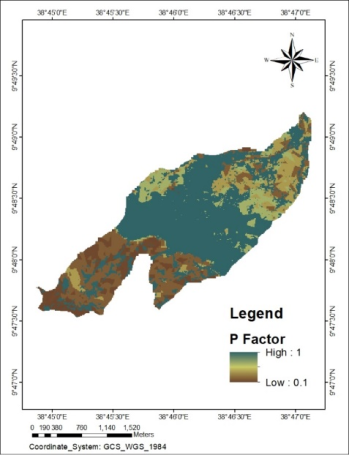
Figure 7. P-factor map of the watershed.
3.1.6. Total Soil Loss Analysis (A)
The annual soil loss rate of the study watershed was determined by a cell-by–cell analysis of each RUSLE factors.
Table 6. Annual soil loss rates and severity classes with their conservation priority in the watershed .

Soil loss (t ha−1 y−1)

Severity class

Priority classes

Area (ha)

Area (%)

<2

Very slight

VII

93.52

16.43

2-5

Slight

VI

17.53

3.08

5-10

Moderate

V

22.37

3.93

10–50

High

IV

128.35

22.54

50-100

Severe

III

79.19

13.91

100-500

Very severe

II

141.68

24.89

>500

Catastrophic

I

86.68

15.23

Total

569.35

100.00

The annual soil loss rate of the study watershed ranges from <2 tones ha-1 yr-1 in the flat areas to over 500 tones ha-1 yr-1 in very steep slope of the watershed. The mean annual soil loss rate estimated by the RUSLE model for the study watershed was 44.67 tones ha-1 yr-1 from 569.35 ha. The amount of estimated annual average soil loss rate for the study watershed is high as compared to the past studies. For example, reported 30.4 tones ha-1 yr-1 soil loss for Jabi Tehinan woreda in the north western high land, while estimated the soil loss from Loma woreda as 10.28 tones ha-1 yr-1. Similarly, estimated soil loss due to erosion of Medego watershed as 9.63 tons ha-1 yr-1; estimated that soil loss due to erosion of cultivated fields in Ethiopia amounts to about 42 tones ha-1 yr-1; and in the past, reported the annual average soil loss rate for Central and Northern high land as 35 tones ha-1 yr-1. Therefore, the relatively high estimated average annual soil loss in the current study watershed could be due to the topography, which is largely sloping (8-15%) to very steep (>50%), which accounts for 65.24% of the watershed area. The other reason could be due to only a small part of the watershed area was treated by terracing, and the absence of periodic maintenance of constructed conservation structures by land users.
3.2. Classification and Prioritization of Critical Erosion Prone Area for Conservation Planning
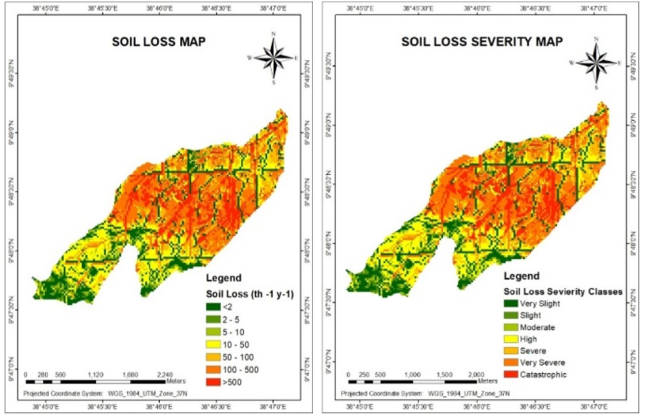
Figure 8. Annual soil loss map of the watershed.
Therefore, regarding delineation of watershed as erosion prone areas according to the severity level of soil loss, priority is given for a targeted and cost-effective conservation planning . The result of the study shows that, the total annual soil loss potential of the study watershed less than 2 tones ha-1 yr-1 was classified as very slight, 2-5 tones ha-1 yr-1 as slight, 5-10 tones ha-1 yr-1 as moderate and 10-50 tones ha-1 yr-1 as high, 50-100 tones ha-1 yr-1 as severe, 100-500 tones ha-1 yr-1 as very severe, and >500 tones ha-1 yr-1 as catastrophic soil erosion severity classes (Table 6). The final risk classes were prioritized for intervention on the bases of the maximum allowable soil loss that will sustain an economic and a high level of productivity .
Based on result, the mean annual soil loss rate for the entire watershed (44.67 tons ha-1 yr-1) is above the tolerable soil loss of 5-11 tons ha-1 yr-1 estimated for Ethiopia by . The results of the study show that about 23.44% of the watershed area undergoes moderate to very slight erosion classes, 22.54% high erosion class, 38.8% from severe to very severe erosion classes, and 15.23% catastrophic erosion class, according to Morgan classification as shown in the Table 6. In the study area watershed slope classes, the largest soil loss rate could be mainly due to high erosivity (R-factor) value from heavy rainfall, erodibility (K-factor), high LS-value especially slope steepness, soils without support practice factors (P=1). Field observation report depicted that, the steeper parts of the land slope lack vegetative cover coupled with intensive tillage operation, inadequate soil and water conservation measures; also, ignorance of land users to periodically maintain structures such as removing sediment from the channel and repairing the embankment was the major problems identified and resulted to high soil loss potential in this area.
4. Conclusion
The mean annual soil loss estimated in Muziye watershed was 44.67 tons ha-1yr-1 from 569.35 ha. The results show that about 23.44% of the watershed area undergoes moderate (5-10 tones ha-1yr-1) to very slight (>2 tones ha-1yr-1) erosion classes, 22.54% high (10-50 tones ha-1 yr-1) erosion class, 38.8% from severe (50-100 tones ha-1yr-1) to very severe (100-500 tones ha-1yr-1) erosion classes, and 15.23% catastrophic (>500 tones ha-1yr-1) erosion class, according to classification. The soil loss in the study watershed is aggravated by topographic factor especially slope steepness factor, high rainfall erosivity (R-factor) from heavy rainfall, high erodibility (k-factor) and poor conservation practice factors which could finally cause changes in the hydrological, and biological, resulting to lack of services that the soil offers to human beings. This influences annual crop production and land productivity impacting local farmer’s food. The erosion severity may also have off-site sedimentation effect in the water bodies.
5. Recommendation
To decrease the amount of soil loss in the study area, the following watershed rehabilitation measures should be recommended. High to catastrophic erosion risk areas of the watershed requires various bio-physical soil and water conservation measures that intercept runoff by decreasing the transport capacity of flow and improving soil infiltration in the steep slope based on soil type, slope of the land and agro-ecology of the area. Rehabilitating hillside slope areas with different indigenous and exotic tree species should be embarked upon by participating farmers in conservation strategies from plan preparation to implementation. Soil erosion hot spot areas that were identified in the soil erosion map should be given a serious attention and priorities for implementing soil conservation activities before the areas reached to irreversible soil degradations.
Abbreviations

°C

Degree Celsius

DEM

Digital Elevation Model

GIS

Geographical Information System

GPS

Geographical Positioning System

Ha

Hectare

HH

Household

Km

Kilometer

LULC

Land Use and Land Cover

MoA

Ministry of Agriculture

mm

Millimeter

m

Meter

RUSLE

Revised Universal Soil Loss Equation

Yr

Year

Acknowledgments
The authors gratefully acknowledged Oromia Agricultural Research Institute for providing financial fund for this research activity. And also, we extend our acknowledgement for all staff members of Fitche agricultural research center who directly or indirectly helped in data collection and other research activities.
Conflicts of Interest
The authors declare no conflicts of interest.
References
[1] Abate Shiferaw, A. S. (2011). Estimating soil loss rates for soil conservation planning in the Borena Woreda of South Wollo Highlands, Ethiopia.
[2] Hurni, H. (2002). Current international actions for furthering the sustainability use of soils. Symposium paper no. 63 on 17th WCSS, 14–21 August 2002, p 8.
[3] Blanco, H., & Lal, R. (2008). Principles of soil conservation and management (Vol. 167169). New York: Springer.
[4] Bewket, W., & Teferi, E. (2009). Assessment of soil erosion hazard and prioritization for treatment at the watershed level: case study in the Chemoga watershed, Blue Nile basin, Ethiopia. Land degradation & development, 20(6), 609-622.
[5] Kebede Wolka, K. W., Habitamu Tadesse, H. T., Efrem Garedew, E. G., & Fantaw Yimer, F. Y. (2015). Soil erosion risk assessment in the Chaleleka wetland watershed, Central Rift Valley of Ethiopia.
[6] Gelagay, H. S., & Minale, A. S. (2016). Soil loss estimation using GIS and Remote sensing techniques: A case of Koga watershed, Northwestern Ethiopia. International Soil and Water Conservation Research, 4(2), 126-136.
[7] Haregeweyn, N., Tsunekawa, A., Poesen, J., Tsubo, M., Meshesha, D. T., Fenta, A. A., Nyssen, J., Adgo, E. (2017). Comprehensive assessment of soil erosion risk for better land use planning in river basins: case study of the Upper Blue Nile River. Sci. Total Environ. 574, 95–108.
[8] Hurni, H., Giger, M., Liniger, H., Mekdaschi Studer, R., Messerli, P., Portner, B., Schwilch, G., Wolfgramm, B., Breu, T. (2015). Soils, agriculture and food security: the interplay between ecosystem functioning and human well-being. Curr. Opin. Environ. Sustain. (15), 25–34.
[9] Reusing, M., Schneider, T., & Ammer, U. (2010). Modelling soil loss rates in the Ethiopian Highlands by integration of high-resolution MOMS-02/D 2-stereo-data in a GIS.
[10] Amsalu, N., Bezie, Y., Fentahun, M., Alemayehu, A., Amsalu, G. (2018). Use and conservation of medicinal plants by indigenous people of Gozamin Wereda, East Gojjam Zone of Amhara Region, Ethiopia: an ethnobotanical approach. Evid. Based Complement.
[11] Moges, D. M., Bhat, H. G. (2018). An insight into land use and land cover changes and their impacts in Rib watershed, north-western highland Ethiopia. Land Degrad. Dev. 29(10), 3317–3330.
[12] Mati, B. M., Morgan, R. P., Gichuki, F. N., Quinton, J. N., Brewer, T. R., & Liniger, H. P. (2000). Assessment of erosion hazard with the USLE and GIS: A case study of the Upper Ewaso Ng'iro North basin of Kenya. International Journal of Applied Earth Observation and Geoinformation, 2(2), 78-86.
[13] Hurni, H., Kebede T., and Gete Z. (2005). The Implications of Changes in Population, Land Use, and Land Management for Surface Runoff in the Upper Nile Basin Area of Ethiopia. Mountain Research and Development. Vol. 25 No. 2: 147–154.
[14] EFAP (Ethiopian Forestry Action Program). (1993). Ethiopian Forestry Action Program: the challenge for development, vol 2. Ministry of Natural Resources Development and Environmental Protection, Addis Ababa.
[15] Taddese G (2001) Land degradation: a challenge to Ethiopia. Environ Manage 27: 815–824.
[16] Ministry of Agriculture and Rural Development (MoARD). (2010). Ethiopia’s Agricultural Sector Policy and Investment Framework (PIF) 2010–2020. Draft Final Report, p 39.
[17] Menale, K., Mahmud, Y., Köhlin, G. (2009). The role of production risk in sustainable land-management technology adoption in the Ethiopian Highlands. Working papers in economics, No 407. Gothenburg: University of Gothenburg, p 25.
[18] Nigussie, H., Ademnur, B., Atsushi, T., Mitsuru, T., Derege, T. (2012). Integrated water shed management as an effective approach to curb land degradation: a case study of the Enabered watershed in northern Ethiopia. Environ Manage 50: 1219–1233.
[19] Desta, L., Carucci, V., Wendem-Agenehu, A., & Abebe, Y. (2005). Community-based participatory watershed development. a guideline.
[20] Gete, Z. (2006). Integrated management of watershed experiences in Eastern and Central Africa: Lessons from Ethiopia. In: Shiferaw B and Rao KPC (eds): Integrated management of watersheds for agricultural diversification and sustainable livelihoods in Eastern and Central Africa: lessons and experiences from semi-arid South Asia. Proceedings of the international workshop held at ICRIS at Nairobi, 6–7 December 2004, p 120.
[21] Mirco, G., Robert, J. A. J., Ezio, R., Luca, M. (2003). Soil Erosion Risk using revised USLE approach in Italy 11: 28.
[22] Girar Jarso Woreda Agriculture and Rural Development Office. (2022). Annual Report on Natural resource Conservation of Girar Jarso woreda, Ethiopia.
[23] Alexakis, D. D., Hadjimitsis, D. G., & Agapiou, A. (2013). Integrated use of remote sensing, GIS and precipitation data for the assessment of soil erosion rate in the catchment area of “Yialias” in Cyprus. Atmospheric Research, 131, 108-124.
[24] Tadesse, A., Abebe, M. (2014). GIS based soil loss estimation using RUSLE Model: the case of Jabi Tehinan Woreda, ANRS. Ethiopia. Natural Resource 5: 616–626.
[25] Hurni, H. (1985). Erosion-productivity-conservation systems in Ethiopia.
[26] Derege, T., Atsushi, T., Mitsuru, T., Nigussie, H. (2012). Dynamics and hotspots of soil erosion and management scenarios of the Central Rift Valley of Ethiopia. Int J Sed Res 27: 84–99.
[27] Wischmeier, W. H., & Smith, D. D. (1978). Predicting rainfall erosion losses: a guide to conservation planning (No. 537). Department of Agriculture, Science and Education Administration.
[28] Robert, P. S., & Hilborn, D. (2000). Factsheet: universal soil loss equation (USLE). Index No-572/751, Queen, s printer for Ontario.
[29] FAO. (2012). A National Soil Model of Ethiopia A geostatistical approach to create a national soil map of Ethiopia on the basis of an SRTM 90 DEM and SOTWIS soil data. Master's Thesis. Faculty of Natural Sciences University of Bern, Switzerland P 126.
[30] Helldén, U. (1987). An assessment of woody biomass, community forests, land use and soil erosion in Ethiopia. A feasibility study on the use of remote sensing and GIS-analysis for planning purposes in developing countries (pp. 75-pp).
[31] Kamaludin, H., Lihan, T., Ali Rahman, Z., Mustapha, M. A., Idris, W. M. R., & Rahim, S. A. (2013). Integration of remote sensing, RUSLE and GIS to model potential soil loss and sediment yield (SY). Hydrology and Earth System Sciences Discussions, 10(4), 4567-4596.
[32] Morgan RPC (2005) Soil erosion and conservation, 3rd edn. Blackwell Science, Oxford.
[33] Ganasri, B. P., & Ramesh, H. (2015). Assessment of soil erosion by RUSLE model using remote sensing and GIS-A case study of Nethravathi Basin. Geoscience Frontiers, 7(6), 953-961.
[34] Renard, K. G., Foster, G. R., Weesies, G. A., Porter, J. P. (1997). RUSLE: Revised Universal Soil Loss Equation. J Soil Water Conservation 46(1): 30–33.
[35] Amsalu, T., & Mengaw, A. (2014). GIS based soil loss estimation using RUSLE model: the case of Jabi Tehinan Woreda, ANRS, Ethiopia. Natural Resources, 2014.
[36] Adediji, A., Tukur, A. M., & Adepoju, K. A. (2010). Assessment of revised universal soil loss equation in Katsina area, Katsina state of Nigeria using remote sensing (RS) and geographic information system (GIS). Iranica Journal of Energy & Environment, 1(3).
[37] Van der Knijff, J. M., Jones, R. J. A., & Montanarella, L. (2000). Soil erosion risk assessment in Europe.
[38] Renard, K. G. (1997). Predicting soil erosion by water: a guide to conservation planning with the Revised Universal Soil Loss Equation (RUSLE). US Department of Agriculture, Agricultural Research Service.
[39] Morgan, R. P. C. (2009). Soil erosion and conservation. John Wiley & Sons.
[40] Gerawork, B., & Moges, A. (2014). Spatial erosion hazard assessment for proper intervention in the case of gibe‐iii dam catchment, southwest Ethiopia (Doctoral dissertation, MSc Thesis, Haramaya University).
[41] Gebreyesus, B., Kirubel, M. (2009). Estimating soil loss using Universal Soil Loss Equation for soil conservation planning at Medego Watershed, Northern Ethiopia. J Am Sci 5(1): 58–69.
[42] Hurni, H., Herweg, K., Portner, B., & Liniger, H. (2008). Soil erosion and conservation in global agriculture. Land use and soil resources, 41-71.
[43] FAO. (1986). Ethiopian highlands reclamation study. Final Report.
[44] Kaltenrieder, J. (2007). Adaptation and validation of the Universal Soil Loss Equation (USLE) for the Ethiopian-Eritrean highlands (thesis). Centre for Development and Environment, Geographisches Institut, University of Bern.
Cite This Article
  • APA Style

    Begna, E. B., Ayansa, W. A. (2025). GIS-Based Soil Erosion Assessment and Severity Mapping Using RUSLE Model for Planning of Conservation Measures at Selected Watershed in North Shewa Zone, Oromia, Ethiopia. International Journal of Environmental Monitoring and Analysis, 13(3), 74-86. https://doi.org/10.11648/j.ijema.20251303.11

    Copy | Download

    ACS Style

    Begna, E. B.; Ayansa, W. A. GIS-Based Soil Erosion Assessment and Severity Mapping Using RUSLE Model for Planning of Conservation Measures at Selected Watershed in North Shewa Zone, Oromia, Ethiopia. Int. J. Environ. Monit. Anal. 2025, 13(3), 74-86. doi: 10.11648/j.ijema.20251303.11

    Copy | Download

    AMA Style

    Begna EB, Ayansa WA. GIS-Based Soil Erosion Assessment and Severity Mapping Using RUSLE Model for Planning of Conservation Measures at Selected Watershed in North Shewa Zone, Oromia, Ethiopia. Int J Environ Monit Anal. 2025;13(3):74-86. doi: 10.11648/j.ijema.20251303.11

    Copy | Download

  • @article{10.11648/j.ijema.20251303.11,
      author = {Endale Bedada Begna and Woubalem Abera Ayansa},
      title = {GIS-Based Soil Erosion Assessment and Severity Mapping Using RUSLE Model for Planning of Conservation Measures at Selected Watershed in North Shewa Zone, Oromia, Ethiopia
    },
      journal = {International Journal of Environmental Monitoring and Analysis},
      volume = {13},
      number = {3},
      pages = {74-86},
      doi = {10.11648/j.ijema.20251303.11},
      url = {https://doi.org/10.11648/j.ijema.20251303.11},
      eprint = {https://article.sciencepublishinggroup.com/pdf/10.11648.j.ijema.20251303.11},
      abstract = {Soil erosion is a common phenomenon in many parts of Ethiopian and it remains difficult to quantify and measure the amount of soil erosion. GIS provides spatial information to identify erosion potential areas and useful tools to estimate the annual soil loss based on Revised Universal Soil Loss Equation. The aim of this research was to estimate the annual soil loss from the watershed and to map soil erosion factors for planning and implementation of sustainable soil conservation and management system in the watershed. RUSLE model was employed rainfall erosivity factor, soil erodibility factor, topography factor, vegetation cover factor, management factor. The mean annual soil loss estimated in watershed was 44.67 tones ha-1yr-1 from 569.35 ha. The results revealed that about 23.44% of the watershed area undergoes moderate (5-10 tones ha-1 yr-1) to very slight (>2 tones ha-1 yr-1) erosion classes, 22.54% high (10-50 tones ha-1 yr-1) erosion class, 38.8% from severe (50-100 tones ha-1 yr-1) to very severe (100-500 tones ha-1 yr-1) erosion classes, and 15.23% catastrophic (>500 tones ha-1 yr-1) erosion class. Based on the findings it is recommended that, high to catastrophic erosion risk area of the watershed requires various soil and water conservation measures that intercept runoff by decreasing the transport capacity of flow and improving soil infiltration in the steep slope and rehabilitating hillside slope areas with different indigenous and exotic tree species should be embarked upon by participating farmers from plan preparation to implementation. Soil erosion hot spot areas that were identified in the soil erosion map should be given a serious attention and priorities for implementing soil conservation activities before the areas reached to irreversible soil degradations.
    },
     year = {2025}
    }
    

    Copy | Download

  • TY  - JOUR
    T1  - GIS-Based Soil Erosion Assessment and Severity Mapping Using RUSLE Model for Planning of Conservation Measures at Selected Watershed in North Shewa Zone, Oromia, Ethiopia
    
    AU  - Endale Bedada Begna
    AU  - Woubalem Abera Ayansa
    Y1  - 2025/06/23
    PY  - 2025
    N1  - https://doi.org/10.11648/j.ijema.20251303.11
    DO  - 10.11648/j.ijema.20251303.11
    T2  - International Journal of Environmental Monitoring and Analysis
    JF  - International Journal of Environmental Monitoring and Analysis
    JO  - International Journal of Environmental Monitoring and Analysis
    SP  - 74
    EP  - 86
    PB  - Science Publishing Group
    SN  - 2328-7667
    UR  - https://doi.org/10.11648/j.ijema.20251303.11
    AB  - Soil erosion is a common phenomenon in many parts of Ethiopian and it remains difficult to quantify and measure the amount of soil erosion. GIS provides spatial information to identify erosion potential areas and useful tools to estimate the annual soil loss based on Revised Universal Soil Loss Equation. The aim of this research was to estimate the annual soil loss from the watershed and to map soil erosion factors for planning and implementation of sustainable soil conservation and management system in the watershed. RUSLE model was employed rainfall erosivity factor, soil erodibility factor, topography factor, vegetation cover factor, management factor. The mean annual soil loss estimated in watershed was 44.67 tones ha-1yr-1 from 569.35 ha. The results revealed that about 23.44% of the watershed area undergoes moderate (5-10 tones ha-1 yr-1) to very slight (>2 tones ha-1 yr-1) erosion classes, 22.54% high (10-50 tones ha-1 yr-1) erosion class, 38.8% from severe (50-100 tones ha-1 yr-1) to very severe (100-500 tones ha-1 yr-1) erosion classes, and 15.23% catastrophic (>500 tones ha-1 yr-1) erosion class. Based on the findings it is recommended that, high to catastrophic erosion risk area of the watershed requires various soil and water conservation measures that intercept runoff by decreasing the transport capacity of flow and improving soil infiltration in the steep slope and rehabilitating hillside slope areas with different indigenous and exotic tree species should be embarked upon by participating farmers from plan preparation to implementation. Soil erosion hot spot areas that were identified in the soil erosion map should be given a serious attention and priorities for implementing soil conservation activities before the areas reached to irreversible soil degradations.
    
    VL  - 13
    IS  - 3
    ER  - 

    Copy | Download

Author Information
  • Oromia Agricultural Research Institute, Fitche Agricultural Research Center, Fitche, Oromia

  • Oromia Agricultural Research Institute, Fitche Agricultural Research Center, Fitche, Oromia

  • Abstract
  • Keywords
  • Document Sections

    1. 1. Introduction
    2. 2. Material and Methods
    3. 3. Result and Discussion
    4. 4. Conclusion
    5. 5. Recommendation
    Show Full Outline
  • Abbreviations
  • Acknowledgments
  • Conflicts of Interest
  • References
  • Cite This Article
  • Author Information