Socio-economic and biophysical resource characterization builds necessary foundation for the plan and obtains proper information for elective planning, implementation and monitoring of the research in the field of natural resources. The objective of the study was to identify and characterize existing socio-economic and biophysical resources and document baseline information on socio-economic and biophysical aspects used as benchmark for planning and impact monitoring in the watershed. The site was selected depending on agro-ecological representation, prevalence of resource management and land degradation problems. The data were collected through field observations, HH survey, FGD and KII’s and the collected data were analyzed using SPSS software. Results of study indicated that, decline of soil fertility, soil erosion, and shortage of agricultural inputs are the major crop production constraints in the watershed. According to the results, the farmers majorly implemented physical SWC measures such as stone bund, stone faced soil bund, water ways. About 97.7%, of the sample farmers in the Gur watershed were participating in construction of SWC measures by their own interest respectively. Analysis of the result shows that the major constraints in practicing of physical SWC structures were serves as breed and hiding places of rodents, it requires large number of labors and lack of training to construct. According to the field measurement data of implemented stone bund in most sample sites of the study watershed failed to meet the standards. Based on the above findings, enhancing the farmers’ awareness on the importance of SWC structures and based on their agro-ecologies promotion different introduced physical, biological and agronomic SWC measures were recommended.
| Published in | International Journal of Environmental Monitoring and Analysis (Volume 13, Issue 3) |
| DOI | 10.11648/j.ijema.20251303.14 |
| Page(s) | 103-113 |
| Creative Commons |
This is an Open Access article, distributed under the terms of the Creative Commons Attribution 4.0 International License (http://creativecommons.org/licenses/by/4.0/), which permits unrestricted use, distribution and reproduction in any medium or format, provided the original work is properly cited. |
| Copyright |
Copyright © The Author(s), 2025. Published by Science Publishing Group |
Baseline, Constraints, Intervention, Households
Characters of HH heads | Categories of characters | Frequency |
|---|---|---|
Gender | Male | 39(88.6%) |
Female | 5(11.4%) | |
Total | 44(100%) | |
Age | Min | 24 |
Max | 72 | |
Mean | 44.3 | |
20-60 | 41(93.2%) | |
>60 | 3(6.8%) | |
Total | 44(100%) | |
Marital status | Married | 41(93.2%) |
Widowed | 3(6.8%) | |
Total | 44(100%) | |
Education level | Uneducated | 29(65.9%) |
Elementary | 14(31.8%) | |
Secondary | 1(2.3%) | |
Total | 44(100%) | |
HH family size | Min | 2 |
Max | 10 | |
Mean | 5.6 | |
HH Land holdings (ha) | Min | 0.4 |
Max | 6 | |
Mean | 2.2 | |
<1 | 7(15.91%) | |
1-2 | 13(29.55%) | |
2-3 | 12(27.27%) | |
3-4 | 7(15.91%) | |
>4 | 5(11.36%) | |
Total | 44(100%) |
Crop type | Frequency | Productivity (qt/ha) |
|---|---|---|
Teff | 30(68.2%) | 8 |
Wheat | 24(54.5%) | 10 |
Vetch | 21(47.7%) | 9 |
Faba bean | 17(38.6%) | 7 |
Chickpea | 8(18.2%) | 8 |
Major Constraints | Frequency | RBQ | Rank |
|---|---|---|---|
Soil erosion | 31(70.5%) | 39.1 | 4 |
Soil fertility | 32(72.7%) | 58.2 | 1 |
Land shortage | 25(56.8%) | 56.3 | 2 |
Deforestation | 20(45.5%) | 11.3 | 8 |
Climate change | 23(52.3%) | 30.5 | 6 |
Agricultural inputs | 32(72.7%) | 21.9 | 7 |
Crop disease | 33(75%) | 55.1 | 3 |
Crop productivity | 24(54.5%) | 30.5 | 5 |
Source of income | Frequency |
|---|---|
Crop production | 12(27.8%) |
Livestock production | 7(15.9%) |
Off farm activities | 4(9.1%) |
Crop & Livestock production | 11(25.0%) |
Crop production & Off farm activities | 8(18.2%) |
Livestock production & Off farm activities | 2(4%) |
Total | 44(100%) |
Do you get extension service? | Frequency | |
|---|---|---|
In (#) | In (%) | |
Yes | 37 | 84.1 |
No | 7 | 15.9 |
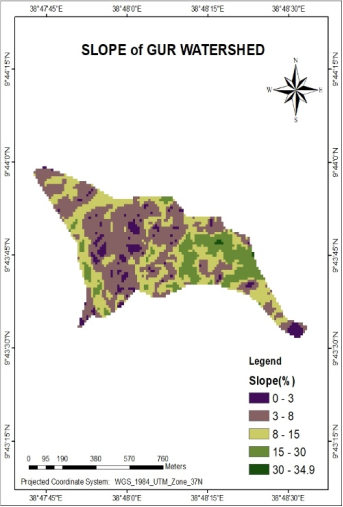
Slope Class | Area (ha) | Area (%) |
|---|---|---|
Flat or almost flat (0-3%) | 37.3 | 7.4 |
Gently sloping (3-8%) | 164.5 | 32.6 |
Sloping (8-15%) | 176.6 | 35 |
Moderately steep (15-30%) | 114.5 | 22.7 |
Steep (30-50%) | 11.7 | 2.3 |
Total | 504.6 | 100 |
Types of conservation measures | Frequency | ||
|---|---|---|---|
In (#) | In (%) | ||
Physical SWC measures | Terracing | 4 | 12.5 |
Soil bunds | 17 | 53.1 | |
Stone bunds | 28 | 87.5 | |
Stone faced soil bunds | 26 | 81.3 | |
Cutoff drain | 29 | 90.6 | |
Water way | 30 | 93.8 | |
Gully control | Stone check dam | 6 | 18.8 |
Brush wood | 5 | 15.6 | |
Agronomic and Biological SWC measures | Contour plowing | 14 | 43.8 |
Tree planting | 3 | 9.4 | |
Do you participate in any SWC works? | Frequency | |
|---|---|---|
In (#) | In (%) | |
Yes | 43 | 97.7 |
No | 1 | 2.3 |
Are you maintain SWC measures | Frequency | |
|---|---|---|
In (#) | In (%) | |
Yes | 37 | 84.1 |
No | 7 | 15.9 |
Watershed | Major constraints | Frequency | RBQ | Rank |
|---|---|---|---|---|
Gur watershed | Require large labor | 26 | 77.5 | 2 |
Difficult to plough and turn the oxen | 21 | 65.6 | 4 | |
Lack of construction material | 22 | 56.9 | 5 | |
Breed and hiding places of rodents | 30 | 83.1 | 1 | |
Lack of training | 22 | 66.9 | 3 |
Watershed position | Parameters | Implemented | Recommended | Deviation | ||||||
|---|---|---|---|---|---|---|---|---|---|---|
Site 1 | Site 2 | Site 3 | Site 1 | Site 2 | Site 3 | Site 1 | Site 2 | Site 3 | ||
Upper | Slope in (%) | 8 | 10 | 12 | 5-10 | 10-15 | 10-15 | |||
Eh (cm) | 45 | 50 | 50 | 70-100 | 70-100 | 70-100 | -25 | -20 | -20 | |
Ebw (cm) | 55 | 50 | 60 | 75 | 75 | 75 | -20 | -25 | -25 | |
Etw (cm) | 50 | 50 | 60 | 30-40 | 30-40 | 30-40 | 10 | 10 | 20 | |
Length (m) | 85 | 90 | 75 | 60-80 | 60-80 | 60-80 | 5 | 10 | 0 | |
VI (m) | 1 | 1.4 | 1.6 | 1 | 2.2 | 2.2 | 0 | -0.8 | -0.6 | |
Spacing (m) | 30 | 28 | 25 | 20 | 12 | 12 | 10 | 16 | 13 | |
Middle | Slope in (%) | 22 | 18 | 24 | 20-25 | 15-20 | 20-25 | |||
Eh (cm) | 55 | 50 | 60 | 70-100 | 70-100 | 70-100 | -15 | -20 | -10 | |
Ebw (cm) | 60 | 50 | 70 | 75 | 75 | 75 | -15 | -25 | -5 | |
Etw (cm) | 60 | 45 | 60 | 30-40 | 30-40 | 30-40 | 20 | 20 | 20 | |
Length (m) | 60 | 70 | 45 | 60-80 | 60-80 | 60-80 | 0 | 0 | -15 | |
VI (m) | 1.6 | 1.5 | 2 | 2.5 | 2.2 | 2.5 | -0.9 | -0.7 | -0.9 | |
Spacing (m) | 24 | 26 | 15 | 8 | 12 | 8 | 16 | 14 | 7 | |
Lower | Slope in (%) | 16 | 22 | 18 | 15-20 | 20-25 | 15-20 | |||
Eh (cm) | 55 | 50 | 60 | 70-100 | 70-100 | 70-100 | -15 | -20 | -10 | |
Ebw (cm) | 50 | 65 | 60 | 75 | 75 | 75 | -25 | -10 | -15 | |
Etw (cm) | 50 | 50 | 55 | 30-40 | 30-40 | 30-40 | 10 | 10 | -15 | |
Length (m) | 75 | 70 | 65 | 60-80 | 60-80 | 60-80 | 0 | 0 | 5 | |
VI (m) | 1.6 | 2 | 2.2 | 2.2 | 2.5 | 2.2 | -0.6 | -0.2 | 0 | |
Spacing (m) | 20 | 8 | 12 | 12 | 8 | 12 | 8 | 0 | 2 | |
DAs | Development Agents |
Ebw | Embankment Bottom Width |
Eh | Embankment Height |
Etw | Embankment Top Width |
FGD | Focus Group Discussion |
GDP | Gross Domestic Product |
GPS | Geographical Positioning System |
ha | Hectare |
HH | Household |
In (#) | In Number |
In (%) | In Percent |
KII | Key Informant Interview |
m | Meter |
qt | Quintal |
RBQ | Rank Based Quotient |
SPSS | Statistical Package for Social Science |
SWC | Soil and Water Conservation |
VI | Vertical Interval |
| [1] | FAO. (2016). Trade Reforms and Food security: Conceptualizing the linkages. World Health Organization- on line |
| [2] | MOA (Ethiopia Ministry of Agriculture), 2010. “Animal and Plant Health Regulatory Directorate.” Crop Variety Register 13. |
| [3] | Danyo, S., Abate, A., Bekhechi, M., Köhlin, G., Medhin, H., Mekonnen, A., & Wikman, A. (2017). Realizing Ethiopia’s green transformation: Country environmental analysis, environment and natural resources global practice. Washington, DC: World Bank. |
| [4] | IFAD., (2016). Federal Democratic Republic of Ethiopia. Country strategic opportunities programme. Executive Board—119th Session. Rome. |
| [5] | Rhoades R E and Elliot T S., 2000. Participatory watershed research and management: where the shadow falls”. London: International institute for Economic Development (IIED). |
| [6] | Abbaspour, K. C., Rouholahnejad, E., Vaghefi, S, Srinivasan, R., Yang, H., & Kløve, B. (2015). A continental-scale hydrology and water quality model for Europe: Calibration and uncertainty of a high-resolution large-scale SWAT model. Journal of hydrology, 524, 733-752. |
| [7] | Gebregziabher, G., Abera, D. A., Gebresamuel, G., Giordano, M., & Langan, S. (2016). An assessment of integrated watershed management in Ethiopia (Vol. 170). International Water Management Institute (IWMI). |
| [8] | Brooks, K. N., F folliott, P. F., Gregerson, H. M., & DeBano, L. F. (2003). Hydrology and the Management of Watersheds. Third edition, Iowa State Press, Blackwell Publishing Company. |
| [9] | Girar Jarso Woreda Agriculture and Rural Development Office. (2022). Annual Report on Natural resource Conservation of Girar Jarso woreda, Ethiopia. |
| [10] | FAO, 2006. Guideline for soil description, 4th edition. Stylus Publishing, LLC, Rome. |
| [11] | Yamane, T. (1973). Statistics: An introductory analysis. |
| [12] | Fikru, A. (2009). Assessment of Adoption Behavior of Soil and Water Conservation Practices in the Koga Watershed, Highlands of Ethiopia. Unpublished Master Thesis, Cornell University, School of Graduate Studies, New York. (Country Not Stated). |
| [13] | CSA (2007). Population and Housing Census of Ethiopia. Results for Oromia Region Vol.1. |
| [14] | Chomba, G. N. (2004). Factors affecting smallholder farmers' adoption of soil and water conservation practices in Zambia. Michigan State University. Department of Agricultural Economics. |
| [15] | Abera, B. (2003). Factors influencing the adoption of soil and water conservation practices. North Western Ethiopia. |
| [16] | Wagayehu. B and Lars. D, (2003). Soil and water conservation decision of subsistence farmers in the Eastern highlands of Ethiopia: a case study of the Hunde Lafto. Addis Ababa, Ethiopia. |
| [17] | Sabarathnam, V. E. (1988). Manuals of field experience training for ARS Scientists. NAARM, Hyderabad, 21. |
| [18] | Prokopy, L. S., Carlton, J. S., Arbuckle, J. G., Haigh, T., Lemos, M. C., Mase, A. S., Babin, N., Dunn, M., Andresen, J., Angel, J., Hart, C., Power, R. (2015). Extensions role in disseminating information about climate change to agricultural stakeholders in the United States. Climate Change 130(2), 261-272. |
| [19] | Ali, M., Man, N., Abd Latif, I., Muharam, F. M., Omar, S. Z. (2018). The use of information and communication technologies in agricultural risk management by the agricultural extension services in Malaysia. Int. J. Agric., Environ. Food Sci. 2(1), 29-35. |
| [20] | Khan, M., Nawab, K., Ullah, J., Khatam, A., Qasim, M., Ayub, G., Nawaz, N. (2012). Communication gap and training needs of Pakistan’s agricultural extension agents in horticulture. Sarhad J. Agric. 28(1), 129-135. |
| [21] | Bonye, S. Z., Alfred, K. B., Jasaw, G. S. (2012). Promoting community-based agricultural extension agents as an alternative approach to formal agricultural extension service delivery in Northern Ghana. Asian J Agric Dev. 2(1), 76-95. |
| [22] | Muia, V. K., & Ndunda, E. (2013). Evaluating the impact of direct anthropogenic activities on land degradation in arid and semi-arid regions in Kenya. Wudpecker Journal of Agricultural Research, 2(6), 173-182. |
| [23] | Ifejika, S. C., Kiteme, B., Wisemann U. (2008) Droughts and famine, the underlying factors and causal links among agro-pastoral households in semi-arid Makueni District, Kenya. Glob Environ Chang 18: 220-233. |
| [24] | FAO, 2010c. Global Forest Resources Assessment 2010 key findings, Rome. |
| [25] | Dore, M. H. I., & Lamarche, J. F. (2005). Dating climate change: evidence from time series data on precipitation. Brock University mimeo. |
| [26] | Jordan, G., van Rompaey, A., Szilassi, P., Csillag, G., Mannaerts, C., Woldai, T. (2005). Historical land use changes and their impact on sediment fluxes in the Balaton basin (Hungary). Agric. Ecosyst. Environ., 108, 119-133. |
| [27] | Vancampenhout, K., Nyssen, J., Gebremichael, D., Deckers, J., Poesen, J., Haile, M., & Moeyersons, J. (2006). Stone bunds for soil conservation in the northern Ethiopian highlands: Impacts on soil fertility and crop yield. Soil and Tillage Research, 90(1-2). |
| [28] | Nyssen, J., Poesen, J., Gebremichael, D., Vancampenhout, K., D’aes, M., Yihdego, G., & Deckers, J. (2007). Interdisciplinary on-site evaluation of stone bunds to control soil erosion on cropland in Northern Ethiopia. Soil and Tillage Research, 94(1), 151-163. |
| [29] | Nigussie, Z., Tsunekawa, A., Haregeweyn, N., Adgo, E., Cochrane, L., Floquet, A., & Abele, S. (2018). Applying Ostrom’s institutional analysis and development framework to soil and water conservation activities in north-western Ethiopia. Land use policy, 71, 1-10. |
| [30] | Lakew Desta, V. C., Wendam-Ageňehu, A., & Abede, Y. (2005). Community based participatory watershed development: A guideline. Development MoAaR (ed), Addis Ababa, Ethiopia. |
| [31] | Adgo, E., Teshome, A., & Mati, B. (2013). Impacts of long-term soil and water conservation on agricultural productivity: The case of Anjenie watershed, Ethiopia. Agricultural Water Management, 117, 55-61. |
| [32] | MoARD. (2005). Community based participatory watershed development: A guideline. Ministry of Agriculture and Rural development. |
APA Style
Begna, E. B., Ayansa, W. A. (2025). Socio-economic and Biophysical Resource Characterization in Gur Watershed, Girar Jarso District, North Shewa Zone, Oromia. International Journal of Environmental Monitoring and Analysis, 13(3), 103-113. https://doi.org/10.11648/j.ijema.20251303.14
ACS Style
Begna, E. B.; Ayansa, W. A. Socio-economic and Biophysical Resource Characterization in Gur Watershed, Girar Jarso District, North Shewa Zone, Oromia. Int. J. Environ. Monit. Anal. 2025, 13(3), 103-113. doi: 10.11648/j.ijema.20251303.14
@article{10.11648/j.ijema.20251303.14,
  author = {Endale Bedada Begna and Woubalem Abera Ayansa},
  title = {Socio-economic and Biophysical Resource Characterization in Gur Watershed, Girar Jarso District, North Shewa Zone, Oromia
},
  journal = {International Journal of Environmental Monitoring and Analysis},
  volume = {13},
  number = {3},
  pages = {103-113},
  doi = {10.11648/j.ijema.20251303.14},
  url = {https://doi.org/10.11648/j.ijema.20251303.14},
  eprint = {https://article.sciencepublishinggroup.com/pdf/10.11648.j.ijema.20251303.14},
  abstract = {Socio-economic and biophysical resource characterization builds necessary foundation for the plan and obtains proper information for elective planning, implementation and monitoring of the research in the field of natural resources. The objective of the study was to identify and characterize existing socio-economic and biophysical resources and document baseline information on socio-economic and biophysical aspects used as benchmark for planning and impact monitoring in the watershed. The site was selected depending on agro-ecological representation, prevalence of resource management and land degradation problems. The data were collected through field observations, HH survey, FGD and KII’s and the collected data were analyzed using SPSS software. Results of study indicated that, decline of soil fertility, soil erosion, and shortage of agricultural inputs are the major crop production constraints in the watershed. According to the results, the farmers majorly implemented physical SWC measures such as stone bund, stone faced soil bund, water ways. About 97.7%, of the sample farmers in the Gur watershed were participating in construction of SWC measures by their own interest respectively. Analysis of the result shows that the major constraints in practicing of physical SWC structures were serves as breed and hiding places of rodents, it requires large number of labors and lack of training to construct. According to the field measurement data of implemented stone bund in most sample sites of the study watershed failed to meet the standards. Based on the above findings, enhancing the farmers’ awareness on the importance of SWC structures and based on their agro-ecologies promotion different introduced physical, biological and agronomic SWC measures were recommended.
},
 year = {2025}
}
TY  - JOUR
T1  - Socio-economic and Biophysical Resource Characterization in Gur Watershed, Girar Jarso District, North Shewa Zone, Oromia

AU  - Endale Bedada Begna
AU  - Woubalem Abera Ayansa
Y1  - 2025/06/30
PY  - 2025
N1  - https://doi.org/10.11648/j.ijema.20251303.14
DO  - 10.11648/j.ijema.20251303.14
T2  - International Journal of Environmental Monitoring and Analysis
JF  - International Journal of Environmental Monitoring and Analysis
JO  - International Journal of Environmental Monitoring and Analysis
SP  - 103
EP  - 113
PB  - Science Publishing Group
SN  - 2328-7667
UR  - https://doi.org/10.11648/j.ijema.20251303.14
AB  - Socio-economic and biophysical resource characterization builds necessary foundation for the plan and obtains proper information for elective planning, implementation and monitoring of the research in the field of natural resources. The objective of the study was to identify and characterize existing socio-economic and biophysical resources and document baseline information on socio-economic and biophysical aspects used as benchmark for planning and impact monitoring in the watershed. The site was selected depending on agro-ecological representation, prevalence of resource management and land degradation problems. The data were collected through field observations, HH survey, FGD and KII’s and the collected data were analyzed using SPSS software. Results of study indicated that, decline of soil fertility, soil erosion, and shortage of agricultural inputs are the major crop production constraints in the watershed. According to the results, the farmers majorly implemented physical SWC measures such as stone bund, stone faced soil bund, water ways. About 97.7%, of the sample farmers in the Gur watershed were participating in construction of SWC measures by their own interest respectively. Analysis of the result shows that the major constraints in practicing of physical SWC structures were serves as breed and hiding places of rodents, it requires large number of labors and lack of training to construct. According to the field measurement data of implemented stone bund in most sample sites of the study watershed failed to meet the standards. Based on the above findings, enhancing the farmers’ awareness on the importance of SWC structures and based on their agro-ecologies promotion different introduced physical, biological and agronomic SWC measures were recommended.

VL  - 13
IS  - 3
ER  -
Oromia Agricultural Research Institute, Fitche Agricultural Research Center, Fitche, Ethiopia
Information