The purpose of this paper is to propose Madagascar Interprovincial Network using Graph Theory with Power Flow. This is accomplished by simulating the electrical network's topology using algorithms programmed with the Python language. The initial phase of the proposed algorithms consists in establishing connections between 17 source nodes and 94 load nodes, using the shortest path and maximizing the number of load nodes. The next phase consists in removing triangular links deemed superfluous. The third phase involves giving priority to load nodes located close to an electrical source node. The final phase involves removing any remaining superfluous links and applying the (n-k) rule. After the calculations, eight topologies of the Madagascar Interprovincial Network were established. Topology number 8 is the optimal one, comprising 126 links with optimal total distances of 7324 km. Based on this last topology, we carried out simulations of the transit and flow of energy in the static regime across the different busbars of the major mining projects and the different provinces of Madagascar by the PowerFactory software using the Newton-Raphson method. In the transmission line, we used the THTB 220 kV voltage. The simulation revealed, firstly, the location of reactive energy compensation devices, secondly, the removal and installation of new links, and thirdly, the placing on hold of 120 MW of electrical power out of the 300 MW of the slack bus Sahofika hydroelectric plant. For 2030 - 2040, with hydroelectric power plants generating a total of 1,454 MW and loads with a total capacity of 1,344.5 MW, the simulation results showed voltage drop levels with a ∆U value of ± 5% in all busbars and losses of 4.5% in relation to total production. In perspective, further studies in dynamic regime, interactions between emerging technologies and the power system across all voltage levels are to be carried out on the development of the Madagascar Interprovincial Network.
| Published in | International Journal of Energy and Power Engineering (Volume 14, Issue 3) |
| DOI | 10.11648/j.ijepe.20251403.11 |
| Page(s) | 63-85 |
| Creative Commons |
This is an Open Access article, distributed under the terms of the Creative Commons Attribution 4.0 International License (http://creativecommons.org/licenses/by/4.0/), which permits unrestricted use, distribution and reproduction in any medium or format, provided the original work is properly cited. |
| Copyright |
Copyright © The Author(s), 2025. Published by Science Publishing Group |
Electrical Network Topology, Graph Theory, Power Flow, Voltage Drop, PowerFactory
Sources: si | Power: psi |
|---|---|
Ampandriambazaha | 90 MW |
Mahavola | 300 MW |
Ambodiroka | 42 MW |
Antafofo | 160 MW |
Volobe 1 | 6 MW |
Volobe 2 | 120 MW |
Andekaleka | 112 MW |
Mandraka | 24 MW |
Antelomita | 8 MW |
Tsiazompaniry | 5 MW |
Mahitsy | 20 MW |
Maroantsetra Voloina | 2, 5 MW |
Sahofika | 300MW |
Antetezambato | 120 MW |
Sahanivotry | 15 MW |
Namorona | 5 MW |
Betoafo | 300 MW |
Location | Minig project | Recoverable quantity | Power estimated |
|---|---|---|---|
Bemolanga | Bituminous sandstone | 3 000 000 000 T | 100 MW |
Tsimiroro | Heavy oil | 538 000 000 T | 80 MW |
Sakoa | Coal | 84 000 000 T | 100 MW |
Sakaraha | Natural gaz | 20 000 000 000 m3 per well | 20 MW |
Base Toliara | Ilmenite | 800 000 T | 20 MW |
Ambatovy | Nickel Cobalt | 125 000 000 T | 30 MW |
Manantenina | Bauxite | 165 000 000 T | 30 MW |
Molo, Maniry | Graphite | 17 000 T/an | 50 MW |
Soalala | Iron | 800 000 000 T | 20 MW |
Location | Power |
|---|---|
Antananarivo 1 | 140 MW |
Antananarivo 2 | 128 MW |
Antsirabe | 26.8 MW |
Moramanga | 26.8 MW |
Toamasina | 67 MW |
Antsiranana | 40.20 MW |
Mahajanga | 29.48 MW |
Morondava | 26.8 MW |
Fianarantsoa | 40.2 MW |
Manakara | 20.10 MW |
Toliara | 26.8 MW |
Project Ambatovy Tamatave | 134 MW |
Project QMM | 60 MW |
Project SakoaYOXFORD | 50 MW |
Project Tsimiroro Madagascar Oil | 40 MW |
Project Bemolanga | 50 MW |
Project Soalala | 30 MW |
Project Base Toliara | 20 MW |
Project Sakaraha | 20 MW |
Project Bauxite Manantenina | 20 MW |
Location | Power |
|---|---|
Ampandriambazaha | 90 MW |
Ambodiroka | 42 MW |
Antafofo | 160 MW |
Mahavola | 300 MW |
Volobe 2 | 120 MW |
Andekaleka | 112 MW |
Mandraka | 24 MW |
Mahitsy | 20 MW |
Antetezambato | 120 MW |
Sahofika | 300 MW |
Betoafo | 300 MW |
Centralnumber | Charge number | Methodology | Results | ||
|---|---|---|---|---|---|
Link number | Total line length | Network | |||
17 | 94 | Conception of algorithm to create lines connecting load nodes to a source nodes, while crossing as many load nodes as possible with minimum length | 173 | 11 161 km | Topology 1 |
17 | 94 | Algorithm to remove triangular meshes | 138 | 8 549 km | Topology 2 |
17 | 94 | Algorithm to supply the load nodes closest to source node as a priority, taking into account the power available and demanded. | 128 | 7 468 km | Topology 3 |
17 | 94 | Algorithm to remove triangular meshes | 120 | 6 855 km | Topology 4 |
17 | 94 | Algorithm for exploiting remaining non-dispatched sources | 128 | 7412 km | Topology 5 |
17 | 94 | Algorithm to remove triangular meshes | 120 | 6 917 km | Topology 6 |
17 | 94 | Algorithm for application a rule (n-k) | 134 | 7 806 km | Topology 7 |
17 | 94 | Algorithm to remove superfluous meshes | 126 | 7 324 km | Topology 8 |
Province | Power Transformer | Load charge |
|---|---|---|
Antsiranana | TR63MVA | 66% |
Mahajanga | TR45MVA | 67.3% |
Antananarivo | 5 x TR90 MVA | 59.2% |
Fianarantsoa | TR63MVA | 64.7% |
Toamasina | 2 x TR50MVA | 68.8% |
Toliara | TR50MVA | 52.1% |
Additional links | Line distance | Removal links | Line distance |
|---|---|---|---|
Antetezambato - Antsirabe | +50 km | Antetezambato - Betafo | -37.4 km |
Sahofika - Antsirabe | +125 km | Sahanivotry - Antetezambato | -38.5 km |
Betoafo - Fianarantsoa | +235 km | Ambalavao - Fianarantsoa | -45.1 km |
Location busbar | Power of Compensators |
|---|---|
Ambanja | 10 MVAR |
Ambatoboeny | 30 MVAR |
Antananarivo | 90 MVAR |
Mahabo | 55 MVAR |
Project Sakaraha | 10 MVAR |
Project Sakoa | 30 MVAR |
Toliara | 45 MVAR |
Designation | Approximate cost USD/km | Number | Unit | Montant |
|---|---|---|---|---|
Cables and Pylognes double-circuit 220 kV | 400 000 | 7613 | km | 3 045 200 000 |
Transformer substation < 5MW | 1 200 000 | 30 | unit | 36 000 000 |
Transformer substation between 5MW and 10MW | 2 000 000 | 27 | unit | 54 000 000 |
Transformer substation between 10MW and 25MW | 5 000 000 | 17 | unit | 85 000 000 |
Transformer substation between 25MW and 50MW | 10 000 000 | 12 | unit | 120 000 000 |
Transformer substation between 50MW and 90MW | 15 000 000 | 14 | unit | 210 000 000 |
Dispositif de compensation entre 10 Mvar et 30 Mvar | 1 000 000 | 4 | Unit | 4 000 000 |
Dispositif de compensation entre 30 Mvar et 90 Mvar | 5 000 000 | 3 | Unit | 15 000 000 |
Civil engineering and implementation | 200 000 | 7613 | km | 1 522 600 000 |
Technical studies | 100 000 | 7613 | km | 761 300 000 |
TOTAL in USD | 5 853 100 000 | |||
JIRAMA | JIro sy RAno Malagasy (National Electricity and Water Company of Madagascar) |
NPE | New Energy Policies |
SDG | Sustainable Development Goal |
MIN | Madagascar's Interprovincial Network |
EITI | Extractive Industries Transparency Initiative |
GT | Graph Theory |
PF | Power Flow |
PDMC | Plan de Développement au Moindre Coût (Least Cost Development Plan) |
PRIRTEM | Projet de Renforcement et d’Interconnexion des Réseaux de Transport d’Energie électrique à Madagascar. |
THTB | Très Haute Tension classe B |
| [1] |
Agenda 2030 in France, The Sustainable Development Goals (SDGs) website. 17 Sustainable Development Goals. Available from:
https://www.agenda-2030.fr/17-objectifs-de-developpement-durable/ |
| [2] | The Energy Progress Report. Tracking SDG 7 | Progress Towards Sustainable Energy. Available from: |
| [3] | Ramaharo, F. M, Rajaonarison, N. R. Principal component regression analysis of electricity consumption factors in Madagascar, Munich Personal RePEc Archive MPRA. 2023, Paper No 116142. |
| [4] | Rakotondrainintsimba, M. P. Evolution of Production Sales Subscribers and Revenue together at Jirama, Planning Department JIRAMA, Madagascar. 2024. |
| [5] | Electricity Regulatory Office. New Energy Policy 2015 - 2030, Madagascar Energy Policy Letter, Hydroelectric sites. Available from: |
| [6] | Beltran, A. Russia, USSR and electrification: from the 1880s to 1926. Energy Review No 628. November-December 2015, 81-83. |
| [7] |
2424. mg: ENERGY – Madagascar has the third largest hydroelectric potential in Africa. Available from:
https://2424.mg/ (Accessed mars 2025). |
| [8] | Chamber of Mines: Monograph of the Malagasy mining sector. Available from: |
| [9] | United Nations: The UN Secretary-General's Panel on Critical Energy. Available from: |
| [10] |
SEforALL Madagascar: report-madagascar-iep_electrification. Available from:
https://www.seforall.org/system/files/2024-09/report-madagascar-iep_electrification-fr |
| [11] |
CIGRE for power system expertise: 2023 CIGRE Strategic Plan Summary. Available from:
https://www.cigre.org/userfiles/files/About/Official_Documents/2023CIGREStrategicPlanSummary (Accessed 23 november 2024). |
| [12] |
IDEV Independent Development Evaluation: Powering Africa through interconnected power grids. Available from:
https://www.afdb.org/fileadmin/uploads/afdb/Documents/Publications/ |
| [13] | Murphy, P. S. R. Power System Analysis, AdithyaArt Printers, Hyderabad India, BS publications, 2007, |
| [14] | Baozhuo Xie, Chao Qi, Hongqi Ben, Weixiong Yu, The Applications of Graph Theory in Electric Network, International Conference on Sensing, Prognostics, and Control, IEEE, 2019. |
| [15] |
Scribd: Topological methods in the calculation of electrical networks, Pr Chaghi, Available from:
https://fr.scribd.com/document/Méthodes_topologiques_dans_le_calcul_des_réseaux_électriques/ (Accessed mai 2024). |
| [16] | Gladkikh, E. Optimization of the architecture of electrical energy distribution networks. PhD. Thesis. Université Grenoble Alpes. 2015. |
| [17] | Bertrand, J. Graph theories for the analysis of real networks. Laboratory ERIC. IXXI. University Lyon 2. |
| [18] | Yassini, K. Zine, R. Raïssouli, M. Decision support tools for planning electrical energy distribution networks. Faculté des Sciences. Université de Moulay Ismail. Morocco. Revue ARIMA, vol. 13 (2010), pp. 105-118. |
| [19] | Giraud, X. Methods and tools for the optimal design of electrical distribution networks in aircraft. Phd. Thesis. Université de Toulouse. 2015. |
| [20] | Omazaki Group: Load Flow and Analysis. Available from: |
| [21] | Poirson, A, Lehmann, X. Fractal analysis of electricity distribution networks. Master 1 ISA. Projet SIG - Gestion des espaces urbains et périurbains. 2015. |
| [22] | Enacheanu, O. Fractal modeling of electrical networks, Université Joseph Fourier- Grenoble I. 2008. |
| [23] | Rakotoniaina, S. H. Energy situation in Madagascar. Conference on “European energy policy for islands and regions”. 26 octobre au 4 novembre 2005, Reunion Island. |
| [24] | Development of the Low Cost Electricity Development Plan (PDMC). Final version. Project to Improve Governance and Operations in the Electricity Sector (PAGOSE) ARTELIA Water and Environment. June 2018. |
| [25] |
Rakotofiringa, J. M. A, Rakotoniaina, S. H, Rastefano, Elisée, Optimal placement and sizing of D- STATCOMs in distribution network using Bacterial Foraging Algorithm and coordinated control of these devices with OLTC and Distributed Generation,
www.ijaem.net 2021, Volume 3, Issue 12 Dec 2021, Page 1615-1628. |
| [26] |
Electricity Regulatory Office. Law No 2017-020 on the electricity code in Madagascar. Power transmission in Madagascar. Available from:
http://www.ore.mg/TextesDoc (Accessed 24 July 2023). |
APA Style
Rakotoniaina, S. H., Ranarison, O. M., Randriamboavonjy, R. H., Rakotondrainitsimba, M. P. (2025). A Contribution to the Conception of Madagascar’s Interprovincial Network Topology Using Graph Theory and Power Flow. International Journal of Energy and Power Engineering, 14(3), 63-85. https://doi.org/10.11648/j.ijepe.20251403.11
ACS Style
Rakotoniaina, S. H.; Ranarison, O. M.; Randriamboavonjy, R. H.; Rakotondrainitsimba, M. P. A Contribution to the Conception of Madagascar’s Interprovincial Network Topology Using Graph Theory and Power Flow. Int. J. Energy Power Eng. 2025, 14(3), 63-85. doi: 10.11648/j.ijepe.20251403.11
AMA Style
Rakotoniaina SH, Ranarison OM, Randriamboavonjy RH, Rakotondrainitsimba MP. A Contribution to the Conception of Madagascar’s Interprovincial Network Topology Using Graph Theory and Power Flow. Int J Energy Power Eng. 2025;14(3):63-85. doi: 10.11648/j.ijepe.20251403.11
@article{10.11648/j.ijepe.20251403.11,
  author = {Solofo Hery Rakotoniaina and Olivier Mickael Ranarison and Rajo Harivelo Randriamboavonjy and Mamy Prudence Rakotondrainitsimba},
  title = {A Contribution to the Conception of Madagascar’s Interprovincial Network Topology Using Graph Theory and Power Flow
},
  journal = {International Journal of Energy and Power Engineering},
  volume = {14},
  number = {3},
  pages = {63-85},
  doi = {10.11648/j.ijepe.20251403.11},
  url = {https://doi.org/10.11648/j.ijepe.20251403.11},
  eprint = {https://article.sciencepublishinggroup.com/pdf/10.11648.j.ijepe.20251403.11},
  abstract = {The purpose of this paper is to propose Madagascar Interprovincial Network using Graph Theory with Power Flow. This is accomplished by simulating the electrical network's topology using algorithms programmed with the Python language. The initial phase of the proposed algorithms consists in establishing connections between 17 source nodes and 94 load nodes, using the shortest path and maximizing the number of load nodes. The next phase consists in removing triangular links deemed superfluous. The third phase involves giving priority to load nodes located close to an electrical source node. The final phase involves removing any remaining superfluous links and applying the (n-k) rule. After the calculations, eight topologies of the Madagascar Interprovincial Network were established. Topology number 8 is the optimal one, comprising 126 links with optimal total distances of 7324 km. Based on this last topology, we carried out simulations of the transit and flow of energy in the static regime across the different busbars of the major mining projects and the different provinces of Madagascar by the PowerFactory software using the Newton-Raphson method. In the transmission line, we used the THTB 220 kV voltage. The simulation revealed, firstly, the location of reactive energy compensation devices, secondly, the removal and installation of new links, and thirdly, the placing on hold of 120 MW of electrical power out of the 300 MW of the slack bus Sahofika hydroelectric plant. For 2030 - 2040, with hydroelectric power plants generating a total of 1,454 MW and loads with a total capacity of 1,344.5 MW, the simulation results showed voltage drop levels with a ∆U value of ± 5% in all busbars and losses of 4.5% in relation to total production. In perspective, further studies in dynamic regime, interactions between emerging technologies and the power system across all voltage levels are to be carried out on the development of the Madagascar Interprovincial Network.},
 year = {2025}
}
TY  - JOUR
T1  - A Contribution to the Conception of Madagascar’s Interprovincial Network Topology Using Graph Theory and Power Flow

AU  - Solofo Hery Rakotoniaina
AU  - Olivier Mickael Ranarison
AU  - Rajo Harivelo Randriamboavonjy
AU  - Mamy Prudence Rakotondrainitsimba
Y1  - 2025/08/13
PY  - 2025
N1  - https://doi.org/10.11648/j.ijepe.20251403.11
DO  - 10.11648/j.ijepe.20251403.11
T2  - International Journal of Energy and Power Engineering
JF  - International Journal of Energy and Power Engineering
JO  - International Journal of Energy and Power Engineering
SP  - 63
EP  - 85
PB  - Science Publishing Group
SN  - 2326-960X
UR  - https://doi.org/10.11648/j.ijepe.20251403.11
AB  - The purpose of this paper is to propose Madagascar Interprovincial Network using Graph Theory with Power Flow. This is accomplished by simulating the electrical network's topology using algorithms programmed with the Python language. The initial phase of the proposed algorithms consists in establishing connections between 17 source nodes and 94 load nodes, using the shortest path and maximizing the number of load nodes. The next phase consists in removing triangular links deemed superfluous. The third phase involves giving priority to load nodes located close to an electrical source node. The final phase involves removing any remaining superfluous links and applying the (n-k) rule. After the calculations, eight topologies of the Madagascar Interprovincial Network were established. Topology number 8 is the optimal one, comprising 126 links with optimal total distances of 7324 km. Based on this last topology, we carried out simulations of the transit and flow of energy in the static regime across the different busbars of the major mining projects and the different provinces of Madagascar by the PowerFactory software using the Newton-Raphson method. In the transmission line, we used the THTB 220 kV voltage. The simulation revealed, firstly, the location of reactive energy compensation devices, secondly, the removal and installation of new links, and thirdly, the placing on hold of 120 MW of electrical power out of the 300 MW of the slack bus Sahofika hydroelectric plant. For 2030 - 2040, with hydroelectric power plants generating a total of 1,454 MW and loads with a total capacity of 1,344.5 MW, the simulation results showed voltage drop levels with a ∆U value of ± 5% in all busbars and losses of 4.5% in relation to total production. In perspective, further studies in dynamic regime, interactions between emerging technologies and the power system across all voltage levels are to be carried out on the development of the Madagascar Interprovincial Network.
VL  - 14
IS  - 3
ER  -
Doctoral School of Science and Engineering Techniques and Innovation, University of Antananarivo, Antananarivo, Madagascar
Doctoral School of Science and Engineering Techniques and Innovation, University of Antananarivo, Antananarivo, Madagascar
Doctoral School of Science and Engineering Techniques and Innovation, University of Antananarivo, Antananarivo, Madagascar
Department of Electrical Planning, Malagasy Electricity and Water Company (JIRAMA), Antananarivo, Madagascar
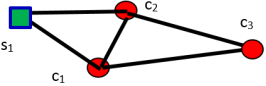
Figure 1. One source node and three load nodes.
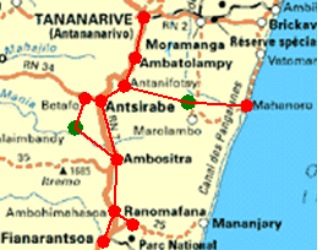
Figure 2. Green: source node si of hydroelectric power stations, Red: charge node ci of cities or industries.
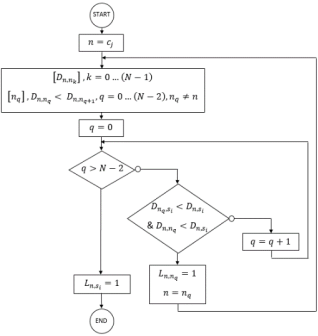
Figure 3. Flowchart of maximum links between nodes by minimizing line lengths.
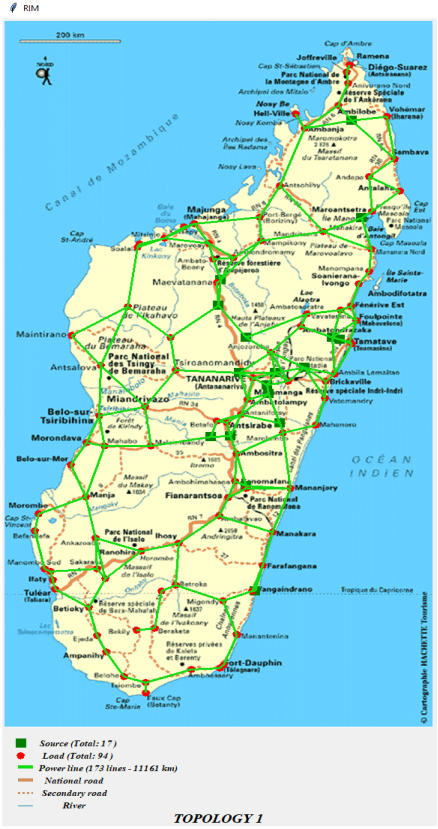
Figure 4. Topology 1 of MIN.
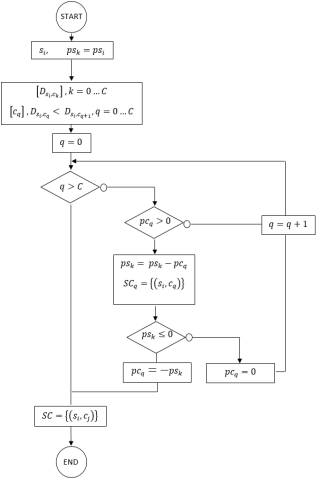
Figure 5. Flowchart of prioritization of charge nodes around of source node.

Figure 6. Topology 3 of MIN.

Figure 7. Topology 4 of MIN.
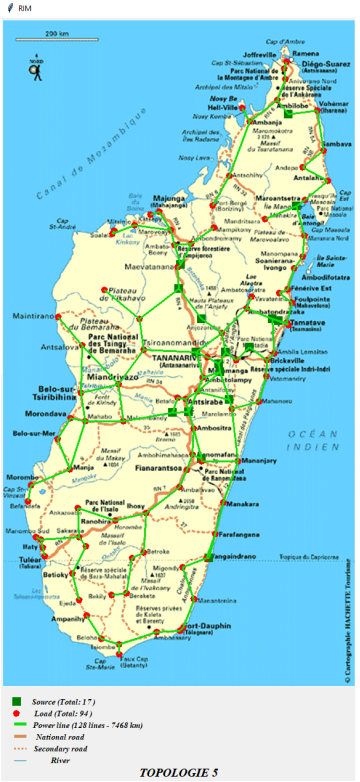
Figure 8. Topology 5 of MIN.
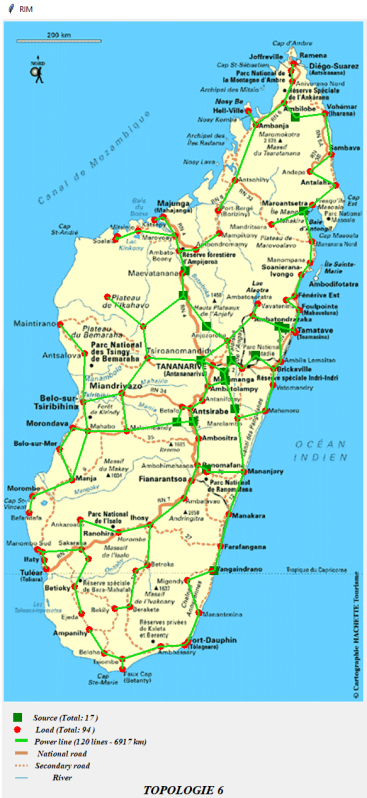
Figure 9. Topology 6 of MIN.
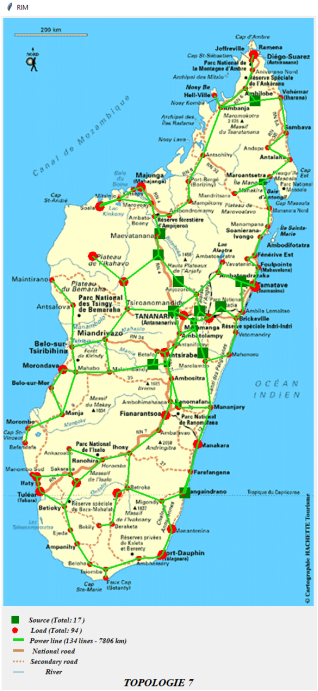
Figure 10. Topology 7 of MIN.
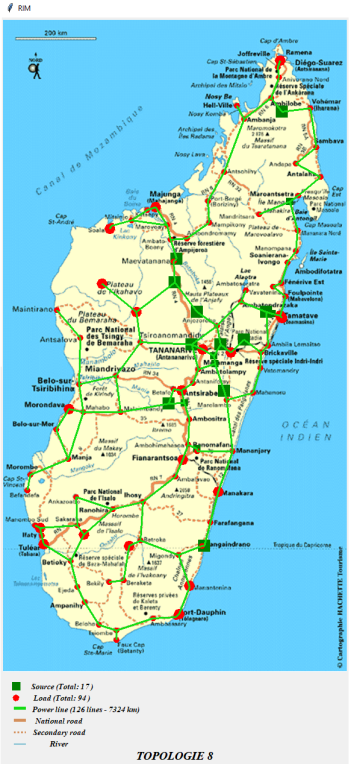
Figure 11. Topology 8 of MIN.
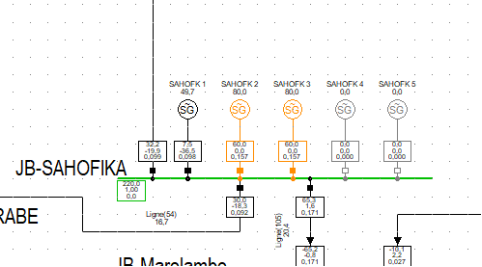
Figure 12. State of load of the Sahofika reference hydropower plant.
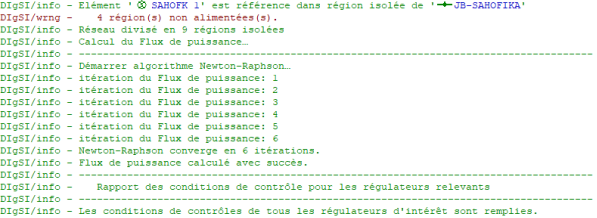
Figure 13. Outcomes of a computational process on PowerFactory.
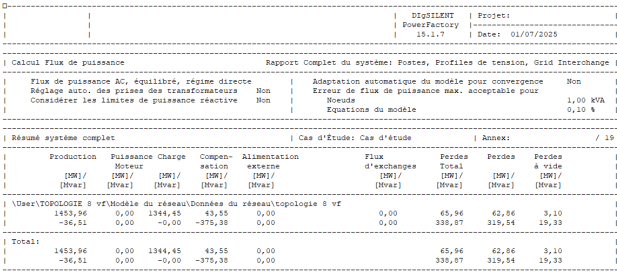
Figure 14. System report summary.
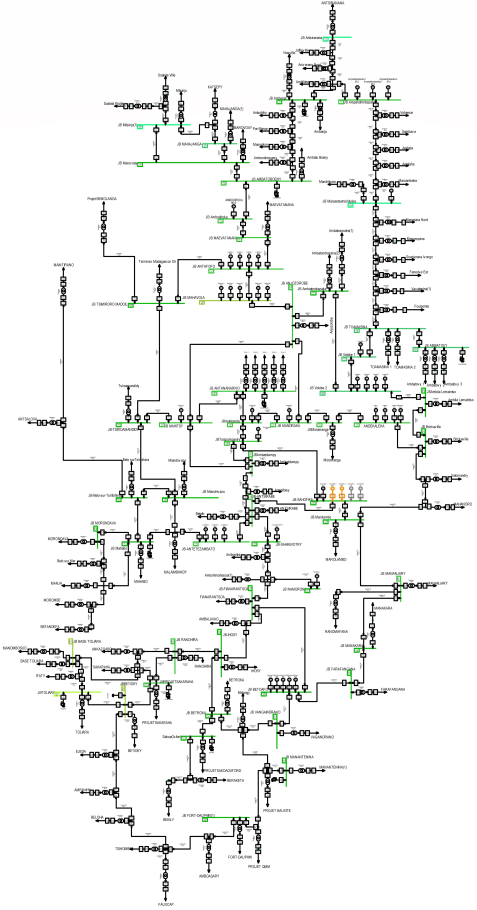
Figure 15. PF from the 220 kV of MIN.
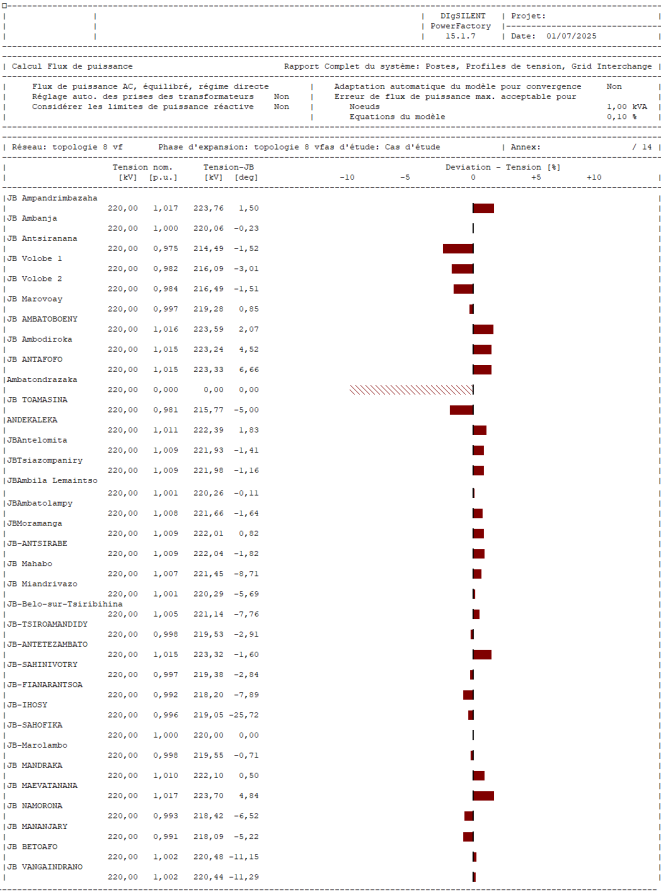
Figure 16. Voltage drops in rectified topology 8 for the MIN (part 1).
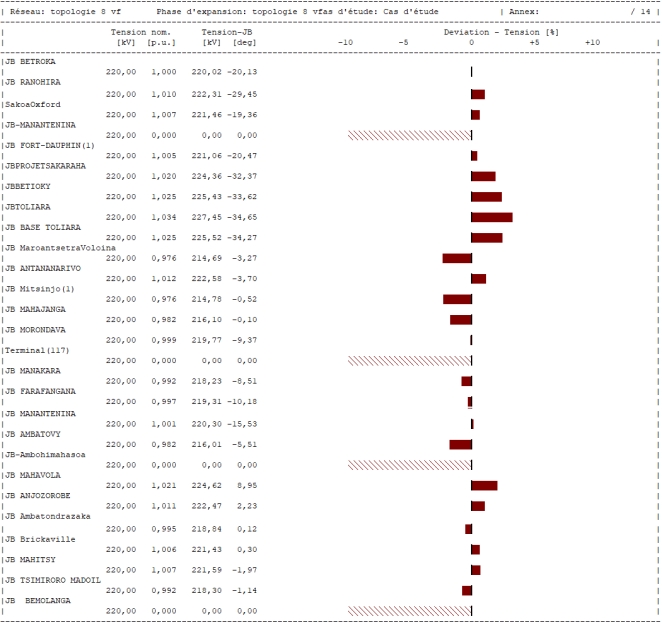
Figure 17. Voltage drops in rectified topology 8 for the MIN (part 2).
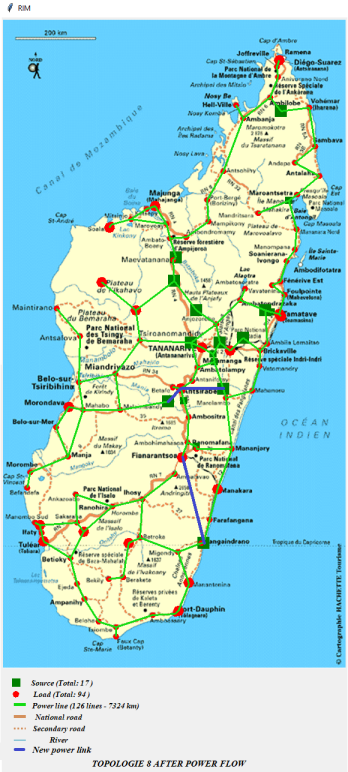
Figure 18. Topology of MIN simulated by GT and PF.
Information

