Research Article | | Peer-Reviewed

Effects of Fe3+/Fe2+ on Glycation Reaction of β-lactoglobulin

Received: 19 April 2026     Accepted: 6 May 2026     Published: 8 May 2026
Views:       Downloads:
Abstract

Iron ions (Fe2+ and Fe3+) are essential trace elements for the human body, and are often added to various foods, but their effects on protein glycation remain unclear. This study evaluated the differential influences of Fe2+ and Fe3+ on the glycation reaction of β-lactoglobulin (β-Lg)-D-ribose system in terms of glycation degree, protein conformation and the distribution of modification sites. Free amino group contents and HPLC HCD MS/MS analyses indicated that both Fe3+ and Fe2+ could catalyze the glycation process and increase the glycated sites. The system contain Fe2+ exhibited higher glycation degree and more glycation sites (8), and lesser glycation sites were identified in system contain Fe3+ (5) and system without ferric ions (2). Additional sites (L1, K14, K135) were facilitated glycation by Fe2+, and most glycation sites showed higher degree of substitution per peptide (DSP) values when with Fe2+. In comparison with Fe2+, Fe3+ caused more pronounced alterations on both secondary and tertiary protein structure, promoted the β-Lg unfolding, and changed the protein structure to a more unordered form. In conclusion, Fe2+ at a specified concentration was a better choice to promote glycation reaction while maintain the protein structure. This study provide a theoretical basis for protein glycation modification with iron ions at different valence states participated.

Published in International Journal of Nutrition and Food Sciences (Volume 15, Issue 3)
DOI 10.11648/j.ijnfs.20261503.11
Page(s) 93-103
Creative Commons

This is an Open Access article, distributed under the terms of the Creative Commons Attribution 4.0 International License (http://creativecommons.org/licenses/by/4.0/), which permits unrestricted use, distribution and reproduction in any medium or format, provided the original work is properly cited.

Copyright

Copyright © The Author(s), 2026. Published by Science Publishing Group

Keywords

β-lactoglobulin, Ferric Ions, Glycation, Mass Spectrometry, Protein Structure

1. Introduction
Glycation reaction is a nonenzymatic browning reaction starting from the condensation between the carbonyl group of reducing sugar and amino group of protein/amino acid . It not only modifies structure, functional properties and nutritional values of protein, but also impart attractive color and flavor to foods. Consequently, glycation reaction has garnered significant attention as a mild and environmentally friendly method for protein modification and food processing .
In addition to external processing methods (such as conventional heating, superheated steam and microwave irradiation ), internal factors (including the pH, amino: carbonyl ratio and relative humidity), food additives (such as plant extracts and secondary metabolites, microelement and metal ions ) also play an important role in protein-sugar glycation reaction.
Although previous studies have preliminarily investigated the influence of iron ions on glycation reactions , however, most of them were focused on macroscopic aspects such as reaction rates or the yield of final products. There is a lack of detailed analysis of the influence of iron ions on the protein glycation at modification sites level. Moreover, the comparison of differential influences of Fe2+ and Fe3+ on the glycation reaction and protein structure has not been reported. These limited the precise using of iron ions in food industry.
Liquid chromatography high-resolution mass spectrometry (LC-HRMS) has the highest accuracy, can analyze the precise characterization of peptides with various modifications . This method was used to explore the precise glycation sites and glycation degree at molecular level.
β-lactoglobulin (β-Lg) is the major component of bovine whey protein. It consists of 162 amino acid residues, has a molecular weight of approximately 18.4 kDa, and exhibits a typical lipoprotein folding structure. Due to its well-defined structure, abundant availability, and favorable functional properties, β-Lg is often used as an ideal model for protein glycation modification .
D-ribose was used as a reactant in reactions with proteins because, as a pentose, its reducing end is more readily able to undergo non-enzymatic glycation with the amino groups of proteins than hexoses, making it more reactive .
In this study, β-Lg-D-ribose system was used to systematically compare the differential regulatory effects of Fe2+ and Fe3+ on glycation reactions. Free amino acid assay, fluorescence spectroscopy, UV spectroscopy and circular dichroism spectroscopy were employed to analyze the glycation extent and protein conformation changes. Concurrently, high-resolution mass spectrometry (HPLC-HCD-MS/MS) was applied to precisely identify glycation sites and calculate the average degree of substitution (DSP) for each peptide segment, revealing the influence of iron ions on the distribution of glycation sites at the molecular level. This study aims to elucidate the mechanisms by which iron ions of different valences function in the glycation reaction, providing a theoretical basis for the precise regulation of protein modification.
2. Materials and Methods
2.1. Chemicals and Materials
β-Lg and D-ribose were purchased from Sigma-Aldrich (Sigma-Aldrich Co., St. Louis, MO, USA). Dithiothreitol (DTT) was purchased from Solarbio (Solarbio Science & Technology Co., Ltd, Beijing, China). All other reagents were of analytical grade. Distilled water from a water purification system (Lingde; Shanghai, Leader-A1, China) was used throughout this study.
2.2. Sample Preparation
Appropriate volumes of FeCl₂ or FeCl₃ solution (2 g/L) were added to the β-Lg-ribose solution (10 mg/mL) and then diluted with water to twice the original volume, yielding a final protein concentration of 5 mg/mL and final iron concentrations of 0.01, 0.02, and 0.03 mg/mL . Six samples were marked as β-R-0.01-Fe2+, β-R-0.02-Fe2+, β-R-0.03-Fe2+, β-R-0.01-Fe3+, β-R-0.02-Fe3+ and β-R-0.03-Fe3+, respectively. Heat-treated mixture of β-Lg and ribose was named as β-R-control. Heat-treated β-Lg was served as β-control. Samples were packed in tubes individually, heated at 50°C for 3 h in a water bath, and then cooled rapidly in ice bath. The protein samples were dialyzed for 48 h at 4°C using a dialysis bag (3500 Da cut off; Beijing Solarbio Science & Technology Co., Ltd., China) to remove iron ions and free D-ribose. The dialyzed solutions were subsequently frozen, lyophilized for 48 h at -80°C, and stored in a refrigerator at 4°C.
2.3. Determination of Free Amino Group Contents
The degree of glycation was determined indirectly by o-Phthalaldehyde (OPA) assay. The measure and preparation of OPA reagent were accorded to the method described by Chen et al . Briefly, OPA reagent was mixed with the protein solution and incubated in the dark at room temperature for 3 min. The absorbance was measured at 340 nm using a spectrophotometer, with distilled water as the blank. All measurements were performed in triplicate.
2.4. Fluorescence Spectroscopy
The intrinsic emission fluorescence spectra of the samples were obtained with a fluorophotometer (F-7000; Hitachi, Tokyo, Japan). For fluorescence assay, the concentration of β-Lg was 0.5 mg/mL, intrinsic fluorescence was measured under an excitation wavelength of 270 nm, and emission spectra range was 300-370 nm .
2.5. Ultraviolet (UV) Spectroscopy
The UV spectra of the samples were recorded using a UV spectrophotometer (U-2910, Hitachi, Tokyo, Japan). For UV absorbance measurement, the concentration of β-Lg was 0.2 mg/mL, and the scanning wavelength range was 250–335 nm. All results were corrected for the corresponding control sample .
2.6. Circular Dichroism (CD) Spectroscopy
To analyze the protein secondary structures, CD spectroscopy of different β-Lg samples (0.1 mg/mL) was determined using a MOS-450 spectropolarimeter (French Bio-Logic SAS Co., Claix, Frence). Cylindrical quartz cuvette with path lengths (0.1 cm) was used for collecting data in the far-UV (190-250 nm) regions. Structure predictions from CD spectra were obtained using the Contin LL program .
2.7. HPLC HCD MS/MS
A protein sample (200 μg) was reduced with 100 mM DTT at 95°C for 5 minutes, then cooled to room temperature. Next, 200 μL of UA buffer (8 M urea, 150 mM Tris-HCl, pH 8.0) was added and mixed, then transferred to a 10 kDa ultrafiltration tube and centrifuged at 14,000 × g for 15 minutes. The filtrate was discarded, and 200 μL of UA buffer was added again, followed by a repeat centrifugation. Next, add 100 μL of 50 mM iodoacetamide (dissolved in UA buffer), shake at 600 rpm for 1 minute, and allow the alkylation reaction to proceed for 30 minutes at room temperature in the dark. After the reaction, centrifuge at 14,000 × g for 10 minutes. Then wash twice with 100 μL of UA buffer, centrifuging at 14,000 × g for 10 minutes each time. Wash twice more with 100 μL of hydrochloric acid buffer (pH 2.2) under the same centrifugation conditions. Finally, add 40 μL of pepsin solution (40 μg of pepsin dissolved in pH 2.2 hydrochloric acid buffer) and incubate at 4°C for 10 minutes. Transfer the sample to a new collection tube, centrifuge at 14,000 × g for 10 minutes, and collect the supernatant for subsequent mass spectrometry analysis.
HPLC was used to generate a gradient with a 0.05 mL/min flow rate. Solvent A was 5% acetonitrile in H2O and 0.1% formic acid (FA); solvent B consisted of 95% acetonitrile in water with 0.1% FA. The chromatographic column used was Waters SunFire C18 (150 mm × 1.0 mm, 5 μm-C18). A linear gradient elution was programmed as: 0–5 min, 5% B; 5–25 min, 10% B; 25–27 min, 35% B; 27–32 min, 95% B; 32–34 min, 5% B; and held at 5% B for 6 min for column re-equilibration. For analysis of peptides, 10μL of digested sample was eluted at 0.05 mL/min. The column effluent was injected into an Orbitrap fusion mass spectrometer (Thermo Fisher Scientific; Waltham, MA, USA) for analysis by tandem mass spectrometry (MS/MS) to identify the protein’s glycated sites. Detection is performed using positive ions. For each full scan, 20 of the most intense precursor ions were selected for MS/MS fragmentation. Precursor ions selected from full scans were fragmented using high-energy C-trap dissociation (HCD), and the resulting fragment ions were detected in the Orbitrap. Dynamic exclusion was enabled with exclusion duration of 90 s. When performing database queries, submit the raw files via Proteome Discoverer to the Sequest server.
To further compare the glycation extent of each peptide, the average degree of substitution per peptide molecule (DSP) of β-Lg was calculated according to the following formula :
DSP=i=0nI(peptide+i×suger)i=0nI(peptide+i×suger)
where I is the sum of the intensities of the glycated peptides, and i is the number of D-ribose units attached to the peptide in each glycated form.
2.8. Statistical Analysis
The data are expressed as the mean ± standard deviation. The analysis was performed using Origin-Pro 12 (Origin-Lab Co., Northampton, MA). Statistical data were determined based on a two-tailed t-test using standard deviations.
3. Results
3.1. Free Amino Group Contents Analysis
Glycation is a covalent bond formed between the amino group of a protein and the carbonyl group of a reducing sugar; the higher the degree of glycation, the lower the content of free amino groups. Thus, variation in free amino groups was employed to assess the contribution of Fe2+/Fe3+ on β-Lg glycation (Figure 1). The free amino groups of all β-Lg samples were significantly decreased after glycation. And free amino groups contents of β-Lg with Fe2+ were lower compared to that with Fe3+, particularly when the iron ions concentration was increased to 0.03 mg/mL. These suggested that iron ions, particularly Fe2+, could promote the glycation of β-Lg, which might be arisen from the Fe2+/Fe3+-induced unfolding of protein, bring lysine, arginine residues and N-terminal exposure to the molecular surface .
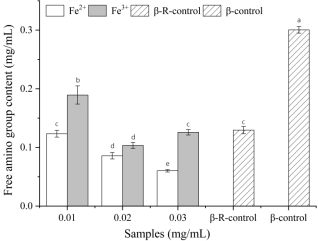
Figure 1. Free amino group contents of β-Lg samples in β-Lg-D-ribose-Fe2+ system and β-Lg-D-ribose-Fe3+ system (0.01-0.03, heat treated-β-Lg-D-ribose system with 0.01-0.03 mg/mL Fe2+/Fe3+ added; β-R-control, heat-treated β-Lg-D-ribose system; β-control, heat-treated β-Lg; Different letters (a–e) denote significant differences among samples (P≤ 0.05)).
3.2. Intrinsic Fluorescence Spectra Analysis
The three-dimensional structure of proteins depends primarily on the environment-sensitive fluorescence emission properties exhibited by their endogenous aromatic amino acid residues-particularly tryptophan (Trp)-under specific excitation conditions. Therefore, intrinsic fluorescence spectroscopy can be used to analyze changes in the tertiary structure of proteins . The intrinsic fluorescence spectra of glycated β-Lg samples are presented in Figure 2A. When treated with Fe3+, the fluorescence intensity of the protein continued to weaken as the Fe3+ concentration increased. After both glycation and Fe3+ treatment, β-Lg was unfolded and tryptophan, tyrosine and phenylalanine were exposed to the solvent, leading to the quenching of fluorescence . Another possible reason for the decreasing fluorescence intensities of glycated β-Lg samples was that the chromophores were buried within the β-Lg molecules due to the shielding effect after the lycation with sugar . In contrast, the response to Fe2+ exhibited a non-monotonic trend: with the concentration increased, the fluorescence intensity rised first and then fallen, reaching a maximum at 0.02 mg/mL. This anomalous phenomenon suggested that Fe2+ may temporarily protect the fluorescent environment of Trp at certain concentrations . Fe2+ may engage in weak electrostatic interactions with negatively charged groups on the protein surface, causing a slight conformational tightening . This protect the Trp residue from the aqueous phase, decreased the quenching of fluorescence.
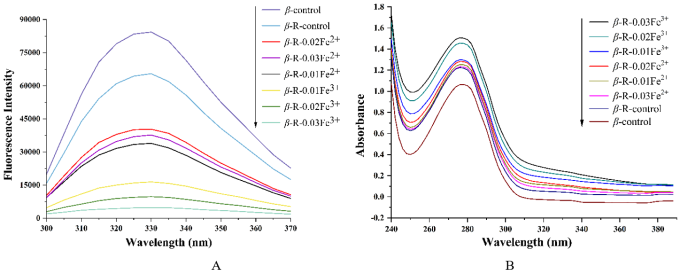
Figure 2. Intrinsic fluorescence spectra (A) and UV absorption spectra (B) of β-Lg samples at different treatments (β-R-0.01-Fe2+, β-R-0.02-Fe2+, β-R-0.03-Fe2+, β-R-0.01-Fe3+, β-R-0.02-Fe3+ and β-R-0.03-Fe3+, heat treated-β-Lg-D-ribose system with 0.01-0.03 mg/mL Fe2+/Fe3+ added; β-R-control, heat-treated β-Lg-D-ribose system; β-control, heat-treated β-Lg).
3.3. UV Absorption Spectra Analysis
β-Lg molecule contains tryptophan (Trp), tyrosine (Tyr) and phenylalanine (Phe) residues, which exhibit characteristic absorption in the ultraviolet region. Changes in the absorption spectrum reflect alterations in the microenvironment of these residues and can be used to monitor changes in protein conformation . The UV absorption spectra are shown in Figure 2B.
When treated with Fe2+, absorption intensity increased first and then decreased with the increasing of Fe2+ concentration, and the maximum absorption was observed during 0.02 mg/mL Fe2+ participated. When Fe3+ was added, the absorption continuously increased with the increasing of Fe3+ concentration, indicating that the unfolding degree of protein structure continuously increased. Similar to intrinsic fluorescence spectra analysis, these phenomena also suggested that the β-Lg structure was unfolded after glycation. While Fe2+ at concentration inhibited the structure unfolding, which perhaps caused by that Fe2+ causing a slight protein conformational tightening .
3.4. Secondary Structure Analysis
The contents of the secondary β-Lg structure were calculated from the far-UV CD spectra, and the results are listed in Table 1. Glycation itself led to a decrease in the proportion of α-helices and β-sheets in β-Lg, while the proportion of β-turns and random coils increased. This suggested that the covalent modification of sugar chains disrupts the original ordered secondary structure, resulting in partial denaturation of the protein . Building on this, the introduction of iron ions further exacerbated this structural disorder, with Fe3+ exhibiting a significantly stronger disruptive effect on the secondary structure than Fe2+.
The fundamental reason why the influences of Fe3+ are significantly stronger than those of Fe2+ perhaps lies in the intrinsic differences in their strength as Lewis acids and their coordination capabilities. Fe3+ is a hard Lewis acid with a high oxidation state and high charge density. It exhibits extremely strong affinity and coordination ability toward the carboxyl oxygen atoms of negatively charged hard base side chains in proteins, as well as the carbonyl oxygen atoms of the main-chain peptide bonds . This strong coordination interaction can directly compete with and displace the hydrogen bonds critical for maintaining secondary structure stability, particularly the interchain hydrogen bonds that stabilize β-sheet structures. Experimental data showed that following treatment with 0.02 mg/mL Fe3+, the β-sheet content decreased from 29.7 ± 0.62% in β-R-control to 23.9 ± 3.04%, while the random coil content surged from 27.4 ± 0.71% to 42.3 ± 2.25%. This result indicated that Fe3+, by binding tightly to the protein backbone, disrupts the protein’s native folding pattern, leading to conformational disorder. In contrast, although Fe2+ can also coordinate with proteins, as a divalent ion, its charge density and Lewis acidity are far weaker than those of Fe3+; therefore, its direct physicochemical disruption of the secondary structure is relatively mild. At the same concentration (0.02 mg/mL), Fe2+ only increased random coil to 32.2±0.11% and reduced β-sheets to 27.5±0.81%, with a significantly lower degree of structural disruption compared to the Fe3+-treated group.
Table 1. Secondary structure contents (%) of β-Lg samples at different treatments.

NO.

Samples

Secondary structure

α-Helix (%)

β-Sheet (%)

β-Turns (%)

Unordered (%)

1

Natural β-Lg

20.4±0.33f

39.1±5.24c

16.6±1.70a

24.3±0.53a

2

β-control

18.9±0.90e,f

28.7±1.37b

24.5±1.80c

27.0±0.71b

3

β-R-control

19.6±0.45e,f

29.7±0.62b

23.4±0.61b,c

27.4±1.21b

4

β-R-0.01-Fe2+

16.6±1.04c,d

28.6±1.55b

22.1±0.25b

32.0±1.01c,d

5

β-R-0.02-Fe2+

18.0±1.61d,e

27.5±0.81a,b

22.2±0.35b

32.2±0.11c

6

β-R-0.03-Fe2+

16.1±1.34b,c

30.1±1.62b

21.8±0.24b

30.1±1.44c

7

β-R-0.01-Fe3+

17.0±0.75c,d

28.7±0.87b

21.9±0.11b

31.3±0.78c,d

8

β-R-0.02-Fe3+

13.9±1.15a

23.9±3.04a

23.3±0.45b,c

42.3±2.25f

9

β-R-0.03-Fe3+

14.5±0.45a,b

25.7±3.50a,b

24.3±0.25c

36.6±0.21e

a–e Different letters denote significant differences across different treatments (P≤ 0.05).
3.5. Identification of Peptide Mapping and Glycated Sites
Generally, the ε-amino group of lysine, the N-terminal α-amino group of lysine and the guanidino group of arginine are considered the most likely glycation sites. Due to its ability to cleave hydrophobic residues specifically, pepsin can effectively digest glycated proteins under appropriate acidic conditions, generating shorter peptide fragments that help improve sequence coverage in mass spectrometry analysis . In this study, 0.03 mg/mL of non-glycated β-Lg and Fe3+/Fe2+-treated glycated β-Lg were selected for mass spectrometry analysis. The peptide mapping of β-Lg are listed in Table 2.
Table 2. Peptide mapping of β-Lg.

No.

m/z

Delta ppm

Start

End

Sequence

1

609.8421+2

0.564

1

11

(-)LIVTQTMKGLD(I)

2

451.7583+2

-0.116

12

19

(D)IQKVAGTW(Y)

3

584.275+1

0.581

20

24

(W)YSLAM(A)

4

694.308+1

0.407

24

30

(A)MAASDIS(L)

5

445.302+1

-0.138

29

32

(D)ISLL(D)

6

478.7616+2

-0.049

33

41

(L)DAQSAPLRV(Y)

7

652.32+1

1.94

42

46

(V)YVEEL(K)

8

571.3081+1

-0.881

47

51

(L)KPTPE(G)

9

885.4566+1

0.237

50

57

(T)PEGDLEIL(L)

10

502.2462+2

0.785

58

65

(L)LQKWENGE(C)

11

700.472+1

0.59

67

72

(C)AQKKII(A)

12

460.2766+1

0.0543

72

75

(I)IAEK(T)

13

452.2865+2

-0.544

75

82

(E)KTKIPAVF(K)

14

401.7190+2

0.736

83

89

(F)KIDALNE(N)

15

685.4608+1

0.164

90

95

(E)NKVLVL(D)

16

579.8058+2

0.179

95

103

(V)LDTDYKKYL(L)

17

555.318+1

-0.0208

102

105

(K)YLLF(C)

18

783.265+1

0.809

106

112

(F)CMENSAE(P)

19

573.288+1

0.0558

113

117

(E)PEQSL(V)

20

678.3308+1

-0.781

117

122

(S)LVCQCL(V)

21

408.2165+2

-0.0428

123

129

(L) VRTPEVD (D)

22

483.7243+2

-0.15

130

137

(D)DEALEKFD(K)

23

460.7820+2

0.375

135

142

(E)KFDKALKA(L)

24

440.2655+1

0.477

143

149

(A)LPMHIRL(S)

25

806.4048+1

0.627

150

156

(L)SFNPTQL(E)

26

758.3143+1

0.705

157

162

(L)EEQCHI(-)

MS scans can obtain the information of glycated peptides and non-glycated peptides since they coexisted in sample solution. Both peptides were eluted with the similar retention time. The glycated peptide can be easily found from the mass difference due to glycation. Theoretically, a peptide was mono-glycated by D-ribose (C5H10O5), and corresponding m/z peaks with charges of 1 or 2 will appear mass shift 132.04 Da or 66.02 Da, respectively . For example, the m/z of non-glycated peptide 1LIVTQTMKGLD11 was 609.84212+, while the peaks observed at the same retention time with m/z values of 675.86322+ and 741.88902+ were identified as its mono-glycated and diglycated forms, respectively (Figure 3A). Similarly, the peaks at m/z 571.3081, and 703.3492 were identified as the mono-glycated and diglycated forms of the peptide 47KPTPE51, respectively (Figure 3B).
Meanwhile, glycated sites were identified from the HCD MS/MS fragments of the peptide generated via a series of b and y ions . To locate the exact glycated site, the theoretical b and y ions were compared with the actual ion by HCD MS/MS and the protein database. The results from the HCD MS/MS of glycated peptide123 VuTPEVD129 (u=C11H22N4O6, u represents the arginine residues that undergo glycation modification within the peptide segment) showed that a series of b and y ions matched nicely with the fragment of the glycated peptide in the database. Thus, one possible glycated site, R124, was identified (Figure 3C). Similarly, K60 were also identified as mono-glycated sites from the HCD fragments of the glycated peptide 58LQvWENGE65 (v=C11H22N2O6, v represents lysine residues that undergo glycation modification within the peptide segment) (Figure 3D).
Table 3 lists the modified peptides obtained from pepsin digestion of glycated β-Lg detected via LC-Orbitrap MS/MS. Only 2 glycated sites (K8 and K100) were found in the control group, while 8 glycated sites were identified in β-R-0.03-Fe2+, mainly 6 at lysine residues (K8, K14, K47, K60, K83 and K135), 1 at arginine residues (R124) and 1 at leucine (L1). A total of 5 glycated sites were found in β-R-0.03-Fe3+, 4 at lysine residues (K8, K47, K60, K83) and 1 at arginine residues (R124). Fe3+ disrupted protein secondary structures (particularly β-sheets) far more effectively than Fe2+ and led to irreversible protein aggregation , thereby reducing the amount of soluble protein substrate available for glycation reactions. Therefore, the Fe3+ treatment group had fewer glycation sites than the Fe2+ group.
Interestingly, the fragments of peptide were abundant with many neutral losses and mass increasing, including H, O, and H2O. Maillard products were dehydrated and oxidized, and those reactions could indicate extent of oxidation. MS spectra peaks of oxidation-dehydrate glycated peptides with consecutive neutral losses and oxidation additions are shown in Figure 4. Figure 4(A) shows that glycated peptide [M1+R-2H] 2+ and peptide [M2] both increased one oxygen molecule treated with Fe2+. Peptide [M1] 2+, glycated peptide [M1+R-2H] 2+ and peptide [M2] in Figure 4(B) shows an increase of 16 Da (one oxygen molecule). Glycated peptide [M1+R-2H] 2+ loss two water molecules induced by Fe3+. Aforementioned information suggested that peptide [M1] 2+ combined more oxygen molecule when treated with Fe3+, and Fe3+ had more positive effect than Fe2+ in peptide oxidation at the middle stage of glycation.
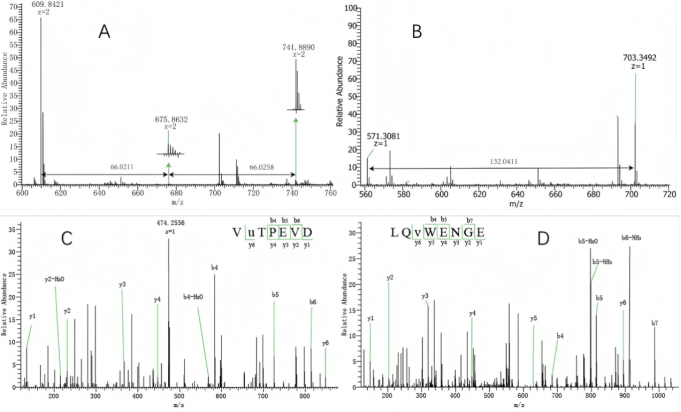
Figure 3. The m/s peaks of glycated peptides by MS spectra at m/z 609.84212+ (A), 571.3081(B). Glycated peptides were identified by mass increasing at 66 Da,132 Da. HCD MS/MS spectrum of mon-glycated peptide 123VuTPEVD129 at arginine with peak m/z at 474.25602+ (C), the glycated site was lysine shown at the glycated peptide 58LQvWENGE65 with peak at 567.27002+ (D).
Table 3. Glycated peptides and glycation sites of β-Lg samples (β-R-0.03-Fe2+, heat treated-β-Lg-D-ribose system with 0.03 mg/mL Fe2+ added; β-R-0.03-Fe3+, heat treated-β-Lg-D-ribose system with 0.03 mg/mL Fe3+ added; β-R-control, heat-treated β-Lg-D-ribose system).

m/z

Delta ppm

Start

End

Sequence

Glycated site

Modified peptide

DSP

β-R-0.03-Fe2+

609.8421+2

0.564

1

11

(-)LIVTQTMKGLD(I)

L1, K8

675.8632+2/741.8890+2

4.5%

451.7583+2

-0.116

12

19

(D)IQKVAGTW(Y)

K14

517.8100+2

2.5%

571.3081+1

-0.881

47

51

(L)KPTPE(G)

K47

703.3492+1

56.01%

502.2462+2

0.785

58

65

(L)LQKWENGE(C)

K60

568.2684+2

42.46%

401.7190+2

0.736

83

89

(F)KIDALNE(N)

K83

467.7312+2

53.03%

408.2165+2

-0.0428

123

129

(L) VRTPEVD (D)

R124

474.2560+2

41.38%

607.3456+1

0.0543

132

135

(E)ALEK(L)

K135

739.3869+1

5.51%

β-R-0.03-Fe3+

609.8417+2

-0.0921

1

11

(-)LIVTQTMKGLD(I)

K8

678.8641+2

3.95%

571.3081+1

-0.881

47

51

(L)KPTPE(G)

K47

703.3351+1

1.95%

502.2460+2

0.386

58

65

(L)LQKWENGE(C)

K60

568.2678+2

31.64%

401.7190+2

0.267

83

89

(F)KIDALNE(N)

K83

467.7298+2

41.75%

408.2164+2

-0.836

123

129

(L)VRTPEVD(E)

R124

474.2557+2

61.71%

β-R-control

609.8418+2

0.072

1

11

(-)LIVTQTMKGLD(I)

K8

675.8632+2

4.41%

579.8057+2

0.00588

95

103

(V)LDTDYKKYL(L)

K100

645.8271+2

1.43%

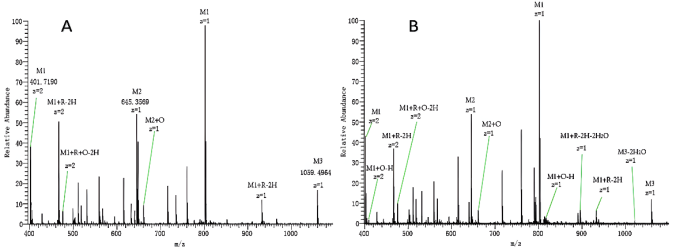
Figure 4. MS spectra with peaks of peptide [M1] 2+, glycated peptide [M1+R-2H] 2+, oxidation glycated peptide [M1+R+O-2H] 2+ when treated with Fe2+ (A). And peptides [M1] 2+, glycated peptide [M1+R-2H] 2+, oxidation peptide [M1+O-H] 2+, oxidation glycated peptide [M1+R+O-2H] 2+, neutral losses glycated peptide [M1+R-2H-2H2O] treated with Fe3+ (B).
3.6. Comparing DSP and Contribution of Fe3+/Fe2+ on Glycation
The glycation extent of the peptide for each sample was calculated by degree of substitution per peptide (DSP). Table 3 shows DSP values of each glycated sites. Fig. 5 shows the exact positions of glycated sites of β-R-0.03-Fe2+, β-R-0.03-Fe3+ and β-R-control. The glycated peptide located on main strands of β-sheet, including 47KPTPE51, 58LQKWENGE65, 83KIDALNE89 and 123VRTPEVD129, and these peptides showed high DSP values. It might be the unfolding of protein secondary and tertiary structure made sugar easily approached to amino groups, like K47, K60, and K83 under iron ions catalyzing. In addition, when glutamine (Q), asparagine (N) and glutamic acid (E) as the neighboring amino acids or situated in vicinity of lysine in the sequence, the lysine has more probability to react with ribose . In addition, K47, K60, K83 and R124 are adjacent hydrophilic amino acid such as Glu, Gln, Asn and Asp (Figure 5), which are exposed to the solvent and accessible to ribose under the treatment conditions. It suggested that the accessibility of Lys/Arg residues and relevant glycation activity was influenced by amino groups and hydrophilic area. Consistent with previous reports that N-terminal leucine can be glycated , and in this study, the glycated sites L1 was found in peptide 1LIVTQTMKGLD11. With the effect of Fe2+, ribose easily approached K135, which located in the hydrophilic area (Figure 5). Asp129, Glu131, Glu134 and Asp137 situated in the vicinity of Lysine, these residues could catalyze the glycation of K135 .
A total of 8 glycated sites were found in the β-R-0.03-Fe2+ sample, 5 in β-R-0.03-Fe3+, and 2 in β-R-control. Both Fe2+ and Fe3+ could promote the β-Lg glycation and generate more glycated sites, but with different extents of glycation. The distinction between Fe2+ and Fe3+ on acceleration glycation was probably due to the protein structure changes and oxidation activation mechanism. Fe2+ induced more glycated sites, such as L1, K14 and K135. The glycated sites K8, K47, K60 and K83 detected in β-R-0.03-Fe2+ showed higher DSP, while β-R-0.03-Fe3+ only revealed the larger DSP at R124. It indicated that more glycated sites and larger DSP values were found in some glycated sites when the protein was treated with Fe2+ than that with Fe3+. The difference in the glycation-promoting effects of Fe2+ and Fe3+ may stem from their distinct mechanisms for inducing protein conformational changes and oxidative activation. The weak Lewis acidity of Fe2+ causes only slight denaturation of the protein conformation, thereby effectively exposing multiple lysine residues without triggering severe aggregation, and consequently promoting the glycation reaction. In contrast, Fe3+, with its strong Lewis acidity and coordination ability, exerts a more drastic effect on protein structure, potentially causing irreversible protein aggregation or precipitation, thereby reducing the number of effective substrates available for glycation . Furthermore, Fe3+ may promote the oxidative degradation of reducing sugars, leading to the depletion of glycosyl donors in the reaction system . These factors collectively result in a reduced number of glycation sites and a relatively lower glycation level observed in the Fe3+-treated group.
In summary, Fe2+ effectively promoted glycation reactions and increased the number of glycation sites by inducing moderate conformational unfolding of proteins, thereby exposing internal lysine residues; In contrast, although Fe3+ possessed a strong ability to disrupt protein structure (as evidenced by significant changes in secondary structure observed in CD spectra), it simultaneously promoted irreversible aggregation and the oxidative degradation of reducing sugars . This might result in a reduction in the number of substrates actually participating in glycation reactions, thereby exerting a relative inhibitory effect on the number of glycation sites.
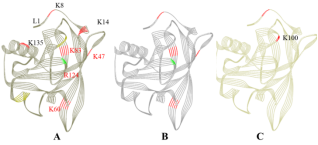
Figure 5. Line ribbon diagram of glycated β-Lg samples (A, β-R-0.03-Fe2+, B, β-R-0.03-Fe3+, C, β-R-control; the glycated lysine residues are colored by red and the glycated arginine residues are colored by green).
4. Conclusions
This study compared the regulatory effects of Fe2+ and Fe3+ on the glycation of β-Lg. The results indicated that both iron ions could promote the glycation reaction, but their effects differ. Fe2+-treated system exhibited higher glycation degree and more glycation sites. A total of 8 glycation sites were identified, which was more than those in the Fe3+-treated system (5 sites) and the control group (2 sites). Fe3+ caused more pronounced alterations on both secondary and tertiary protein structure, promoted the β-Lg unfolding, and changed the protein structure to a more unordered form. In summary, Fe2+ at a specified concentration was a better choice to promote glycation reaction while maintain the protein structure. This study reveals the distinct regulatory mechanisms of iron ions with different valences in the glycation reaction, offering a new perspective on the role of metal ions in protein modification.
Abbreviations

β-Lg

β-Lactoglobulin

LC-HRMS

Liquid Chromatography High-Resolution Mass Spectrometry

UV

Ultraviolet Spectrometry

CD

Circular Dichroism

DTT

DL-Dithiothreitol

OPA

o-Phthalaldehyde

DSP

Degree of Substitution per Peptide

HCD

High-energy C-trap Dissociation

FA

Formic Acid

Author Contributions
Xiongchen Wu: Conceptualization, Data curation, Methodology, Writing – original draft, Writing – review & editing
Qiannan Jiang: Formal Analysis, Visualization, Software
Xueying Zhang: Formal Analysis, Visualization
Xiangjun Zhong: Formal Analysis, Software
Amei Wang: Data curation, Writing – original draft
Hui Wang: Software, Resources
Yueming Hu: Formal Analysis, Supervision, Writing – review & editing
Funding
This research was supported by National Natural Science Foundation of China (no. 32330083, no. 22468031), Jiangxi Provincial Natural Science Foundation (no. 20242BAB25408) and The Central Guidance Fund for Local Science and Technology Development in Jiangxi Province (no. 20252ZDD020002).
Data Availability Statement
The data is available from the corresponding author upon reasonable request.
Conflicts of Interest
The authors declare no conflicts of interest.
References
[1] Cheng, Y. H., Tang, W. J., Xu, Z., Wen, L., Chen, M. L. Structure and functional properties of rice protein-dextran conjugates prepared by the Maillard reaction. International Journal of Food Science and Technology. 2018, 53(2), 372-380.
[2] Liu, J., Ru, Q., Ding, Y. Glycation a promising method for food protein modification: Physicochemical properties and structure, a review. Food Research International. 2012, 49(1), 170-183.
[3] Chobert, J. M., Gaudin, J. C., Dalgalarrondo, M., Haertle, T. Impact of Maillard type glycation on properties of beta-lactoglobulin. Biotechnology Advances. 2006, 24(6), 629-632.
[4] Chen, H. Q., Tu, Z. C., Zhou, Y. R., Xie, Z. H., Zhang, S. Q., Wen, P. W., Liu, J. J., Jiang, Q. N., Wang, H., Hu, Y. M. Insight into the mechanism underlying the reduction of digestibility and IgG/IgE binding ability in ovalbumin during different high-temperature conduction modes-induced glycation. Journal of Agricultural and Food Chemistry. 2024, 72(5), 2801-2812.
[5] Hu, Y. M., Chen, H. Q., Xiao, L., Chu, L. L., Wang, S., Wang, H. Comparison of ovalbumin glycation by microwave irradiation and conventional heating. LWT-Food Science and Technology. 2019, 116, 108560.
[6] Du, P. C., Tu, Z. C., Wang, W., Hu, Y. M. Mechanism of selenium nanoparticles inhibiting advanced glycation end products. Journal of Agricultural and Food Chemistry. 2020, 68, 10586-10595.
[7] Bauer, E. B. Transition metal catalyzed glycosylation reactions-an overview. Organic & Biomolecular Chemistry. 2020, 18(45), 9160-9180.
[8] Kim, E. S., Yaylayan, V. Bis (alaninato) iron (II) complexes as molecular scaffolds for the generation of N, N-di-glycated alanine derivatives in the presence of glucose. Food Chemistry. 2022, 374, 131815.
[9] Chen, B., Huang, W. F., Guo, W. B., Dai, H., Quan, J. H., Zhang, Z. H., Xu, X. Y., Cao, X. D., Zhao, L. Iron-and manganese-catalyzed Maillard chemistry: molecular characteristics, evolution pathways, and implications for soil organic carbon formation. Environmental Science & Technology. 2025, 59(42), 22587-22598.
[10] Hrynets, Y., Bhattacherjee, A., Ndagijimana, M., Martinez, D. J. H., Betti, M. Iron (Fe2+)-catalyzed glucosamine browning at 50 C: identifica-tion and quantification of major flavor compounds for antibacterial activity. Journal of Agricultural and Food Chemistry. 2016, 64(16), 3266-3275.
[11] Xiao, H., Cai, G., Liu, M. Fe2+-catalyzed non-enzymatic glycosylation alters collagen conformation during AGE-collagen formation in vitro. Archives of Biochemistry and Biophysics. 2007, 468(2), 183-192.
[12] Cemil, A. Recent advances and applications in LC-HRMS for food and plant natural products: a critical review. Analytical and Bioanalytical Chemistry. 2020, 412(9), 1973-1991.
[13] Zhang, Q. C., Wang, R., He, J. F., Tang, W., Liu, J. H. Innovative multistep modifications of β-Lactoglobulin for enhanced emulsifying and antioxidant activities. Food Hydrocolloids. 2024, 148, 109465.
[14] Chevalier, F., Chobert, J. M., Popineau, Y., Nicolas, M. G., Haertlé, T. Improvement of functional properties of β-lactoglobulin glycated through the Maillard reaction is related to the nature of the sugar. International Dairy Journal. 2001, 11(3), 145-152.
[15] Leina, E. H., Vanessa, E., Vanessa, C. Maillard reaction: mechanism, influencing parameters, advantages, disad-vantages, and food industrial applications: A Review. Foods. 2025, 14(11), 1881.
[16] Hu, X., Liu, X., Zhang, Y., Yu, Y. L., Zhang, Q. F., Gao, X. Y. Digestive behavior and gut microbiota responses of Glehnia littoralis polysaccharide–Iron complexes: Influence of polysaccharide molecular weight. Food Chemistry: X. 2026, 35, 103777.
[17] Chen, X. X., Zhang, L., Bhesh, B., Zhou, P. Glucose glycation of α-lactalbumin and β-lactoglobulin in glycerol solutions. Journal of Agricultural and Food Chemistry. 2018, 66(40), 10558-10566.
[18] Bian, Z. Y., Tu, Z. C., Wang, H., Hu, Y. M., Liu, G. X. Investigation of the mechanism of 60Co gamma-ray irradiation-stimulated oxidation enhancing the antigenicity of ovalbumin by high-resolution mass spectrometry. Journal of Agricultural and Food Chemistry. 2022, 70(30), 9477-9488.
[19] Hu, Y. M., Guo, H. Z., Wang, H., Yang, Y. F., Tu, Z. C., Huang, T. Insight into the mechanism of urea inhibit ovalbumin-glucose glycation by conventional spectrometry and liquid chromatography-high resolution mass spectrometry. Food Chemistry. 2021, 342, 128340.
[20] Wang, H., Sun, Q., Tan, J. M., Hu, Y. M., Yan, W., Zhen, L., Tu, Z. C. Conformational alteration and the glycated sites in ovalbumin during vacuum freeze-drying induced glycation: A study using conventional spectrometry and liquid chromatography-high resolution mass spectrometry. Food Chemistry. 2020, 318, 126519.
[21] Liu, L., Dong, Q., Kong, Y. M., Kong, Y. R., Yu, Z. Y., Li, B., Yan, H. X., Chen, X., Shen, Y. X. The effect of B-type procyanidin on free radical and metal ion induced β-lactoglobulin glyco-oxidation via mass spectrometry and interaction analysis. Food Research International. 2023, 168, 112744.
[22] Chen, X. M., Kitts, D. D. Correlating changes that occur in chemical properties with the generation of antioxidant capacity in different sugar‐amino acid Maillard reaction models. Journal of Food Science. 2011, 76(6), 831-837.
[23] Qiao, H., Zhu, Z. S., Hua, Y., Guo, X., Huang, M. The role of oxidized myofibrillar protein aggregation and modification in advanced glycation end products formation. Food Chemistry. 2025, 495, 146324.
[24] Murphy, J. M., Powell, B. A., Brumaghim, J. L. Stability constants of bio-relevant, redox-active metals with amino acids: The challenges of weakly binding ligands. Coordination Chemistry Reviews. 2020, 412, 213253.
[25] Sonpasare, K., Lalchandani, D. S., Chenkual, L., Sathala, P. K., Khatoon, R., Porwal, P. K. Effect of glycation-induced concentration-dependent change in albumin structure and alteration in its binding capacity. Journal of Biomolecular Structure and Dynamics. 2025, 43(13), 6488-6497.
[26] Mukherjee, S., Panda, D. Contrasting effects of ferric and ferrous ions on oligomerization and droplet formation of tau: implications in tauopathies and neurodegeneration. ACS Chemical Neuroscience. 2021, 12(23), 4393-4405.
[27] Tu, Z. C., Zhong, B. Z., Wang, H. Identification of glycated sites in ovalbumin under freeze-drying processing by liquid chromatography high-resolution mass spectrometry. Food Chemistry. 2017, 226, 1-7.
[28] She, M. Y., Jia, Z., Zhang, X. Region-selective and site-specific glycation of influenza proteins surrounding the viral envelope membrane. Scientific Reports. 2024, 14(1), 18975.
[29] Chen, Y. J., Liang, L., Liu, X. M., Theodore, P. L., Zhou, P. Effect of fructose and glucose on glycation of β-lactoglobulin in an intermediate-moisture food model system: Analysis by liquid chromatography-mass spectrometry (LC-MS) and data-independent acquisition LC-MS (LC-MSE). Journal of Agricultural and Food Chemistry. 2012, 60(42), 10674-10682.
[30] Doni, D., Passerini, L., Audran, G., Marque, S. R. A., Schulz, M., Santos, J., Costantini, P., Bortolus, M., Carbonera, D. Effects of Fe2+/Fe3+ binding to human frataxin and its D122Y variant, as revealed by site-directed spin labeling (SDSL) EPR complemented by fluorescence and circular dichroism spectroscopies. International Journal of Molecular Sciences. 2020, 21(24), 9619.
[31] Luna, C., Estevez, M. Oxidative damage to food and human serum proteins: Radical-mediated oxidation vs. glyco-oxidation. Food Chemistry. 2018, 267, 111-118.
Cite This Article
  • APA Style

    Wu, X., Jiang, Q., Zhang, X., Zhong, X., Wang, A., et al. (2026). Effects of Fe3+/Fe2+ on Glycation Reaction of β-lactoglobulin. International Journal of Nutrition and Food Sciences, 15(3), 93-103. https://doi.org/10.11648/j.ijnfs.20261503.11

    Copy | Download

    ACS Style

    Wu, X.; Jiang, Q.; Zhang, X.; Zhong, X.; Wang, A., et al. Effects of Fe3+/Fe2+ on Glycation Reaction of β-lactoglobulin. Int. J. Nutr. Food Sci. 2026, 15(3), 93-103. doi: 10.11648/j.ijnfs.20261503.11

    Copy | Download

    AMA Style

    Wu X, Jiang Q, Zhang X, Zhong X, Wang A, et al. Effects of Fe3+/Fe2+ on Glycation Reaction of β-lactoglobulin. Int J Nutr Food Sci. 2026;15(3):93-103. doi: 10.11648/j.ijnfs.20261503.11

    Copy | Download

  • @article{10.11648/j.ijnfs.20261503.11,
      author = {Xiongchen Wu and Qiannan Jiang and Xueying Zhang and Xiangjun Zhong and Amei Wang and Hui Wang and Yueming Hu},
      title = {Effects of Fe3+/Fe2+ on Glycation Reaction of 
    β-lactoglobulin},
      journal = {International Journal of Nutrition and Food Sciences},
      volume = {15},
      number = {3},
      pages = {93-103},
      doi = {10.11648/j.ijnfs.20261503.11},
      url = {https://doi.org/10.11648/j.ijnfs.20261503.11},
      eprint = {https://article.sciencepublishinggroup.com/pdf/10.11648.j.ijnfs.20261503.11},
      abstract = {Iron ions (Fe2+ and Fe3+) are essential trace elements for the human body, and are often added to various foods, but their effects on protein glycation remain unclear. This study evaluated the differential influences of Fe2+ and Fe3+ on the glycation reaction of β-lactoglobulin (β-Lg)-D-ribose system in terms of glycation degree, protein conformation and the distribution of modification sites. Free amino group contents and HPLC HCD MS/MS analyses indicated that both Fe3+ and Fe2+ could catalyze the glycation process and increase the glycated sites. The system contain Fe2+ exhibited higher glycation degree and more glycation sites (8), and lesser glycation sites were identified in system contain Fe3+ (5) and system without ferric ions (2). Additional sites (L1, K14, K135) were facilitated glycation by Fe2+, and most glycation sites showed higher degree of substitution per peptide (DSP) values when with Fe2+. In comparison with Fe2+, Fe3+ caused more pronounced alterations on both secondary and tertiary protein structure, promoted the β-Lg unfolding, and changed the protein structure to a more unordered form. In conclusion, Fe2+ at a specified concentration was a better choice to promote glycation reaction while maintain the protein structure. This study provide a theoretical basis for protein glycation modification with iron ions at different valence states participated.},
     year = {2026}
    }
    

    Copy | Download

  • TY  - JOUR
    T1  - Effects of Fe3+/Fe2+ on Glycation Reaction of 
    β-lactoglobulin
    AU  - Xiongchen Wu
    AU  - Qiannan Jiang
    AU  - Xueying Zhang
    AU  - Xiangjun Zhong
    AU  - Amei Wang
    AU  - Hui Wang
    AU  - Yueming Hu
    Y1  - 2026/05/08
    PY  - 2026
    N1  - https://doi.org/10.11648/j.ijnfs.20261503.11
    DO  - 10.11648/j.ijnfs.20261503.11
    T2  - International Journal of Nutrition and Food Sciences
    JF  - International Journal of Nutrition and Food Sciences
    JO  - International Journal of Nutrition and Food Sciences
    SP  - 93
    EP  - 103
    PB  - Science Publishing Group
    SN  - 2327-2716
    UR  - https://doi.org/10.11648/j.ijnfs.20261503.11
    AB  - Iron ions (Fe2+ and Fe3+) are essential trace elements for the human body, and are often added to various foods, but their effects on protein glycation remain unclear. This study evaluated the differential influences of Fe2+ and Fe3+ on the glycation reaction of β-lactoglobulin (β-Lg)-D-ribose system in terms of glycation degree, protein conformation and the distribution of modification sites. Free amino group contents and HPLC HCD MS/MS analyses indicated that both Fe3+ and Fe2+ could catalyze the glycation process and increase the glycated sites. The system contain Fe2+ exhibited higher glycation degree and more glycation sites (8), and lesser glycation sites were identified in system contain Fe3+ (5) and system without ferric ions (2). Additional sites (L1, K14, K135) were facilitated glycation by Fe2+, and most glycation sites showed higher degree of substitution per peptide (DSP) values when with Fe2+. In comparison with Fe2+, Fe3+ caused more pronounced alterations on both secondary and tertiary protein structure, promoted the β-Lg unfolding, and changed the protein structure to a more unordered form. In conclusion, Fe2+ at a specified concentration was a better choice to promote glycation reaction while maintain the protein structure. This study provide a theoretical basis for protein glycation modification with iron ions at different valence states participated.
    VL  - 15
    IS  - 3
    ER  - 

    Copy | Download

Author Information
  • State Key Laboratory of Food Science and Resources, Nanchang University, Nanchang, China; Jiangxi Agricultural Development Group Co., Ltd, Nanchang, China

  • State Key Laboratory of Food Science and Resources, Nanchang University, Nanchang, China; Nanchang University-Jinggangshan Green Food New Quality Productivity Transformation Center, Nanchang University, Ji’an, China

  • State Key Laboratory of Food Science and Resources, Nanchang University, Nanchang, China; Nanchang University-Jinggangshan Green Food New Quality Productivity Transformation Center, Nanchang University, Ji’an, China

  • State Key Laboratory of Food Science and Resources, Nanchang University, Nanchang, China; Nanchang University-Jinggangshan Green Food New Quality Productivity Transformation Center, Nanchang University, Ji’an, China

  • State Key Laboratory of Food Science and Resources, Nanchang University, Nanchang, China; Nanchang University-Jinggangshan Green Food New Quality Productivity Transformation Center, Nanchang University, Ji’an, China

  • State Key Laboratory of Food Science and Resources, Nanchang University, Nanchang, China; Nanchang University-Jinggangshan Green Food New Quality Productivity Transformation Center, Nanchang University, Ji’an, China

  • State Key Laboratory of Food Science and Resources, Nanchang University, Nanchang, China; Nanchang University-Jinggangshan Green Food New Quality Productivity Transformation Center, Nanchang University, Ji’an, China

  • Abstract
  • Keywords
  • Document Sections

    1. 1. Introduction
    2. 2. Materials and Methods
    3. 3. Results
    4. 4. Conclusions
    Show Full Outline
  • Abbreviations
  • Author Contributions
  • Funding
  • Data Availability Statement
  • Conflicts of Interest
  • References
  • Cite This Article
  • Author Information