Abstract
This thesis is intended to identify psychological impacts of thermal comfort in curtain wall office buildings in A.A (Addis Ababa) city during summer and winter. A detail survey was conducted to identify individual perception of the thermal comfort level and its effect on their psychology in four curtain walled office buildings of CBE (Commercial Bank of Ethiopia) in Kality, kilinto, Adey Ababa and Saris woreda. Curtain wall in general tend to absorb high and low temperature in to the building, therefore the building users are exposed to more than average thermal comfort level, which leads to psychological effect and disturb the optimum thermal comfort level. The objective of the study was to evaluate the thermal comfort level of curtain wall office buildings in Addis Ababa and its psychological impact on the users. The assessment was conducted using methodologies such as subjective evaluation of psychological response of the survey participant to the thermal comfort level of the curtain wall office buildings and the objective study of analysing indoor microclimate thermal comfort level. The psychological effect had high differential effects, out of 80 participants 27% felt sad, 27% felt irritated, 23% felt depressed and only 23% felt happy during summer due to the thermal environment and in winter 40% felt happy, 20% felt depressed, 12% felt sad, 10% felt hesitant, 8% felt irritated, 5% felt motivated and 5% felt confident. Based on the thermal sensitivity vote (TSV) and thermal comfort vote (TCV) male participant were more comfortable during winter cold indoor temperature and female were comfortable with summer or warm indoor temperature, which indicated there is a gender thermal sensitivity and acceptability difference.
Keywords
Thermal Comfort, Psychological Effect, Curtain Wall Office, Gender Sensitivity, PMV-PPD
1. Introduction
We spend about 90% of our time indoors hence thermal comfort is a central theme in the building environment community. Providing thermal comfort requires the application of physiological, environmental, behavioural and psychological variables as well as considering preferred conditions. The definition, though, leans quite heavily towards psychological mechanisms as the most widely accepted definition is “that state of mind that expresses satisfaction with the thermal environment”
| [1] | Comfort EM. Psychology as a Component of the Thermal Experience. |
[1]
.
High rise buildings are becoming the skyline of Addis Ababa, definitely gives an aesthetic value to the cityscape. However, considering the fact that thermal comfort will directly affect the building, it’s inevitable that psychology of the occupant and users will be triggered. Hence the research assessed the emotional, cognitive and behavioural response of the building users to the thermal comfort that they are situated in and how it’s affected their time in the building.
The heat gains or losses to a glazing system are related to the physical properties of glass (conductivity, absorption, reflection, and transmittance) and are a function of the environmental conditions (solar radiation, wind and external/internal air temperatures). Predicting the heat gain or heat loss from a glass façade system is ultimately dependent upon the calculation of the glass surface temperature. In other words, after the physical properties are accounted for with respect to the environmental conditions, we can determine the glass’ surface temperature. Once the temperature is calculated, it is possible to calculate the amount of heat transfer from, or to, the glazing by the building’s occupants by conduction, convection and radiation
| [2] | Duffie J a., Beckman W a. Solar engineering of thermal processes, 3rd edition. Wiley. 2006. |
[2]
.
Thermal comfort impacts our emotion, behavioural and cognitive i.e., our psychology. Therefore, the thermal comfort level is directly corelated to the psychology of the building user
| [3] | Ko WH, Schiavon S, Zhang H, Graham LT, Brager G, Mauss I, et al. The impact of a view from a window on thermal comfort, emotion, and cognitive performance. Build Environ [Internet]. 2020; 175(March): 106779. Available from: https://doi.org/10.1016/j.buildenv.2020.106779 |
[3]
. Curtain wall in general tend to absorb high and low temperature in to the building, therefore the building users are exposed to more than average thermal comfort level, which leads to psychological effect and disturb the optimum thermal comfort level. Based on the thermal comfort level the psychology of the building user is affected different based on gender, age type of building exterior surface
| [4] | Uemae T, Uemae M, Kamijo M. EVALUATION OF PSYCHOLOGICAL AND PHYSIOLOGICAL RESPONSES UNDER GRADUAL CHANGE OF THERMAL CONDITIONS WITH AIM TO CREATE INDEX TO EVALUATE THERMAL COMFORT OF. 2018; 495-503. |
[4]
. As curtain wall office building in Addis Ababa becomes the contemporary surface finish, the impact of its thermal comfort on psychology is not evaluated in depth and based on age and gender. The office workers and staff in curtain wall office buildings are the major users of the building with standard clothing formality for both male and female, however thermal comfort level affects the gender differently
| [5] | Karjalainen S. Gender differences in thermal comfort and use of thermostats in everyday thermal environments. Build Environ. 2007; 42(4): 1594-603. |
[5]
.
Women tend to rate temperatures higher than men, with more responding 'Hot' (32.3% women vs. 21.9% men) and 'Very Hot' (35.5% women vs. 31.3% men). This could be because of variations in clothing or physiological differences
| [6] | Investigating Gender Differences in Occupant Thermal Perception: Case of a College, Jeddah Authors: Berkouk, D., Bouzir, T. A. K., & Mazouz, S. |
[6]
. Strikingly low thermal satisfaction scores have been reported in modern buildings when compared with traditionally designed buildings; only 22% of individuals expressed satisfaction with the thermal conditions in contemporary structures as opposed to 88% in the more traditionally designed buildings. Thermal discomfort in the contemporary workplace has been linked to increased psychological stress and depressive symptoms
| [7] | Indoor Thermal Comfort Analysis of Modern and Traditional Buildings in Ethiopia. 2022. |
[7]
. Most respondents (78.33%) reported being dissatisfied with thermal conditions in fully glazed office spaces. The most heated periods of the day, between 2:30 PM and 4:00 PM, led to a notable decrease in productivity due to excessive indoor temperature rise
| [8] | The Impact of Glass Facade on Users’ Comfort: The Case of Radiation-Vulnerable Offices in Addis Ababa. 2022. |
[8]
.
Users in the study adapted to thermal discomfort by changing clothing insulation and opening windows (Δclo = 0.3). Even so, the application of the PMV model showed an error in dynamic environments which was overestimating thermal sensation by 1.5 points
| [9] | Investigative Study on Adaptive Thermal Comfort in Office Buildings with Evaporative Cooling Systems. 2022. |
[9]
. Solar radiation coming through the window resulted in a mean radiant temperature increase of 7.8°C, establishing clear radiant heating zones. Under these circumstances, standard models for estimating thermal comfort consistently underestimated the discomfort experienced by occupants by about 0.5°C relative to what was recorded
| [10] | The Effects of Exterior Glazing on Human Thermal Comfort in Office Buildings. 2022. |
[10]
.
The investigation identified substantial thermal discomfort among the occupants, with 54% experiencing hot feelings and 62% feeling dissatisfied with their thermal conditions. More importantly, cognitive evaluation scores showed substantial impairment, whereby 75% of subjects had MoCA <26, and there was an evident relationship between thermal discomfort and decreased cognitive performance
| [11] | Thermal Comfort and Cognitive Performance under Glass Facade Buildings. Rizkiyah et al. (2023, data collected 2021-2022). |
[11]
. Only 56.2% of them enjoyed thermal comfort in the range of the standardized sensation scale. In these low-energy buildings, behavioural adaptations driven by occupants - particularly through clothing and activity control - played a key role in minimizing discomfort
| [12] | Study on Adaptive Thermal Comfort Model and Behavioral Adaptations in Ethiopia. 2020. |
[12]
. Passive cooling solutions immensely improve occupant comfort and significantly lower building energy consumption. However, the lack of necessary energy efficiency standards in tropical environments still holds back progress, leading to increased thermal discomfort and additional energy needs
| [13] | Assessment of Thermal Comfort and Its Potential for Energy Efficiency in Low-Income Tropical Buildings. Kajjoba et al. (2022). |
[13]
.
The general objective of the study is to evaluate the thermal comfort level of curtain wall office buildings in Addis Ababa and its psychological impact on the users. The specific objective are as follow:
1) To evaluate the thermal comfort level of curtain wall office buildings in Addis Ababa
2) To identify how the indoor microclimate is affecting occupant’s psychology
3) To identify if the psychological response to the thermal comfort is different between genders
2. Material and Methodology
2.1. Research Sample and Respondents
The study was conducted at four curtain wall office building, which were Commercial Bank of Ethiopia branch offices in Addis Ababa Ethiopia as shown in
Table 1. All buildings are multistorey. The locations are spread out across Nifas Silk Lafto sub city and Akaki sub city.
Table 1 shows the location of the buildings studied. First building is the CBE (Commercial Bank of Ethiopia) kilinto branch located at kality sub city kilinto in front of Addis Ababa Science and Technology University, the second building is the CBE Salo Gora branch kality sub city kality total, the third building is the CBE Nifas Silk branch in front of saris train station and the fourth building is the CBE Adey Ababa branch Behind saris train station.
Table 1. Study building’s location and façade treatment.
Building | Location | Façade treatment |
CBE Kilinto Branch | is located in Akaki kality sub city, kilinto. | Double glazed window and door, curtain wall. |
CBE Salo Gora Branch | is located in Akaki kality sub city, kality Total. | Double glazed window and door, curtain wall. |
CBE Nifas Silk Branch | is located in Nifas silk kifle ketema, Saris. | Double glazed window and door, curtain wall. |
CBE Adey Ababa Branch | is located in Nifas silk kifle ketema, Adey Ababa. | Double glazed window and door, curtain wall. |
The survey and measurement were conducted in summer(May) and winter(July) period therefore the respondents are categorized with this respective. As shown in
Table 2, the total respondents participated during summer and winter are 80 people, 40 respondents during both periods. 60% of the summer respondent were aged between 18-29 and 40% aged between 30-39. 52% of the winter respondent were aged between 18-29, 40% between 30-39 and 8% between 40-49. 50% of the respondent were male and 50% female during both summer and winter. 50% of the respondent were staff during both summer and winter and 0% customers.
Table 2. Respondents’ demographic information.
Participants | Age | Gender | Participant | Total Participant |
18-29 | 30-39 | 40-49 | Male | Female | Staff | Customer |
Summer | 60% | 40% | | 50% | 50% | 50% | 50% | 80 People |
Winter | 52% | 40% | 8% | 50% | 50% | 50% | 50% |
2.2. Research Instrumentation
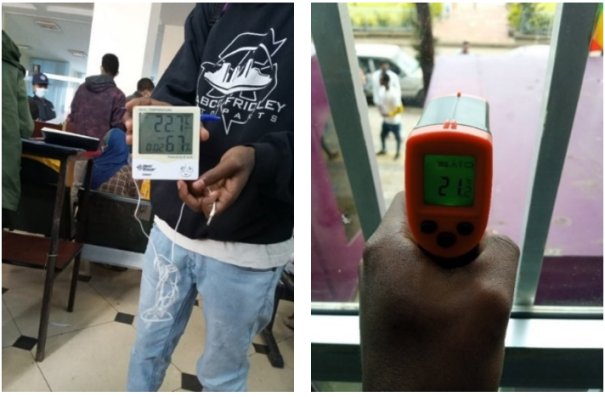
The study was carried out using different instruments. Dual Temperature Hygrometer smart sensor AR 867 to measure the Air temperature and Humidity. Surface temperature thermometer to measure the surface temperature of the curtain wall glass and floor temperature.
Figure 1. Dual Temperature Hygrometer smart sensor AR 867 (left) and Surface temperature thermometer (right).
2.3. Data Collection
The primary data was collected through survey and questionnaire. The collection of the data was carried out as follow:
1) Survey on objective measurement was conducted to collected the thermal environment (Indoor microclimate) data during summer (May)and winter (July). The equipment used to measure the temperature and Humidity was set on the table at 120 cm above the floor level. While the air speed and surface temperature were hand held.
2) Survey on subjective measurement was conducted to measure the general thermal comfort and its psychological effect on the respondents. The survey was conducted through questionnaire, which was adopted partially from Wong and Khoo and it has been used in previous studies. The questionnaire contains five parts, which include the thermal environment, humidity, air movement, brightness level and the psychological response. Questionnaire sample was adopted from ASHRAE 55
| [14] | Mora R, Offermann FJ, Rice DJ, Eddy J, Int-hout D, Rose DM, et al. Thermal environmental conditions for human occupancy. ASHRAE Stand. 2013; 8400(55). |
[14]
.
2.4. Data Processing and Analyses
The data was analysed with spreadsheet software Microsoft excel. The MS excel spreadsheet was used to calculate the mean value, percentile and average of variables and to generate table and charts.
3. Results and Discussion
3.1. Case Study Building Conditions
The office building indoor microclimate condition was recorded from the four selected offices during summer (May) and winter (July) periods. The survey was conducted on different eight day during both periods (summer and winter) high temperature and low temperature hours.
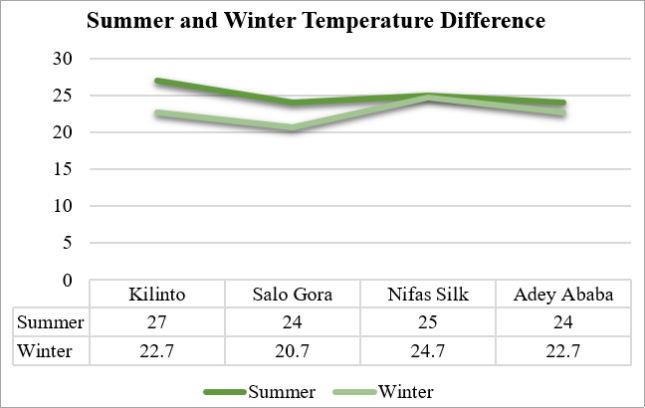
Figure 2 shows the Average temperature of the four selected buildings in summer and winter. The average temperature in Kilinto branch during summer and winter was 27°C and 22.7°C respectively. The average temperature in Salo Gora branch during summer and winter was 24°C and 20.7°C respectively. The average temperature was Nifas Silk branch during summer and winter is 25°C and 24.7°C respectively. The average temperature in Adey Ababa branch during summer and winter was 24°C and 22.7°C respectively. And average of summer temperature and winter is temperature was 25°C and 22.7°C respectively.
Figure 2. Summer and winter temperature difference.
The survey conducted on humidity is shown in
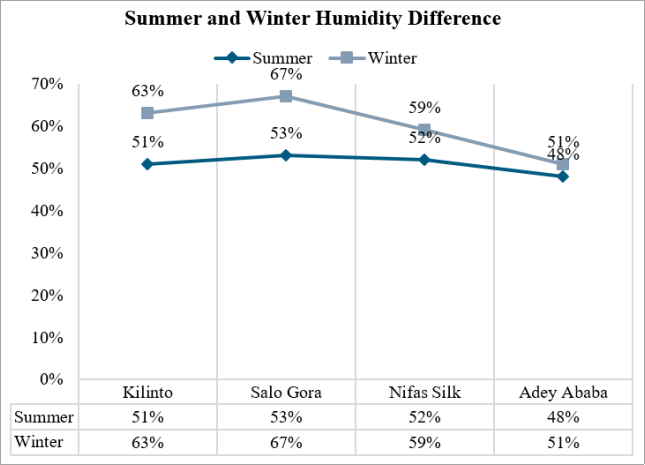
Figure 3. The Average humidity of the four selected buildings in summer and winter. The average humidity in Kilinto branch during summer and winter was 51% and 63% respectively. The average humidity in Salo Gora branch during summer and winter was 53% and 67% respectively. The average humidity in Nifas Silk branch during summer and winter was 52% and 59% respectively. The average humidity in Adey Ababa branch during summer and winter was 48% and 51% respectively. And average of summer humidity and winter is temperature was 51% and 60% respectively.
Figure 3. Summer and winter humidity difference.
3.2. Predictive Mean Vote and Predicted Percentage Dissatisfaction
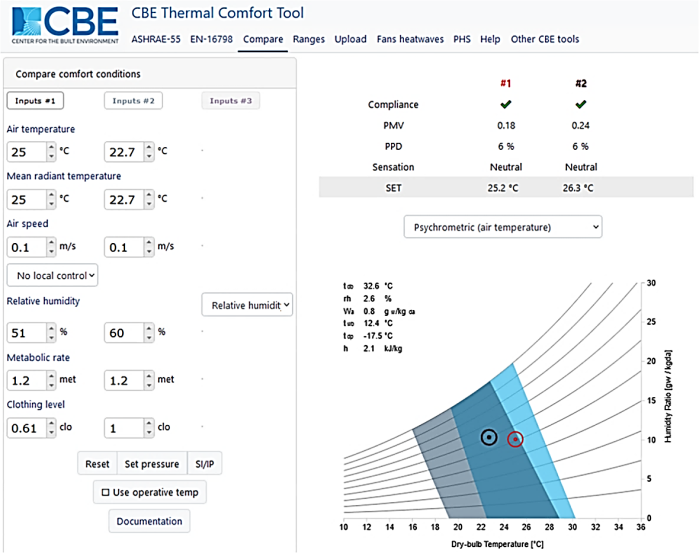
As shown in
Figure 4, Predictive Mean Vote (PMV) is 0.18 during summer and 0.24 during winter which is compliance to ASHRAE 55, Predicted Percentage Dissatisfaction (PPD) is 6% during both summer and winter also compliance with ASHRAE 55.
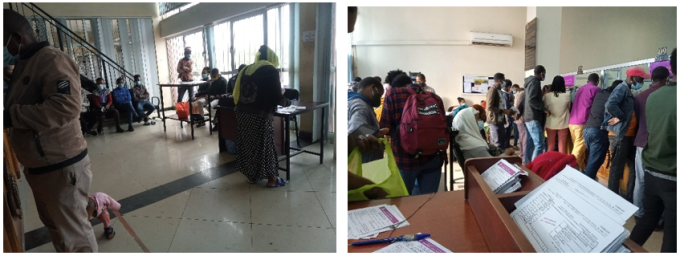
Figure 5. Study location indoor sample image.
3.3. Participants’ Responses to the Thermal Environment
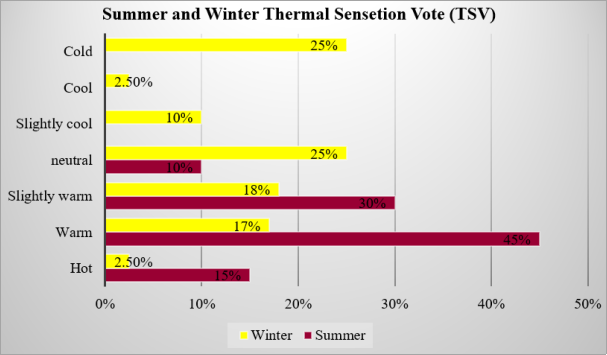
Participants’ response to the thermal environment in the office based on the evaluation of thermal sensation votes (TSV) during summer and winter are shown in
Figure 6. As shown in
Figure 6, 10% of respondents voted the Neutral (0) during summer and 25% of respondents during winter, 30% of the respondents voted Slightly warm (+1) during summer and 18% of respondents voted during winter, while 10% of respondents voted Slightly cool (-1) during winter and none voted during summer. 45% of respondents voted warm (+2) during summer and 17% of respondents voted during winter, while 2.5% of respondent voted Cool (-2) during winter and none voted during summer. 15% of respondents voted Hot (+3) during Summer and 2.5% of respondents voted during winter, while 25% of respondent Cold (-3) during winter and none voted during summer.
Figure 6. Contrast between summer and winter thermal sensation vote (TSV).
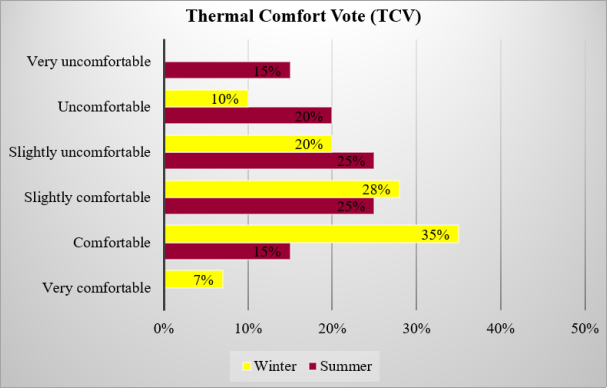
Figure 7 shows respondents’ thermal comfort votes, 25% of respondent voted Slightly comfortable during summer and 28% of respondent voted during winter, while 25% of respondent voted Slightly uncomfortable during summer and 20% of respondent voted during winter. 15% of respondent voted comfortable during summer and 35% of respondent voted during winter, while 20% of respondent voted uncomfortable during summer and 10% of respondent voted during winter. Only 7% of respondent voted very comfortable during winter and none voted during summer, while 15% of respondent voted very uncomfortable during summer and none voted during winter.
Figure 7. Contrast between summer and winter thermal comfort vote.
Respondents’ thermal preference for summer and winter, 75% of participants voter for cooler thermal environment during summer and 20% of participants voted during winter, while 25% of participants voted no change during summer and 40% of participants voted during winter. 40% of participants voted warmer during winter and none voted during summer.
Respondents’ thermal judgement for summer and winter, 40% of participants voter for acceptable thermal environment during summer and 65% of participants voted during winter, while 60% of participants voted unacceptable during summer and 35% of participants voted during winter.
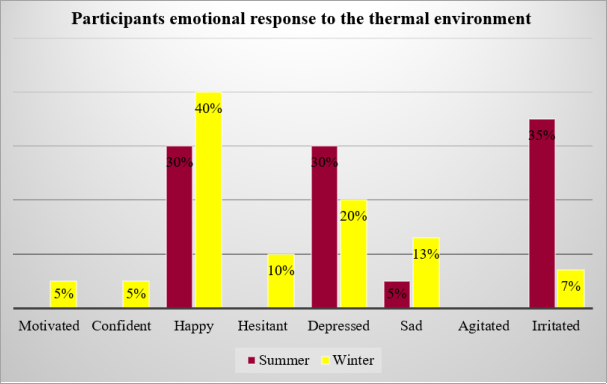
Participants’ emotional response to the thermal environment is shown in
Figure 8. The psychological response of the participant to the thermal environment is conducted through survey questionnaire with possible psychological response options to choose. 5% of the respondent felt motivated due the thermal environment during winter, 5% confident during winter.23% of respondent felt happy during summer and 40% of respondent during winter, while 10% felt hesitant during winter. 23% of respondent felt depressed due to the thermal environment during summer and 20% of respondent during winter. 27% of respondent felt sad during summer and 12% of respondent during winter. 27% of respondent felt irritated during summer and 8% of respondent during winter.
Figure 8. Participants emotional (psychological) response to the thermal environment.
3.4. Participants’ Responses to the Humidity
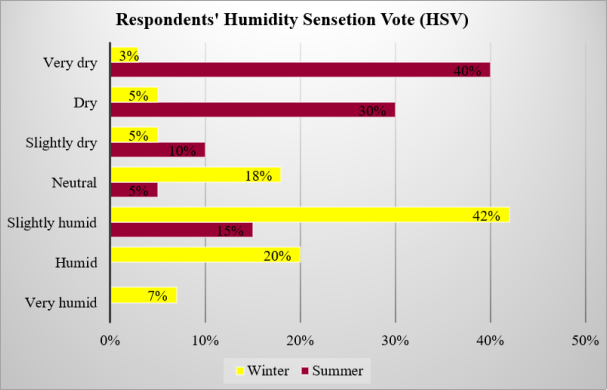
Participants’ response to humidity in the office based on the evaluation of humidity sensation votes (HSV) during summer and winter are shown in
Figure 9. As shown in
Figure 9, 5% of respondents voted the Neutral (0) during summer and 18% of respondents voted during winter, 15% of the respondents voted Slightly humid (+1) during summer and 42% of respondents voted during winter, while 10% of respondents voted Slightly dry (-1) during winter and 5% of respondent voted during summer. 20% of respondents voted Humid (+2) during winter and none during summer, while 5% of respondent voted Dry (-2) during summer and 30% of respondent voted during winter. 7% of respondents voted Very humid (+3) during winter and none voted during summer, while 40% of respondent Very dry (-3) during summer and only 3% of respondent voted during winter.
Figure 9. Respondents’ humidity sensation vote (HSV).
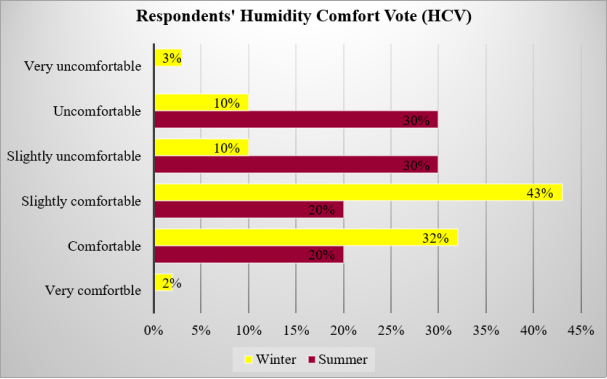
Respondents’ humidity comfort votes are shown in
Figure 10, 20% of respondent voted Slightly comfortable during summer and 43% of respondent voted during winter, while 30% of respondent voted Slightly uncomfortable during summer and 10% of respondent voted during winter. 20% of respondent voted comfortable during summer and 32% of respondent voted during winter, while 30% of respondent voted uncomfortable during summer and 10% of respondent voted during winter. Only 2% of respondent voted very comfortable during winter and none voted during summer, while only 3% of respondent voted very uncomfortable during winter and none voted during summer.
Figure 10. Respondents’ Humidity Comfortable Vote (HCV).
Participants’ humidity preference during summer and winter, 55% of respondents voted more humid during summer and 17% of respondent voted during winter. While 45% of respondents voted for no change during summer and 50% of respondents voted during winter. 33% of respondents voted dryer humidity during winter.
Participants’ humidity judgement during summer and winter, 55% of respondents voted acceptable during summer and 67% of respondent voted during winter. While 45% of respondents voted for unacceptable during summer and 35% of respondents voted during winter.
3.5. Participants Psychological Response Survey
The survey also included the assessment on what level did the thermal comfort affected respondent’s concentration during summer and winter. Respondent concentration affected due to thermal comfort on both seasons. 15% of respondent voted Not effected during summer and 12% of respondent voted during winter. 40% of respondent voted slightly affected during summer and 32% of respondent voted during winter. 25% of respondent voted Affected during summer and 28% of respondent voted during winter. 20% of respondent voted Highly affected during summer and 15% of respondent voted during winter. And only 13% of respondent voted during winter and none voted during summer.
The level of effect thermal comfort has on productivity (work performance) on staffs were surveyed during summer and winter. Based on the staff perception on how much the thermal affected their work performance. 15% of staff respondent voted Not affected due to thermal comfort during winter. Only 15% of respondent voted Slightly affected during wind and none of respondent voted during summer. 60% of respondent voted work performance was Affected both during summer and winter. 40% of respondent voted highly affected during summer and only 10% voted during winter.
The level of effect thermal comfort has on service satisfaction on customer were surveyed during summer and winter. Based on the customer perception on how much the thermal affected their service satisfaction. 10% of customer respondents voted their satisfaction with the service was not affected due to the thermal comfort during summer and 20% of respondent voted during winter. 50% of respondent voted slightly affected during summer and 20% of respondent voted during winter. 20% of respondent voted affected during summer and 25 of respondent voted during winter. 20% of respondent voted highly affected during summer and 25% of respondent voted during winter. Only 10% of respondent voted extremely affected during winter and none voted during summer.
Survey was collected from both customers and staff respondent on how much thermal comfort affected their stress level. Respondent vote on what level did thermal comfort affected their stress level. 10% of respondent voted Not affected during summer and 17% of respondent voted during winter. 35% of respondent voted slightly affected during summer and 13% of respondent voted during winter. 45% of respondent voted affected during summer and 40% of respondent voted during winter. 10% of respondent voted highly affected during summer and 25% of respondent voted during winter. Only 5% of respondent voted Extremely affected during winter and none voted during summer.
Finally, survey conducted on how much respondent felt the curtain wall affected thermal comfort. Respondent perception how much curtain wall affected thermal comfort level in the office. Only 5% voted thermal comfort was not affected due to the curtain wall during summer and 17% of respondent voted not affected during winter. 25% of respondent during summer voted slightly affected and 27% of respondent voted during winter. 40% of respondent voted affected during summer and 23% of respondent voted during winter. 30% of respondent voted highly affected during summer and 28% of respondent voted during winter. Only 5% of respondent voted extremely affected during winter and none voted during summer.
4. Discussion
The study buildings condition of the surveyed CBE offices shows optimum thermal environments. The indoor air temperature ranging from 25°C to 22.7°C average during summer and winter, which is the optimum thermal comfort zone as specified in the ASHRAE 55 standard. The relative humidity ranging from 51% and 60% on average during summer and winter respectively, also optimum relative humidity thermal comfort zone as specified in ASHRAE 55 standard.
The indoor thermal environment in both season (summer and winter) are in compliance with ASHERAE with PMV, PPD and sensation. PMV for summer and winter was 0.18 and 0.24 respectively, PPD for summer and winter was 6% in both seasons. And finally sensation was neutral on each season based on computer generated result with CBE Thermal Comfort Tool.
TSV from summer and winter survey shows male tend to be more sensitive with the warm thermal environment and female tend to be more sensitive toward cold environment. TSV also indicates occupants tend to feel neutral thermal more during winter than summer. TCV indicates male occupants are more likely to feel thermal comfort during winter or colder environment, while female occupant is more comfortable during summer or warm environment and participants thermal preference indicates relatively the same output. Based on participants thermal judgement, the thermal level is more acceptable during winter with a female majority vote. However, also in the case of summer females seems to accept the thermal more than males.
The survey indicates participants felt different emotion ranging from happiness, depressed to irritated due the thermal environment. Happiness is the major emotion during both seasons, however depression, sadness and irritation due to the indoor thermal environment are the ones unpredicted the most. as seen in TSV and TCV females tend to be happier with in thermal environment more than males. Depression among the genders seem to be equal in both seasons. Although Irritation due to thermal is fairly high during summer its also not significant during winter and males are irritated than female significantly in both seasons. Sadness can be seen more in female and hesitation in male.
HSV result indicates participants felt very dry humidity level during summer although the humidity level is generally in ASHRAE standard. During winter participants were wore sensitive to humidity more. HCV show humidity level during both seasons seems relatively more comfortable for female respondents than male and more uncomfortable for males during summer. Participant’s humidity preference indicated that male prefer little more humidity than female during summer and during winter male prefer dryer humidity while significant number of females prefer more humidity. Humidity acceptability shows in both seasons its more acceptable.
The thermal level tends to affect the concentration of respondent highly specially during summer. Males are more affected in relative to females. In overall view staffs were more affected than the customers concentration wise.
The survey done on staff to assess the level of thermal comfort effect on their work productivity show that with exception of 15% respondent during winter, the other staff indicated that it highly affects them specially during summer. Female are more affected specially during winter.
Also, the survey done on customer respondents how much effect does the thermal comfort had on their service experience and satisfaction indicated that majority of respondents were affected. The customer respondents were highly affected during the winter season. Male respondents were affected more during summer and female during the winter.
Generally, more than 80% of respondents perceive thermal comfort level has affected their stress during both seasons. More than 50% of respondent their feeling of stress is directly related to thermal comfort. Only during summer was customer more affected with stress than staff and female are more stress due to thermal condition during winter while males are more stressed during summer.
Based on the survey how much the participants perceive the curtain wall had affected the thermal condition, during both seasons’ respondent felt it had affected highly. Specially during summer where only 5% of female staff feeling it had no effect.
5. Conclusion
Based on the TSV and TCV male participant were more comfortable during winter cold indoor temperature and female were comfortable with summer or warm indoor temperature, which indicated there is a gender thermal sensitivity and acceptability difference. Both for the staff and customer thermal comfort affects them emotionally, 2-3 person out of 10 person leaves or stays in the building feeling depressed, at least 1 person out of 10 leaves and stay feeling sad, and unexpectedly 3-4 person out of 10 leaves and stay feeling irritated and this can clearly be seen from both staff and customers in the building. The humidity level was another area where the female and male preference differs, male respondent would prefer more humidity in the summer and dryer in winter season, while small number of female respondents prefer more humidity during winter which is directly related to the types of cloth, they wear specially the staff respondents.
The study indicated that respondent’s concentration can be highly affected due to the thermal comfort level, 90% of staff perceived that thermal comfort also has direct effect on their work productivity and performance. Not only the staffs but the customers also highly feel their office experience and service satisfaction can be highly affected due to the thermal condition. Not only the study show that the respondent feels emotion and cognitive but also behavioural aspect which is why more than 50% of respondent feel the thermal condition caused them stress during their stay in the building. Majority of respondent feel that curtain wall has high effect on thermal comfort level, which is why they feel warm or cold during summer and winter respectively with analysing the indoor environment.
6. Recommendations
The study shows the need for further controlled test and research on gender thermal sensitivity and acceptability which would potentially update and include all gender comfortability for thermal standard. The other major recommendation would be to circulate the air more and limiting the number of people in the building. Last when using curtain wall for offices there needs to HVAC system which would be set to the appropriate temperature and humidity considering both genders.
Abbreviations
A.A | Addis Ababa |
AASTU | Addis Ababa Science and Technology University |
PMV | Predictive Mean Vote |
PPD | Predicted Percentage Dissatisfaction |
IAQ | Indoor Air Quality |
TSV | Thermal Sensation Vote |
TCV | Thermal Comfort Vote |
HSV | Humidity Sensation vote |
HCV | Humidity Comfort Vote |
AMSV | Air Movement Sensation Vote |
AMCV | Air Movement Comfort Vote |
BSV | Brightness Sensation Vote |
BCV | Brightness Comfort Vote |
ASHRAE | American Society of Heating, Refrigerating and Air-conditioning Engineers |
Acknowledgments
The study was funded by Addis Ababa Science and Technology University. We thank the College of Architecture and Civil Engineering, Department of Architecture.
Conflicts of Interest
The authors declare no conflicts of interest.
Appendix
Table 1. Questionnaire Survey.
Participant demographic information |
Q1. Age |
[ ] 18-29 [ ] 30-39 [ ] 40-49 [ ] 50 and above |
Q2. Gender |
[ ] Male [ ] Female |
Q3. Participant is |
[ ] Office Worker [ ] Customer |
1.Temperature |
Q1.1 How do you feel about the thermal environment at this precise moment in your room? I feel: |
[ ] hot [ ] neutral [ ] warm [ ] slightly cool [ ] cool [ ] slightly warm [ ] cold |
Q1.2 How do you find the thermal environment of your room? |
[ ] very comfortable [ ] slightly uncomfortable [ ] Comfortable [ ] slightly comfortable [ ] uncomfortable [ ] very uncomfortable |
Q1.3 Please state how would you prefer to be now: |
[ ] warmer [ ] No change [ ] cooler |
Q1.4 How do you judge the thermal environment? |
[ ] Acceptable [ ] Unacceptable |
Q1.5 What is your emotional response to the temperature in the office? |
[ ] motivated [ ] depressed [ ] confident [ ] sad [ ] happy [ ] hesitant [ ] agitated [ ] irritated |
2 Humidity |
Q2.1 How do you feel about the humidity in your room? I feel: |
[ ] Very humid [ ] slightly dry [ ] humid [ ] slightly humid [ ] neutral [ ] dry [ ] very dry |
Q2.2 How do you find the humidity of your room? |
[ ] very comfortable [ ] slightly uncomfortable [ ] Comfortable [ ] slightly comfortable [ ] uncomfortable [ ] very uncomfortable |
Q2.3 Please state how would you prefer to be now: |
[ ] More humid [ ] No change [ ] dryer |
Q2.4 How do you judge the humidity in your room? |
[ ] Acceptable [ ] Unacceptable |
Instruction: Using the 5-point scale shown below. Rate the following questions by placing a check in the box. Scale 1 (not affected), 2 (slightly affected), 3 (affected), 4 (highly affected), 5 (extremely affected)
No.5 | Questionnaire survey | 1 | 2 | 3 | 4 | 5 |
Q5.1 | What level of effect does thermal comfort have on your concentration? | | | | | |
Q5.2 | What level of effect does thermal comfort have on your work performance? (Fill only if you are staff) | | | | | |
Q5.3 | What level of effect does thermal comfort have on your service satisfaction? (Fill only if you are customer) | | | | | |
Q5.4 | What level of stress do you feel due to the thermal comfort? | | | | | |
Q5.5 | Do you feel the curtain wall affected the thermal comfort? | | | | | |
References
| [1] |
Comfort EM. Psychology as a Component of the Thermal Experience.
|
| [2] |
Duffie J a., Beckman W a. Solar engineering of thermal processes, 3rd edition. Wiley. 2006.
|
| [3] |
Ko WH, Schiavon S, Zhang H, Graham LT, Brager G, Mauss I, et al. The impact of a view from a window on thermal comfort, emotion, and cognitive performance. Build Environ [Internet]. 2020; 175(March): 106779. Available from:
https://doi.org/10.1016/j.buildenv.2020.106779
|
| [4] |
Uemae T, Uemae M, Kamijo M. EVALUATION OF PSYCHOLOGICAL AND PHYSIOLOGICAL RESPONSES UNDER GRADUAL CHANGE OF THERMAL CONDITIONS WITH AIM TO CREATE INDEX TO EVALUATE THERMAL COMFORT OF. 2018; 495-503.
|
| [5] |
Karjalainen S. Gender differences in thermal comfort and use of thermostats in everyday thermal environments. Build Environ. 2007; 42(4): 1594-603.
|
| [6] |
Investigating Gender Differences in Occupant Thermal Perception: Case of a College, Jeddah Authors: Berkouk, D., Bouzir, T. A. K., & Mazouz, S.
|
| [7] |
Indoor Thermal Comfort Analysis of Modern and Traditional Buildings in Ethiopia. 2022.
|
| [8] |
The Impact of Glass Facade on Users’ Comfort: The Case of Radiation-Vulnerable Offices in Addis Ababa. 2022.
|
| [9] |
Investigative Study on Adaptive Thermal Comfort in Office Buildings with Evaporative Cooling Systems. 2022.
|
| [10] |
The Effects of Exterior Glazing on Human Thermal Comfort in Office Buildings. 2022.
|
| [11] |
Thermal Comfort and Cognitive Performance under Glass Facade Buildings. Rizkiyah et al. (2023, data collected 2021-2022).
|
| [12] |
Study on Adaptive Thermal Comfort Model and Behavioral Adaptations in Ethiopia. 2020.
|
| [13] |
Assessment of Thermal Comfort and Its Potential for Energy Efficiency in Low-Income Tropical Buildings. Kajjoba et al. (2022).
|
| [14] |
Mora R, Offermann FJ, Rice DJ, Eddy J, Int-hout D, Rose DM, et al. Thermal environmental conditions for human occupancy. ASHRAE Stand. 2013; 8400(55).
|
| [15] |
Tartarini F, Schiavon S, Cheung T, Hoyt T. CBE Thermal Comfort Tool: Online tool for thermal comfort calculations and visualizations. SoftwareX [Internet]. 2020; 12: 100563. Available from:
https://doi.org/10.1016/j.softx.2020.100563
|
Cite This Article
-
APA Style
Bogi, N. D., Sokido, D. L. (2025). The Psychological Effect of Thermal Comfort in Curtain Wall Office Buildings: The Case of Addis Ababa City. International Journal of Psychological Science, 5(3), 74-85. https://doi.org/10.11648/j.ijps.20250503.14
 Copy
|
Copy
|
 Download
ACS Style
Bogi, N. D.; Sokido, D. L. The Psychological Effect of Thermal Comfort in Curtain Wall Office Buildings: The Case of Addis Ababa City. Int. J. Psychol. Sci. 2025, 5(3), 74-85. doi: 10.11648/j.ijps.20250503.14
Copy
|
Download
AMA Style
Bogi ND, Sokido DL. The Psychological Effect of Thermal Comfort in Curtain Wall Office Buildings: The Case of Addis Ababa City. Int J Psychol Sci. 2025;5(3):74-85. doi: 10.11648/j.ijps.20250503.14
Copy
|
Download
-
@article{10.11648/j.ijps.20250503.14,
  author = {Negeso Doti Bogi and Daniel Lirebo Sokido},
  title = {The Psychological Effect of Thermal Comfort in Curtain Wall Office Buildings: The Case of Addis Ababa City
},
  journal = {International Journal of Psychological Science},
  volume = {5},
  number = {3},
  pages = {74-85},
  doi = {10.11648/j.ijps.20250503.14},
  url = {https://doi.org/10.11648/j.ijps.20250503.14},
  eprint = {https://article.sciencepublishinggroup.com/pdf/10.11648.j.ijps.20250503.14},
  abstract = {This thesis is intended to identify psychological impacts of thermal comfort in curtain wall office buildings in A.A (Addis Ababa) city during summer and winter. A detail survey was conducted to identify individual perception of the thermal comfort level and its effect on their psychology in four curtain walled office buildings of CBE (Commercial Bank of Ethiopia) in Kality, kilinto, Adey Ababa and Saris woreda. Curtain wall in general tend to absorb high and low temperature in to the building, therefore the building users are exposed to more than average thermal comfort level, which leads to psychological effect and disturb the optimum thermal comfort level. The objective of the study was to evaluate the thermal comfort level of curtain wall office buildings in Addis Ababa and its psychological impact on the users. The assessment was conducted using methodologies such as subjective evaluation of psychological response of the survey participant to the thermal comfort level of the curtain wall office buildings and the objective study of analysing indoor microclimate thermal comfort level. The psychological effect had high differential effects, out of 80 participants 27% felt sad, 27% felt irritated, 23% felt depressed and only 23% felt happy during summer due to the thermal environment and in winter 40% felt happy, 20% felt depressed, 12% felt sad, 10% felt hesitant, 8% felt irritated, 5% felt motivated and 5% felt confident. Based on the thermal sensitivity vote (TSV) and thermal comfort vote (TCV) male participant were more comfortable during winter cold indoor temperature and female were comfortable with summer or warm indoor temperature, which indicated there is a gender thermal sensitivity and acceptability difference.
},
 year = {2025}
}
Copy
|
Download
-
TY  - JOUR
T1  - The Psychological Effect of Thermal Comfort in Curtain Wall Office Buildings: The Case of Addis Ababa City

AU  - Negeso Doti Bogi
AU  - Daniel Lirebo Sokido
Y1  - 2025/09/23
PY  - 2025
N1  - https://doi.org/10.11648/j.ijps.20250503.14
DO  - 10.11648/j.ijps.20250503.14
T2  - International Journal of Psychological Science
JF  - International Journal of Psychological Science
JO  - International Journal of Psychological Science
SP  - 74
EP  - 85
PB  - Science Publishing Group
SN  - 2994-7162
UR  - https://doi.org/10.11648/j.ijps.20250503.14
AB  - This thesis is intended to identify psychological impacts of thermal comfort in curtain wall office buildings in A.A (Addis Ababa) city during summer and winter. A detail survey was conducted to identify individual perception of the thermal comfort level and its effect on their psychology in four curtain walled office buildings of CBE (Commercial Bank of Ethiopia) in Kality, kilinto, Adey Ababa and Saris woreda. Curtain wall in general tend to absorb high and low temperature in to the building, therefore the building users are exposed to more than average thermal comfort level, which leads to psychological effect and disturb the optimum thermal comfort level. The objective of the study was to evaluate the thermal comfort level of curtain wall office buildings in Addis Ababa and its psychological impact on the users. The assessment was conducted using methodologies such as subjective evaluation of psychological response of the survey participant to the thermal comfort level of the curtain wall office buildings and the objective study of analysing indoor microclimate thermal comfort level. The psychological effect had high differential effects, out of 80 participants 27% felt sad, 27% felt irritated, 23% felt depressed and only 23% felt happy during summer due to the thermal environment and in winter 40% felt happy, 20% felt depressed, 12% felt sad, 10% felt hesitant, 8% felt irritated, 5% felt motivated and 5% felt confident. Based on the thermal sensitivity vote (TSV) and thermal comfort vote (TCV) male participant were more comfortable during winter cold indoor temperature and female were comfortable with summer or warm indoor temperature, which indicated there is a gender thermal sensitivity and acceptability difference.

VL  - 5
IS  - 3
ER  -
Copy
|
Download