1. Introduction
1.1. Overview
The optimization of production processes is a critical determinant of success in today's fiercely competitive marketplace, particularly in industries like bottled water production where efficient resource management directly translates into profitability and market share
| [9] | Smith, J., & Doe, A. (2023). Optimization techniques in beverage production: A review of linear programming applications. Journal of Food Process Engineering, 46(4), e14345.
https://doi.org/10.1111/jfpe.14345 |
| [14] | Feng, X., & Zhang, Q. (2023). Linear programming for capacity planning and profit optimization in the bottled water industry. Journal of Cleaner Production, 382, 135234.
https://doi.org/10.1016/j.jclepro.2022.135234 |
[9, 14]
. Companies must continuously navigate challenges such as cost efficiency, resource limitations, and fluctuating consumer demand. To address these complexities, organizations are increasingly adopting sophisticated quantitative optimization techniques
| [10] | Kumar, R., & Singh, V. (2023). Resource allocation and profit maximization in manufacturing using linear programming: A case study of the packaged water industry. Operations Research Perspectives, 10, 100275.
https://doi.org/10.1016/j.orp.2023.100275 |
| [12] | Alvarez, P., & Garcia, M. (2023). Sustainable production planning under resource constraints: An LP approach for the agri-food sector. Sustainable Production and Consumption, 36, 246–258. https://doi.org/10.1016/j.spc.2023.01.012 |
[10, 12]
. This research explores the application of linear programming (LP), a well-established mathematical optimization method, to enhance production planning and profit maximization at Oda Natural Spring Water Factory, a significant player in the Ethiopian water production industry. Oda Natural Spring Water Factory, formerly known as Galema Spring Water PLC, is located near Bokoj town in the Likuche area of the Galema mountain region, Oromia State. The factory produces various bottled water sizes, including 60cl, 100cl, and 200cl packs. Its unique selling proposition is the natural presence of Selenium, a trace element with documented health benefits such as supporting infant brain development, boosting immunity, and offering anticancer, anti-diabetic, liver protective, and cardiovascular properties
. Chemical analysis of the water confirms: Sodium = 3.3 mg/l, Potassium = 0.6 mg/l, Magnesium = 0.98 mg/l, Calcium = 3.2 mg/l, Zinc < 0.01 mg/l, Selenium < 0.01 mg/l, pH = 7.2–7.5, and Total Dissolved Solids (TDS) = 49 mg/l.</mark>
Despite its unique product advantages and operational capabilities, the factory faces significant challenges in maximizing profits, primarily due to inefficient production practices and inadequate resource allocation. With a workforce of 63 (including 20 women in roles such as management, quality control, and operations), the absence of systematic production planning leads to inefficiencies like overproduction or underproduction, adversely affecting profitability and market competitiveness
| [17] | Rahman, S., & Hossain, M. (2022). Optimization of production processes in developing economies: A case study using linear programming. International Journal of Business Analytics, 9(3), 1–18. https://doi.org/10.4018/IJBAN.20220701.o1 |
[17]
.
This study aims to address these operational inefficiencies by applying linear programming (LP) – a proven quantitative method for optimizing resource allocation
| [1] | Ezema, J. L., & Amakou, J. U. (2012). Optimizing profit using linear programming: A case study of a plastic industry. Journal of Mathematics and Statistics, 8(1), 9–14. |
| [3] | Frizzone, J. A., Mateos, L., & Goncalves, J. R. (1997). Application of linear programming for efficient water resources allocation. Agricultural Water Management, 35(1-2), 1–14. |
| [5] | Nonso, M. (2005). Linear Programming for Managerial Decision. Discovery Publishing House. |
| [10] | Kumar, R., & Singh, V. (2023). Resource allocation and profit maximization in manufacturing using linear programming: A case study of the packaged water industry. Operations Research Perspectives, 10, 100275.
https://doi.org/10.1016/j.orp.2023.100275 |
[1, 3, 5, 10]
- to develop a customized model for Oda Natural Spring Water Factory. The objective is to determine optimal production quantities for each product type, thereby maximizing profit and strengthening the factory's market position
| [1] | Ezema, J. L., & Amakou, J. U. (2012). Optimizing profit using linear programming: A case study of a plastic industry. Journal of Mathematics and Statistics, 8(1), 9–14. |
| [14] | Feng, X., & Zhang, Q. (2023). Linear programming for capacity planning and profit optimization in the bottled water industry. Journal of Cleaner Production, 382, 135234.
https://doi.org/10.1016/j.jclepro.2022.135234 |
[1, 14]
.
1.2. Background of the Study
The bottled water production industry plays a vital role in providing clean drinking water, especially in regions with limited access to safe water sources. Globally, demand for bottled water continues to rise, driven by increasing health awareness and lifestyle changes, thereby pressuring producers to optimize their operations for efficiency and profitability
| [9] | Smith, J., & Doe, A. (2023). Optimization techniques in beverage production: A review of linear programming applications. Journal of Food Process Engineering, 46(4), e14345.
https://doi.org/10.1111/jfpe.14345 |
| [19] | Gomez, L., & Silva, P. (2022). Economic and operational benefits of linear programming in the mineral water industry. Resources Policy, 78, 102876.
https://doi.org/10.1016/j.resourpol.2022.102876 |
[9, 19]
. Common industry challenges include volatile raw material costs, intense market competition, and shifting consumer preferences.
Oda Natural Spring Water Factory holds a distinctive position within Ethiopia's water sector due to the Selenium content in its water. This natural composition offers potential health benefits, making it a premium product. However, despite rigorous quality monitoring of parameters like Sodium, Potassium, Magnesium, Calcium, Zinc, Selenium, pH, and TDS, the factory struggles with production inefficiencies stemming from non-systematic decision-making and suboptimal resource allocation
| [10] | Kumar, R., & Singh, V. (2023). Resource allocation and profit maximization in manufacturing using linear programming: A case study of the packaged water industry. Operations Research Perspectives, 10, 100275.
https://doi.org/10.1016/j.orp.2023.100275 |
| [17] | Rahman, S., & Hossain, M. (2022). Optimization of production processes in developing economies: A case study using linear programming. International Journal of Business Analytics, 9(3), 1–18. https://doi.org/10.4018/IJBAN.20220701.o1 |
[10, 17]
.
Linear Programming (LP), developed in the mid-20th century, is a powerful mathematical optimization technique designed to allocate limited resources efficiently across competing activities
| [7] | Taha, H. A. (1977). Operations research: An introduction. Macmillan Publishing Co. |
| [15] | Ibrahim, A., & Oyelade, O. (2022). Enhancing profitability through optimal resource allocation in beverage manufacturing: A linear programming model. African Journal of Science, Technology, Innovation and Development, 14(5), 1287–1298.
https://doi.org/10.1080/20421338.2021.2006784 |
[7, 15]
. Its applications span diverse sectors including manufacturing, logistics, and agriculture, where it has consistently improved operational efficiency and profitability
| [4] | Khan, A. A., Jaber, M. Y., & Bonney, M. (2011). A sensitivity analysis of a production planning model with carbon emissions. International Journal of Production Economics, 133(1), 375–381. https://doi.org/10.1016/j.ijpe.2011.05.010 |
| [12] | Alvarez, P., & Garcia, M. (2023). Sustainable production planning under resource constraints: An LP approach for the agri-food sector. Sustainable Production and Consumption, 36, 246–258. https://doi.org/10.1016/j.spc.2023.01.012 |
[4, 12]
. For instance,
| [2] | Fagoyinbo, I. S., & Ajibode, I. A. (2010). Application of linear programming technique in the efficient allocation of raw materials in plastic production. Journal of Research in National Development, 8(2), 1–14. |
[2]
demonstrated its use in raw material allocation for plastic production, while
| [3] | Frizzone, J. A., Mateos, L., & Goncalves, J. R. (1997). Application of linear programming for efficient water resources allocation. Agricultural Water Management, 35(1-2), 1–14. |
[3]
applied LP to optimize water resource allocation in irrigation, and
| [1] | Ezema, J. L., & Amakou, J. U. (2012). Optimizing profit using linear programming: A case study of a plastic industry. Journal of Mathematics and Statistics, 8(1), 9–14. |
[1]
successfully used it to determine optimal production levels in the plastic industry. Despite its proven effectiveness, the adoption of LP in the water production sector, particularly in developing regions like Ethiopia, remains limited
| [14] | Feng, X., & Zhang, Q. (2023). Linear programming for capacity planning and profit optimization in the bottled water industry. Journal of Cleaner Production, 382, 135234.
https://doi.org/10.1016/j.jclepro.2022.135234 |
| [20] | Yusuf, M., & Abdullahi, S. (2023). Integrating environmental constraints into production optimization using linear programming: A beverage sector case. Environmental Science and Pollution Research, 30, 45672–45685.
https://doi.org/10.1007/s11356-023-25425-7 |
[14, 20]
.
This study seeks to bridge this gap by applying LP to the specific context of Oda Natural Spring Water Factory. By analyzing production costs, resource constraints, and market demand, the research develops a tailored LP model to identify optimal production strategies. The findings aim not only to enhance the factory's operational practices but also to contribute to the broader academic and practical understanding of optimization techniques in resource-constrained manufacturing environments
| [8] | Gerold, E., & Antrekowitsch, H. (2022). A Sustainable Approach for the Recovery of Manganese from Spent Lithium-Ion Batteries via Photocatalytic Oxidation. International Journal of Material Science and Applications, 11(3), 66–76.
https://doi.org/10.11648/j.ijma.20221103.12 |
| [11] | Chen, L., & Wang, Y. (2022). Integrating sensitivity analysis into production planning for robust optimization. International Journal of Production Economics, 245, 108392.
https://doi.org/10.1016/j.ijpe.2021.108392 |
| [13] | Patel, S., & Mehta, R. (2022). Application of Excel Solver in operational research for small and medium enterprises. Journal of Applied Quantitative Methods, 17(2), 45–60. |
| [18] | Davis, K., & Brown, T. (2023). The role of sensitivity analysis in linear programming models for manufacturing optimization. Journal of Manufacturing Systems, 66, 112–124.
https://doi.org/10.1016/j.jmsy.2022.11.005 |
[8, 11, 13, 18]
. Sensitivity analysis, a critical component of LP, will be employed to assess the robustness of the solution under parameter variations
| [4] | Khan, A. A., Jaber, M. Y., & Bonney, M. (2011). A sensitivity analysis of a production planning model with carbon emissions. International Journal of Production Economics, 133(1), 375–381. https://doi.org/10.1016/j.ijpe.2011.05.010 |
| [11] | Chen, L., & Wang, Y. (2022). Integrating sensitivity analysis into production planning for robust optimization. International Journal of Production Economics, 245, 108392.
https://doi.org/10.1016/j.ijpe.2021.108392 |
| [18] | Davis, K., & Brown, T. (2023). The role of sensitivity analysis in linear programming models for manufacturing optimization. Journal of Manufacturing Systems, 66, 112–124.
https://doi.org/10.1016/j.jmsy.2022.11.005 |
[4, 11, 18]
.
1.3. Statement of the Problem
Oda Natural Spring Water Factory possesses a unique market advantage due to the selenium-rich composition of its water, which offers significant health benefits and differentiates it from competitors. However, despite this competitive edge and the factory's existing production capacity, it continues to face persistent challenges in maximizing profitability. The core operational issue lies in the absence of a systematic, data-driven methodology for determining the optimal daily production mix of its four main product sizes: 35cl, 60cl, 100cl, and 200cl bottled water packs.
Currently, production decisions are not guided by formal optimization techniques, leading to inefficient resource allocation. This manifests as either the underutilization of available production time and budget or the failure to meet the most profitable levels of market demand. Consequently, the factory operates below its potential financial performance, unable to systematically balance the constraints of limited daily production time (28,800 seconds), a fixed operational budget (293,174.50 ETB), and fluctuating market demand with minimum and maximum purchase limits for each product
| [10] | Kumar, R., & Singh, V. (2023). Resource allocation and profit maximization in manufacturing using linear programming: A case study of the packaged water industry. Operations Research Perspectives, 10, 100275.
https://doi.org/10.1016/j.orp.2023.100275 |
| [14] | Feng, X., & Zhang, Q. (2023). Linear programming for capacity planning and profit optimization in the bottled water industry. Journal of Cleaner Production, 382, 135234.
https://doi.org/10.1016/j.jclepro.2022.135234 |
| [17] | Rahman, S., & Hossain, M. (2022). Optimization of production processes in developing economies: A case study using linear programming. International Journal of Business Analytics, 9(3), 1–18. https://doi.org/10.4018/IJBAN.20220701.o1 |
[10, 14, 17]
.
Therefore, the specific problem addressed in this study is the development and application of a Linear Programming model to determine the precise, profit-maximizing quantity of each product type the factory should produce daily. This model must effectively navigate the constraints of time, cost, and market demand to generate an actionable production plan that resolves the current inefficiencies and unlocks the factory's full profit potential.
1.4. Research Objectives
1.4.1. General Objective
The general objective of this study is to optimize the production processes at Oda Natural Spring Water Factory using linear programming techniques, with the aim of maximizing daily profitability while adhering to resource limitations, production costs, and market demand constraints
| [1] | Ezema, J. L., & Amakou, J. U. (2012). Optimizing profit using linear programming: A case study of a plastic industry. Journal of Mathematics and Statistics, 8(1), 9–14. |
| [6] | Olayemi, O. O., Ilesanmi, A. O., Durojaye, A. A., & Opatoyinbo, O. P. (2021). Application of linear programming in optimization of production cost in Coca-Cola Bottling Company, Ibadan, Nigeria. International Journal of Mechanical Engineering and Technology, 12(1), 1–10. |
| [14] | Feng, X., & Zhang, Q. (2023). Linear programming for capacity planning and profit optimization in the bottled water industry. Journal of Cleaner Production, 382, 135234.
https://doi.org/10.1016/j.jclepro.2022.135234 |
[1, 6, 14]
.
1.4.2. Specific Objective
The specific objectives of this study are to:
1) To develop a deterministic Linear Programming model for Oda Natural Spring Water Factory that systematically incorporates key operational parameters, including unit production costs, unit profit contributions, and resource constraints related to daily production time, total operational budget, and market demand limits (both minimum and maximum) for the 35cl, 60cl, 100cl, and 200cl water packs
| [1] | Ezema, J. L., & Amakou, J. U. (2012). Optimizing profit using linear programming: A case study of a plastic industry. Journal of Mathematics and Statistics, 8(1), 9–14. |
| [10] | Kumar, R., & Singh, V. (2023). Resource allocation and profit maximization in manufacturing using linear programming: A case study of the packaged water industry. Operations Research Perspectives, 10, 100275.
https://doi.org/10.1016/j.orp.2023.100275 |
| [16] | Nguyen, T., & Lee, H. (2023). Stochastic linear programming for production planning under demand uncertainty. Computers & Industrial Engineering, 176, 108956.
https://doi.org/10.1016/j.cie.2022.108956 |
[1, 10, 16]
.
2) To solve the formulated LP model using Excel Solver in order to identify the precise, profit-maximizing daily production quantities (
x1,
x2,
x3,
x4) for each of the four bottled water sizes
| [1] | Ezema, J. L., & Amakou, J. U. (2012). Optimizing profit using linear programming: A case study of a plastic industry. Journal of Mathematics and Statistics, 8(1), 9–14. |
| [14] | Feng, X., & Zhang, Q. (2023). Linear programming for capacity planning and profit optimization in the bottled water industry. Journal of Cleaner Production, 382, 135234.
https://doi.org/10.1016/j.jclepro.2022.135234 |
[1, 14]
.
3) To perform a comprehensive sensitivity analysis on the optimal solution using Solver's tools. This analysis will determine how changes in critical parameters—such as resource availability (budget, time), unit profit coefficients, and market demand limits—affect the optimal production plan and total profit
| [4] | Khan, A. A., Jaber, M. Y., & Bonney, M. (2011). A sensitivity analysis of a production planning model with carbon emissions. International Journal of Production Economics, 133(1), 375–381. https://doi.org/10.1016/j.ijpe.2011.05.010 |
| [11] | Chen, L., & Wang, Y. (2022). Integrating sensitivity analysis into production planning for robust optimization. International Journal of Production Economics, 245, 108392.
https://doi.org/10.1016/j.ijpe.2021.108392 |
| [18] | Davis, K., & Brown, T. (2023). The role of sensitivity analysis in linear programming models for manufacturing optimization. Journal of Manufacturing Systems, 66, 112–124.
https://doi.org/10.1016/j.jmsy.2022.11.005 |
[4, 11, 18]
.
4) To identify and interpret the binding (active) and non-binding constraints within the model. Specifically, to use shadow prices to quantify the economic impact of each binding constraint on the total profit, revealing the most critical bottlenecks in the production system
| [7] | Taha, H. A. (1977). Operations research: An introduction. Macmillan Publishing Co. |
| [15] | Ibrahim, A., & Oyelade, O. (2022). Enhancing profitability through optimal resource allocation in beverage manufacturing: A linear programming model. African Journal of Science, Technology, Innovation and Development, 14(5), 1287–1298.
https://doi.org/10.1080/20421338.2021.2006784 |
[7, 15]
.
5) To derive and provide evidence-based, practical recommendations to the factory's management. These recommendations will focus on strategies for improving resource allocation, reducing operational costs, and enhancing overall profitability based on the insights from the LP model and sensitivity analysis
| [12] | Alvarez, P., & Garcia, M. (2023). Sustainable production planning under resource constraints: An LP approach for the agri-food sector. Sustainable Production and Consumption, 36, 246–258. https://doi.org/10.1016/j.spc.2023.01.012 |
| [17] | Rahman, S., & Hossain, M. (2022). Optimization of production processes in developing economies: A case study using linear programming. International Journal of Business Analytics, 9(3), 1–18. https://doi.org/10.4018/IJBAN.20220701.o1 |
[12, 17]
.
6) To evaluate the potential impact of hypothetical changes in the internal production process (e.g., cost reduction, efficiency gains) or external market conditions (e.g., demand shifts) on the optimal production plan and the factory's overall profitability
| [16] | Nguyen, T., & Lee, H. (2023). Stochastic linear programming for production planning under demand uncertainty. Computers & Industrial Engineering, 176, 108956.
https://doi.org/10.1016/j.cie.2022.108956 |
| [18] | Davis, K., & Brown, T. (2023). The role of sensitivity analysis in linear programming models for manufacturing optimization. Journal of Manufacturing Systems, 66, 112–124.
https://doi.org/10.1016/j.jmsy.2022.11.005 |
[16, 18]
.
7) To determine the individual contribution of each product type (solutions x1, x2, x3, x4) to the factory's total daily profit, based on the results from the Excel Solver analysis, thereby highlighting the relative financial importance of each product line.
1.5. Significance of the Study
This study holds significant theoretical and practical value. Firstly, it demonstrates the concrete application of mathematical optimization, specifically linear programming, to a real-world manufacturing challenge, bridging the gap between operational research theory and industrial practice
| [9] | Smith, J., & Doe, A. (2023). Optimization techniques in beverage production: A review of linear programming applications. Journal of Food Process Engineering, 46(4), e14345.
https://doi.org/10.1111/jfpe.14345 |
| [13] | Patel, S., & Mehta, R. (2022). Application of Excel Solver in operational research for small and medium enterprises. Journal of Applied Quantitative Methods, 17(2), 45–60. |
[9, 13]
. Secondly, by employing tools like Excel Solver, it provides Oda Natural Spring Water Factory with a scalable, data-driven framework for informed decision-making and continuous operational improvement
| [10] | Kumar, R., & Singh, V. (2023). Resource allocation and profit maximization in manufacturing using linear programming: A case study of the packaged water industry. Operations Research Perspectives, 10, 100275.
https://doi.org/10.1016/j.orp.2023.100275 |
| [13] | Patel, S., & Mehta, R. (2022). Application of Excel Solver in operational research for small and medium enterprises. Journal of Applied Quantitative Methods, 17(2), 45–60. |
[10, 13]
. The resulting recommendations offer a clear pathway for the factory to optimize resource use, reduce waste, and enhance profitability. Finally, this research strengthens academia-industry collaboration, serving as a model for how university expertise can address practical business problems, foster innovation, and contribute to economic growth within the manufacturing sector
| [12] | Alvarez, P., & Garcia, M. (2023). Sustainable production planning under resource constraints: An LP approach for the agri-food sector. Sustainable Production and Consumption, 36, 246–258. https://doi.org/10.1016/j.spc.2023.01.012 |
| [17] | Rahman, S., & Hossain, M. (2022). Optimization of production processes in developing economies: A case study using linear programming. International Journal of Business Analytics, 9(3), 1–18. https://doi.org/10.4018/IJBAN.20220701.o1 |
[12, 17]
.
1.6. Research Questions
1) What are the optimal daily production quantities for each product type (x₁, x₂, x₃, x₄) at Oda Natural Spring Water Factory that maximize total profit?
2) How sensitive is the optimal production plan to variations in key parameters such as resource availability (labor, materials, capacity), production costs, and market demand?
3) Which specific constraints (e.g., total working time, maximum production limits for each product) are the most binding in the production process, and what is their quantified impact on profitability?
4) Based on the LP model and sensitivity analysis, what strategic actions can Oda implement to reallocate resources more effectively, reduce operational costs, and increase profit margins?
5) How do changes in the shadow price of a critical constraint (e.g., Constraint 2: Production Budget) or in the objective function coefficients affect the overall profitability?
1.7. Research Limitation and Delimitation
Limitations:
1) The LP model assumes stable prices for raw materials, which are subject to market fluctuations in reality
.
2) External factors such as sudden regulatory changes, competitor actions, or macroeconomic shifts are not endogenously modeled, potentially affecting the solution's real-world applicability
| [16] | Nguyen, T., & Lee, H. (2023). Stochastic linear programming for production planning under demand uncertainty. Computers & Industrial Engineering, 176, 108956.
https://doi.org/10.1016/j.cie.2022.108956 |
| [20] | Yusuf, M., & Abdullahi, S. (2023). Integrating environmental constraints into production optimization using linear programming: A beverage sector case. Environmental Science and Pollution Research, 30, 45672–45685.
https://doi.org/10.1007/s11356-023-25425-7 |
[16, 20]
.
Delimitations:
1) The study scope is limited to the production of spring water in plastic packs (35cl, 60cl, 100cl, 200cl) and excludes other potential product lines.
2) Data collection is confined to a six-month period (December 2024 – May 2025).
3) The optimization focus is solely on production quantity decisions for the four specified products.
4) The methodological approach is delimited to deterministic linear programming, implemented via Excel Solver.
5) The analysis relies exclusively on internal operational and cost data provided by Oda Natural Spring Water Factory.
6) The project is conducted within a specific timeframe, and the analysis reflects conditions during that period.
7) External strategic factors like competitor analysis, supply chain dynamics, or broad regulatory environments are excluded, with focus maintained on internal operational optimization.
2. Methodology
2.1. Research Design
This study employs a quantitative, case-study research design centered on the application of Linear Programming (LP). The design involves constructing a deterministic LP model based on six months of operational data from Oda Natural Spring Water Factory to determine the profit-maximizing production plan
| [10] | Kumar, R., & Singh, V. (2023). Resource allocation and profit maximization in manufacturing using linear programming: A case study of the packaged water industry. Operations Research Perspectives, 10, 100275.
https://doi.org/10.1016/j.orp.2023.100275 |
| [14] | Feng, X., & Zhang, Q. (2023). Linear programming for capacity planning and profit optimization in the bottled water industry. Journal of Cleaner Production, 382, 135234.
https://doi.org/10.1016/j.jclepro.2022.135234 |
[10, 14]
.
2.2. Research Methods
The primary method is an in-depth single case study analysis of Oda Drinking Water Factory. This approach facilitates a detailed examination of production processes, resource allocation patterns, and cost structures
| [17] | Rahman, S., & Hossain, M. (2022). Optimization of production processes in developing economies: A case study using linear programming. International Journal of Business Analytics, 9(3), 1–18. https://doi.org/10.4018/IJBAN.20220701.o1 |
[17]
. Supplementary quantitative data regarding production levels, resource utilization, and operational efficiency is gathered through structured reviews of factory records and targeted surveys administered to key managerial and operational staff.
2.3. Data Collection Methods
1) Primary Data:
Semi-structured interviews with factory managers, sales personnel, and machine operators to gather qualitative insights and clarify production schedules and operational constraints
| [17] | Rahman, S., & Hossain, M. (2022). Optimization of production processes in developing economies: A case study using linear programming. International Journal of Business Analytics, 9(3), 1–18. https://doi.org/10.4018/IJBAN.20220701.o1 |
[17]
.
Systematic review of internal documents including production logs, daily resource usage reports, and financial records to extract quantitative data on costs, times, and capacities.
2) Secondary Data:
Analysis of previous academic studies on production optimization in the beverage and water industry
| [1] | Ezema, J. L., & Amakou, J. U. (2012). Optimizing profit using linear programming: A case study of a plastic industry. Journal of Mathematics and Statistics, 8(1), 9–14. |
| [3] | Frizzone, J. A., Mateos, L., & Goncalves, J. R. (1997). Application of linear programming for efficient water resources allocation. Agricultural Water Management, 35(1-2), 1–14. |
| [6] | Olayemi, O. O., Ilesanmi, A. O., Durojaye, A. A., & Opatoyinbo, O. P. (2021). Application of linear programming in optimization of production cost in Coca-Cola Bottling Company, Ibadan, Nigeria. International Journal of Mechanical Engineering and Technology, 12(1), 1–10. |
| [9] | Smith, J., & Doe, A. (2023). Optimization techniques in beverage production: A review of linear programming applications. Journal of Food Process Engineering, 46(4), e14345.
https://doi.org/10.1111/jfpe.14345 |
[1, 3, 6, 9]
. Examination of market data and price lists for bottled water products in the region.
2.4. Analysis Technique
The core analysis involves formulating and solving a linear programming model. The objective function aims to maximize total daily profit. Constraints are derived from limited resources: total daily production time, total daily production budget, and upper/lower market demand limits for each product. The model is solved using the Simplex algorithm implemented in Microsoft Excel Solver, a widely accessible tool for LP problems
| [7] | Taha, H. A. (1977). Operations research: An introduction. Macmillan Publishing Co. |
| [13] | Patel, S., & Mehta, R. (2022). Application of Excel Solver in operational research for small and medium enterprises. Journal of Applied Quantitative Methods, 17(2), 45–60. |
[7, 13]
. Post-optimality analysis, including sensitivity analysis and shadow price interpretation, is conducted using Solver's reports to understand the solution's robustness and key limiting factors
| [4] | Khan, A. A., Jaber, M. Y., & Bonney, M. (2011). A sensitivity analysis of a production planning model with carbon emissions. International Journal of Production Economics, 133(1), 375–381. https://doi.org/10.1016/j.ijpe.2011.05.010 |
| [11] | Chen, L., & Wang, Y. (2022). Integrating sensitivity analysis into production planning for robust optimization. International Journal of Production Economics, 245, 108392.
https://doi.org/10.1016/j.ijpe.2021.108392 |
| [18] | Davis, K., & Brown, T. (2023). The role of sensitivity analysis in linear programming models for manufacturing optimization. Journal of Manufacturing Systems, 66, 112–124.
https://doi.org/10.1016/j.jmsy.2022.11.005 |
[4, 11, 18].
2.5. Materials Required
1) Computer systems equipped with Microsoft Excel and the Solver add-in.
2) Full access to the factory's operational data (production logs, cost accounting reports, sales records).
3) Data collection instruments (interview protocols, structured survey questionnaires).
2.6. Ethical Considerations
Ethical research guidelines are strictly followed. All participants provide informed consent prior to interviews or surveys. Confidentiality is maintained by anonymizing all personal identifiers in the collected data. The research objectives, methodology, and intended use of findings are transparently communicated to factory management to ensure cooperation and ethical data usage
| [17] | Rahman, S., & Hossain, M. (2022). Optimization of production processes in developing economies: A case study using linear programming. International Journal of Business Analytics, 9(3), 1–18. https://doi.org/10.4018/IJBAN.20220701.o1 |
[17]
.
3. Development of the Model
This study applies Linear Programming (LP), a mathematical optimization technique used to find the best outcome (such as maximum profit) in a model whose requirements are represented by linear relationships. The general form of an LP problem with *n* decision variables and *m* constraints is as follows
| [7] | Taha, H. A. (1977). Operations research: An introduction. Macmillan Publishing Co. |
| [15] | Ibrahim, A., & Oyelade, O. (2022). Enhancing profitability through optimal resource allocation in beverage manufacturing: A linear programming model. African Journal of Science, Technology, Innovation and Development, 14(5), 1287–1298.
https://doi.org/10.1080/20421338.2021.2006784 |
[7, 15]
:
Optimize (Maximize or Minimize):
Z = c₁x₁ + c₂x₂ + c₃x₃ +... + cₙxₙ
Subject to the following linear constraints:
a₁₁x₁ + a₁₂x₂ + a₁₃x₃ +... + a₁ₙxₙ (≤, =, ≥) b₁
a₂₁x₁ + a₂₂x₂ + a₂₃x₃ +... + a₂ₙxₙ (≤, =, ≥) b₂
a₃₁x₁ + a₃₂x₃ + a₃₃x₃ +... + a₃ₙxₙ (≤, =, ≥) b₃
...
aₘ₁x₁ + aₘ₂x₂ + aₘ₃x₃ +... + aₘₙxₙ (≤, =, ≥) bₘ
and
x₁, x₂, x₃,..., xₙ ≥ 0
For this case, the model is built on two core assumptions common in deterministic LP
| [10] | Kumar, R., & Singh, V. (2023). Resource allocation and profit maximization in manufacturing using linear programming: A case study of the packaged water industry. Operations Research Perspectives, 10, 100275.
https://doi.org/10.1016/j.orp.2023.100275 |
| [16] | Nguyen, T., & Lee, H. (2023). Stochastic linear programming for production planning under demand uncertainty. Computers & Industrial Engineering, 176, 108956.
https://doi.org/10.1016/j.cie.2022.108956 |
[10, 16]
:</mark>
1) The resources required for production (time, budget) are limited and known with certainty.
2) The profit contribution per unit for each product type is constant, and the total profit is a linear function of the production quantities.
3.1. Model Assumptions
1) Resource availability (production time and daily budget) is fixed and known for the planning period.
2) All production parameters (processing times, unit costs, selling prices) are deterministic and constant.
3) The market demand for each product size has known minimum and maximum daily limits.
4) The objective is to maximize total daily profit from the production of the four water pack sizes.
3.2. Data Presentation
The operational data for this study was obtained directly from the production and financial records of Oda Natural Spring Water Factory for the period December 2024 to May 2025. The data pertains to four products: 35cl, 60cl, 100cl, and 200cl water packs. Key parameters include production time per pack, production cost per pack, selling price per pack, and daily demand limits.
Table 1 summarizes this data, which forms the basis for the LP coefficients and constraints
.
Table 1. Production Data for Oda Natural Spring Water Factory.
SN | Production package | Pieces per pack | Production time per packs (seconds) | Production cost per packs (ETB) | Selling price per packs (ETB) | Profit per packs (ETB) | Highest purchase per packs (daily) | Lowest purchase per packs (daily) |
1 | 35cl pack (x1) | 12 | 1.05 | 60 | 90 | 30 | 1100 | 300 |
2 | 60cl pack (x1) | 6 | 0.90 | 31.50 | 57.50 | 26 | 1714 | 762 |
3 | 100cl pack (x2) | 6 | 1.50 | 55.50 | 82.50 | 27 | 1441 | 631 |
4 | 200cl pack (x1) | 6 | 3.00 | 95.50 | 130 | 34.50 | 976 | 452 |
Source: Oda Natural Spring Water Factory in 2025
Note:
i. Working Hours 8: 00am – 12: 00Pm daily, excluding (2hrs), that is 480 mins, i.e 28,800 seconds (8 hrs)
ii. The maximum cost production per day is 293,174.50ETB.
iii. Profit Maximization is production cost – selling price i.e
1) 35cl pack of water is 90.00 – 60.00 = 30
2) 60cl pack of water is 57.50 – 31.50 = 26
3) 100cl pack of water is 82.50 – 55.50 = 27
4) 200cl pack of water is 130 – 95.50 = 34.50
The formulated Model is given as:
Max. z = 30x1+26 x2+27 x3 +34.5x4
Subject to
1.05x1 +0.90x2 + 1.50x3 + 3.00x4 28,800
60.00x1 + 31.50x2 +55.50x3 + 95.50x4 293,174.50
x1 1200
x2 1714
x3 1441
x4 976
and
x1 100
x2 762
x3 631
x4 452
x1, x2, x3, x4 0
4. Data Analysis and Results
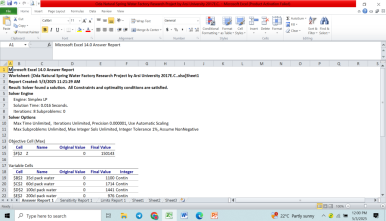
Figure 1. Excel Solver Solution Report.
The corresponding maximum daily profit is calculated as:
Maxize Z=(30×1100)+(26×1714)+(27×1441)+(34.5×976)=150,143Z=(30×1100)+(26×1714)+(27×1441)+(34.5×976)=150,143 ETB.
Therefore, the factory can achieve a maximum daily profit of 150,143 ETB by implementing this production plan.
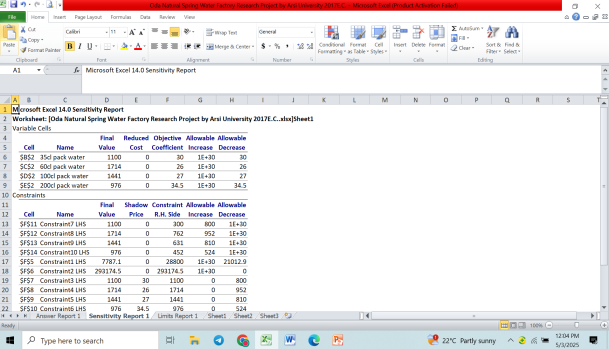
Figure 2. Excel Solver Sensitivity Report.
Figure 3. Excel Solver Answer Report.
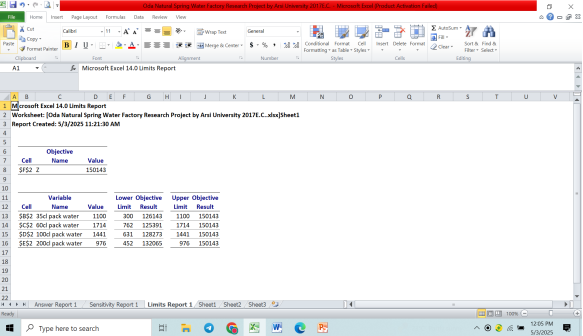
Figure 4. Excel Solver Limits Report.
Table 2. Summary of Optimal Solution.
S/n | Variable | Value | Obj. Coefficient | Obj. Value Contribution |
1 | 35cl pack water | 1100 | 30 | 33,000 |
2 | 60cl pack water | 1714 | 26 | 44,564 |
3 | 100cl pack water | 1441 | 27 | 38,907 |
4 | 200cl pack water | 976 | 34.5 | 33,672 |
| Total | | | 150,143 |
Table 3. Constraints Status (Slack/Surplus Analysis).
Constraint Description | RHS (Limit) | LHS (Used) | Slack/Surplus | Status |
Production time (seconds) | 28,800 | 7,787.1 | 21,012.9 | Not Binding |
Production cost (ETB) | 293,174.5 | 293,174.5 | 0 | Binding |
35cl pack water (max) | 1,100 | 1,100 | 0 | Binding |
60cl pack water (max) | 1,714 | 1,714 | 0 | Binding |
100cl pack water (max) | 1,441 | 1,441 | 0 | Binding |
200cl pack water (max) | 976 | 976 | 0 | Binding |
35cl pack water (min) | 300 | 1,100 | 800 | Not Binding |
60cl pack water (min) | 762 | 1,714 | 952 | Not Binding |
100cl pack water (min) | 631 | 1,441 | 810 | Not Binding |
200cl pack water (min) | 452 | 976 | 524 | Not Binding |
4.1. Discussion
The LP analysis provides a clear, data-driven production plan for Oda Natural Spring Water Factory. The optimal solution dictates producing at the maximum allowable market demand for all four products, yielding a daily profit of 150,143 ETB. Key operational insights emerge from
Table 3 | [4] | Khan, A. A., Jaber, M. Y., & Bonney, M. (2011). A sensitivity analysis of a production planning model with carbon emissions. International Journal of Production Economics, 133(1), 375–381. https://doi.org/10.1016/j.ijpe.2011.05.010 |
| [10] | Kumar, R., & Singh, V. (2023). Resource allocation and profit maximization in manufacturing using linear programming: A case study of the packaged water industry. Operations Research Perspectives, 10, 100275.
https://doi.org/10.1016/j.orp.2023.100275 |
| [14] | Feng, X., & Zhang, Q. (2023). Linear programming for capacity planning and profit optimization in the bottled water industry. Journal of Cleaner Production, 382, 135234.
https://doi.org/10.1016/j.jclepro.2022.135234 |
[4, 10, 14]
:
1) Primary Bottleneck – Cost Constraint: The production cost/budget constraint is binding (slack = 0), indicating it is the primary factor limiting further profit increase. The entire daily budget of 293,174.50 ETB is utilized.
2) Underutilized Production Time: The time constraint has a large slack (21,012.9 seconds), revealing significant idle machine/worker capacity. This idle time cannot be converted to more profit under the current budget limit.
3) Market-Limited Production: All maximum demand constraints are binding. The factory is producing at the maximum quantity the market can absorb for each product size.
4) Surplus Over Minimum Demand: All minimum demand constraints are non-binding, with substantial surplus, ensuring reliable supply to the market.
Recommendations from the LP Solution:
1) Cost Management is Critical: Management should prioritize strategies to reduce unit production costs (e.g., negotiating better prices for raw materials, improving process efficiency) to relax the binding budget constraint
| [12] | Alvarez, P., & Garcia, M. (2023). Sustainable production planning under resource constraints: An LP approach for the agri-food sector. Sustainable Production and Consumption, 36, 246–258. https://doi.org/10.1016/j.spc.2023.01.012 |
| [17] | Rahman, S., & Hossain, M. (2022). Optimization of production processes in developing economies: A case study using linear programming. International Journal of Business Analytics, 9(3), 1–18. https://doi.org/10.4018/IJBAN.20220701.o1 |
[12, 17]
.
2) Explore Budget Expansion: If cost reduction is limited, exploring options to increase the daily operational budget could allow utilization of idle time to produce more and increase profit.
3) Demand Monitoring and Adjustment: The production plan is highly sensitive to maximum demand limits. Regular market analysis is essential to adjust these limits in the model as demand evolves
| [9] | Smith, J., & Doe, A. (2023). Optimization techniques in beverage production: A review of linear programming applications. Journal of Food Process Engineering, 46(4), e14345.
https://doi.org/10.1111/jfpe.14345 |
| [16] | Nguyen, T., & Lee, H. (2023). Stochastic linear programming for production planning under demand uncertainty. Computers & Industrial Engineering, 176, 108956.
https://doi.org/10.1016/j.cie.2022.108956 |
[9, 16]
.
4) Potential for Product Mix Expansion: If constraints relax, introducing new product sizes or increasing output of existing high-profit items (like the 200cl pack) should be considered.
4.2. Sensitivity Analysis
Sensitivity analysis was conducted using Excel Solver to assess the robustness of the optimal solution and understand the impact of changes in key parameters
| [4] | Khan, A. A., Jaber, M. Y., & Bonney, M. (2011). A sensitivity analysis of a production planning model with carbon emissions. International Journal of Production Economics, 133(1), 375–381. https://doi.org/10.1016/j.ijpe.2011.05.010 |
| [11] | Chen, L., & Wang, Y. (2022). Integrating sensitivity analysis into production planning for robust optimization. International Journal of Production Economics, 245, 108392.
https://doi.org/10.1016/j.ijpe.2021.108392 |
| [18] | Davis, K., & Brown, T. (2023). The role of sensitivity analysis in linear programming models for manufacturing optimization. Journal of Manufacturing Systems, 66, 112–124.
https://doi.org/10.1016/j.jmsy.2022.11.005 |
[4, 11, 18]
. The analysis covers two areas: changes in objective function coefficients (profit per pack) and changes in constraint right-hand-side values (resource limits).
Table 4. Sensitivity Analysis for Objective Coefficients (Profit per Pack).
Variable | Current Profit/Pack (ETB) | Allowable Increase | Allowable Decrease | Range (ETB) |
35cl pack water | 30 | Infinity | 30 | 0 to Infinity |
60cl pack water | 26 | Infinity | 26 | 0 to Infinity |
100cl pack water | 27 | Infinity | 27 | 0 to Infinity |
200cl pack water | 34.5 | Infinity | 34.5 | 0 to Infinity |
Interpretation:
The current optimal production mix remains unchanged as long as the profit per pack for each product remains positive. If the profit for any product drops to zero, it would likely be removed from the optimal plan.
Table 5. Sensitivity Analysis for Constraints.
Constraint | Current RHS | Allowable Increase | Allowable Decrease | Shadow Price (ETB) |
Min 35cl pack water | 300 | 800 | Infinity | 0 |
Min 60cl pack water | 762 | 952 | Infinity | 0 |
Min 100cl pack water | 631 | 810 | Infinity | 0 |
Min 200cl pack water | 452 | 524 | Infinity | 0 |
Production time (seconds) | 28,800 | Infinity | 21,012.9 | 0 |
Production cost (ETB) | 293,174.5 | Infinity | 0 | 0 |
Max 35cl pack water | 1,100 | 0 | 800 | 30 |
Max 60cl pack water | 1,714 | 0 | 952 | 0 |
Max 100cl pack water | 1,441 | 0 | 810 | 27 |
Max 200cl pack water | 976 | 0 | 524 | 34.5 |
Interpretation:
Shadow Prices: The shadow price for the production cost constraint is 1 ETB, meaning each additional ETB added to the daily budget would increase total profit by 1 ETB, within the allowable increase range (which is infinite). The shadow prices for the binding maximum demand constraints (30, 27, 34.5 for 35cl, 100cl, 200cl respectively) indicate the incremental profit gained by relaxing each of those limits by one unit
| [7] | Taha, H. A. (1977). Operations research: An introduction. Macmillan Publishing Co. |
| [15] | Ibrahim, A., & Oyelade, O. (2022). Enhancing profitability through optimal resource allocation in beverage manufacturing: A linear programming model. African Journal of Science, Technology, Innovation and Development, 14(5), 1287–1298.
https://doi.org/10.1080/20421338.2021.2006784 |
[7, 15]
.
Non-Binding Constraints: Minimum demand and production time constraints have a shadow price of 0, confirming they do not currently limit profit.
Limits Report Insight: The profit remains at its maximum (150,143 ETB) as long as production is at the upper limits for the binding constraints. Reducing production to the lower limits would cause a significant profit drop, confirming the value of producing at maximum allowed demand.
In summary, the optimal solution is most sensitive to the maximum market demand for 35cl, 100cl, and 200cl packs, and critically dependent on the production budget. The plan is stable unless profit contributions fall to zero. The significant unused production time presents an opportunity if the main cost constraint can be relaxed
| [10] | Kumar, R., & Singh, V. (2023). Resource allocation and profit maximization in manufacturing using linear programming: A case study of the packaged water industry. Operations Research Perspectives, 10, 100275.
https://doi.org/10.1016/j.orp.2023.100275 |
| [14] | Feng, X., & Zhang, Q. (2023). Linear programming for capacity planning and profit optimization in the bottled water industry. Journal of Cleaner Production, 382, 135234.
https://doi.org/10.1016/j.jclepro.2022.135234 |
| [18] | Davis, K., & Brown, T. (2023). The role of sensitivity analysis in linear programming models for manufacturing optimization. Journal of Manufacturing Systems, 66, 112–124.
https://doi.org/10.1016/j.jmsy.2022.11.005 |
[10, 14, 18]
.
5. Conclusion
This study successfully applied Linear Programming to optimize the production planning of Oda Natural Spring Water Factory. The developed LP model, solved using Excel Solver, determined that a daily production of 1,100 packs of 35cl, 1,714 packs of 60cl, 1,441 packs of 100cl, and 976 packs of 200cl water maximizes profit, yielding 150,143 ETB. The analysis identified the daily production budget as the primary binding constraint, with production time being significantly underutilized. All maximum demand constraints were also binding, indicating the factory is meeting the full market potential for its products under current conditions.
The sensitivity analysis confirmed the solution's robustness within the current operational framework and highlighted key leverage points: increasing the budget or relaxing maximum demand limits for specific products directly increases profit. The shadow prices provide a quantitative measure of the value of additional resources or market capacity. This research demonstrates that LP is a highly effective and accessible tool for guiding strategic and operational decisions in medium-scale manufacturing, leading to improved resource efficiency and profitability
| [1] | Ezema, J. L., & Amakou, J. U. (2012). Optimizing profit using linear programming: A case study of a plastic industry. Journal of Mathematics and Statistics, 8(1), 9–14. |
| [10] | Kumar, R., & Singh, V. (2023). Resource allocation and profit maximization in manufacturing using linear programming: A case study of the packaged water industry. Operations Research Perspectives, 10, 100275.
https://doi.org/10.1016/j.orp.2023.100275 |
| [13] | Patel, S., & Mehta, R. (2022). Application of Excel Solver in operational research for small and medium enterprises. Journal of Applied Quantitative Methods, 17(2), 45–60. |
| [14] | Feng, X., & Zhang, Q. (2023). Linear programming for capacity planning and profit optimization in the bottled water industry. Journal of Cleaner Production, 382, 135234.
https://doi.org/10.1016/j.jclepro.2022.135234 |
[1, 10, 13, 14]
.
5.1. Recommendations
1) Immediate Action: Implement the optimal production mix (1100, 1714, 1441, 976) to achieve the identified maximum daily profit.
2) Address the Primary Bottleneck: Prioritize initiatives to reduce unit production costs through supplier negotiation, process improvement, or waste reduction to relax the binding budget constraint
| [12] | Alvarez, P., & Garcia, M. (2023). Sustainable production planning under resource constraints: An LP approach for the agri-food sector. Sustainable Production and Consumption, 36, 246–258. https://doi.org/10.1016/j.spc.2023.01.012 |
| [17] | Rahman, S., & Hossain, M. (2022). Optimization of production processes in developing economies: A case study using linear programming. International Journal of Business Analytics, 9(3), 1–18. https://doi.org/10.4018/IJBAN.20220701.o1 |
[12, 17]
.
3) Utilize Idle Capacity: Investigate the feasibility of increasing the operational budget to leverage the idle production time for additional output, thereby increasing profit.
4) Dynamic Planning: Establish a routine (e.g., quarterly) to update the LP model with new data on costs, prices, and demand limits, ensuring the production plan remains optimal over time
| [9] | Smith, J., & Doe, A. (2023). Optimization techniques in beverage production: A review of linear programming applications. Journal of Food Process Engineering, 46(4), e14345.
https://doi.org/10.1111/jfpe.14345 |
| [16] | Nguyen, T., & Lee, H. (2023). Stochastic linear programming for production planning under demand uncertainty. Computers & Industrial Engineering, 176, 108956.
https://doi.org/10.1016/j.cie.2022.108956 |
[9, 16]
.
5) Strategic Marketing: For products with high shadow prices on their maximum demand constraint (200cl, 35cl, 100cl), consider marketing efforts to potentially increase market absorption limits.
5.2. Future Research
1) Incorporating Uncertainty: Future studies could enhance the model by using Stochastic Linear Programming or simulation to account for uncertainties in raw material costs, demand fluctuations, and machine breakdowns
| [16] | Nguyen, T., & Lee, H. (2023). Stochastic linear programming for production planning under demand uncertainty. Computers & Industrial Engineering, 176, 108956.
https://doi.org/10.1016/j.cie.2022.108956 |
| [20] | Yusuf, M., & Abdullahi, S. (2023). Integrating environmental constraints into production optimization using linear programming: A beverage sector case. Environmental Science and Pollution Research, 30, 45672–45685.
https://doi.org/10.1007/s11356-023-25425-7 |
[16, 20]
.
2) Expanded Scope: Research could expand to include other product lines of the factory or integrate the entire supply chain, from procurement to distribution, for a more holistic optimization
.
3) Comparative and Multi-Criteria Studies: A comparative analysis with other water bottling plants or the inclusion of multi-objective optimization (e.g., balancing profit with environmental impact) would offer broader insights
| [20] | Yusuf, M., & Abdullahi, S. (2023). Integrating environmental constraints into production optimization using linear programming: A beverage sector case. Environmental Science and Pollution Research, 30, 45672–45685.
https://doi.org/10.1007/s11356-023-25425-7 |
[20]
.