This study explores the transformative impact of gallium (Ga) doping on the structural and optical properties of tin oxide NPs synthesized using chemical and green method. The nanoparticles were synthesized at different doping concentrations of gallium (Ga-SnO2). The effects of different dopant concentration on structural and optical properties of Psidium guajava capped SnO2 nanoparticles were investigated using X-ray diffraction (XRD), Ultra Violet- Visible spectrophotometer (UV-Vis), Fourier transform infrared and photoluminescence spectroscopy (PL). The bandgap energies of Ga-SnO2NPs were estimated using Tauc’s plot. The bandgap energies were observed to decrease with introduction of gallium. Highest bandgap was obtained at 2.5% and 2.0% Ga-SnO2NPs having a bandgap value of 3.25 and 3.07 eV for capped and uncapped Ga-SnO2 respectively. Smallest bandgap was obtained at 0.5% Ga-SnO2 NPs having a bandgap value of 2.29 and 2.46 eV for capped and uncapped Ga-SnO2 respectively. Fourier transform infrared spectroscopy showed the stretching vibration of SnO2 between 690–790 cm-1 wavenumbers. Structural analysis using X-ray diffraction (XRD revealed Ga doping significantly leads to a decrease in crystallite size calculated using Scherrer equation. The results obtained showed that both capped and uncapped Ga-SnO2 maintained the tetragonal rutile structure. This showed that the dopant occupied the interstitial site of the precursor materials. Derby Scherrer formula was used to calculate the crystallite size, the results obtained showed that capping agents and doping reduces the crystallite size of nanoparticles. All nanoparticles formed were in the range of 10.99–18.00 nm. The PL spectrum showed emission at a near band emission and deep level emission.
| Published in | Journal of Photonic Materials and Technology (Volume 10, Issue 2) |
| DOI | 10.11648/j.jpmt.20251002.11 |
| Page(s) | 13-24 |
| Creative Commons |
This is an Open Access article, distributed under the terms of the Creative Commons Attribution 4.0 International License (http://creativecommons.org/licenses/by/4.0/), which permits unrestricted use, distribution and reproduction in any medium or format, provided the original work is properly cited. |
| Copyright |
Copyright © The Author(s), 2025. Published by Science Publishing Group |
Nanoparticles, Tin Oxide, Band Gap, Green Synthesis, Psidium Guajava Extract, Optical Properties
Materials | Plane | Dopant concentration (%) | ||||||
|---|---|---|---|---|---|---|---|---|
0% | 0.5% | 1.0% | 1.5% | 2.0% | 2.5% | |||
Uncapped NPs | 2𝜃 | 100 | 26.72 | 26.76 | 26.65 | 26.86 | 26.82 | 26.75 |
101 | 34.02 | 34.02 | 34.03 | 34.32 | 34.18 | 34.34 | ||
200 | 38.73 | 38.34 | 38.75 | 38.79 | 38.68 | 38.73 | ||
211 | 51.91 | 51.91 | 51.91 | 52.15 | 52.12 | 52.29 | ||
301 | 65.48 | 65.41 | 66.38 | 65.52 | 65.55 | 65.52 | ||
FWHM | 100 | 0.4985 | 0.4842 | 0.9820 | 0.9674 | 0.6848 | 0.9306 | |
101 | 0.5318 | 0.6708 | 0.5754 | 1.2718 | 0.6567 | 0.5872 | ||
200 | 0.3521 | 0.5199 | 0.5282 | 0.4585 | 0.7122 | 0.4699 | ||
211 | 0.6089 | 0.7575 | 0.7184 | 0.6447 | 0.7460 | 0.6572 | ||
301 | 0.5257 | 0.7767 | 0.9741 | 0.9415 | 1.2353 | 0.6144 | ||
D (av) | 18.00 | 13.10 | 13.09 | 12.17 | 10.99 | 15.23 | ||
𝛿 | 0.0031 | 0.0052 | 0.0052 | 0.0068 | 0.0083 | 0.0043 | ||
Capped NPs | 2θ | 100 | 26.72 | 26.73 | 26.90 | 26.78 | 26.86 | 26.70 |
101 | 34.04 | 34.02 | 34.06 | 34.09 | 34.13 | 33.98 | ||
200 | 38.16 | 38.73 | 38.72 | 38.57 | 38.67 | 38.71 | ||
211 | 51.91 | 51.85 | 51.95 | 52.03 | 52.04 | 51.85 | ||
301 | 65.48 | 65.44 | 65.42 | 65.44 | 65.45 | 65.43 | ||
FWHM | 100 | 0.5876 | 0.5985 | 0.9542 | 0.5563 | 0.9454 | 0.5800 | |
101 | 0.6046 | 0.5329 | 0.5864 | 0.5546 | 0.4308 | 0.5908 | ||
200 | 0.6162 | 0.4653 | 0.4470 | 1.0602 | 0.5217 | 0.4806 | ||
211 | 0.7299 | 0.6725 | 0.5777 | 0.6850 | 0.6094 | 0.6485 | ||
301 | 0.4727 | 0.5177 | 0.7260 | 0.9419 | 1.0307 | 0.6745 | ||
D (av) | 14.89 | 16.27 | 15.33 | 11.46 | 14.77 | 14.80 | ||
𝛿 | 0.0045 | 0.0038 | 0.0043 | 0.0076 | 0.0046 | 0.0046 | ||
Dopant concentration | Capped (eV) | Uncapped (eV) |
|---|---|---|
Pure SnO2 | 3.98 | 3.21 |
0.5% | 2.29 | 2.46 |
1.0% | 2.79 | 2.78 |
1.5% | 3.19 | 3.0 |
2.0% | 3.17 | 3.07 |
2.5% | 3.25 | 2.90 |
Dopant concentration | Capped Ga-SnO2 | Uncapped Ga-SnO2 | ||
|---|---|---|---|---|
Peak centre (nm) | Intensity (a. u) | Peak centre (nm) | Intensity (a. u) | |
0% (Pure SnO2) | 471.12 | 2.03 | 470.16 | 2.31 |
0.5% | 468.71 | 2.52 | 468.99 | 2.58 |
1.0% | 468.74 | 1.98 | 468.99 | 2.46 |
1.5% | 468.50 | 2.0 | 468.95 | 2.80 |
2.0% | 468.87 | 2.40 | 468.99 | 2.84 |
2.5% | 468.90 | 2.22 | 468.92 | 2.62 |
DLE | Deep Level Emission |
FWHM | Full Width Half Maximum |
Ga | Gallium |
NBE | Near Band Emission |
NPs | Deep Level Emission |
| [1] | A. A. Qureshi et al., “Facile formation of SnO2–TiO2 based photoanode and Fe3O4@ rGO based counter electrode for efficient dye-sensitized solar cells,” Mater. Sci. Semicond. Process., vol. 123, p. 105545, 2021. |
| [2] | M. Okil, M. S. Salem, T. M. Abdolkader, and A. Shaker, “From Crystalline to Low-cost Silicon-based Solar Cells: a Review,” Silicon, vol. 14, no. 5, pp. 1895–1911, Apr. 2022, |
| [3] | A. S. Al-Ezzi and M. N. M. Ansari, “Photovoltaic solar cells: a review,” Appl. Syst. Innov., vol. 5, no. 4, p. 67, 2022. |
| [4] | W. Zhu, S. Wang, X. Zhang, A. Wang, C. Wu, and F. Hao, “Ion Migration in Organic–Inorganic Hybrid Perovskite Solar Cells: Current Understanding and Perspectives,” Small, vol. 18, no. 15, p. 2105783, Apr. 2022, |
| [5] | D. Devadiga, M. Selvakumar, P. Shetty, and M. S. Santosh, “Recent progress in dye sensitized solar cell materials and photo-supercapacitors: A review,” J. Power Sources, vol. 493, p. 229698, 2021. |
| [6] | A. Pallikkara and K. Ramakrishnan, “Efficient charge collection of photoanodes and light absorption of photosensitizers: A review,” Int. J. Energy Res., vol. 45, no. 2, pp. 1425–1448, Feb. 2021, |
| [7] | A. Banerjee, “The design, fabrication, and photocatalytic utility of nanostructured semiconductors: focus on TiO2-based nanostructures,” Nanotechnol. Sci. Appl., p. 35, Feb. 2011, |
| [8] | C. M. Maghanga, J. Jensen, G. A. Niklasson, C.-G. Granqvist, and M. Mwamburi, “Transparent and conducting TiO2: Nb films made by sputter deposition: Application to spectrally selective solar reflectors,” Sol. Energy Mater. Sol. Cells, vol. 94, no. 1, pp. 75–79, 2010. |
| [9] | F. I. Chowdhury, T. Blaine, and A. B. Gougam, “Optical transmission enhancement of fluorine doped tin oxide (FTO) on glass for thin film photovoltaic applications,” Energy Procedia, vol. 42, pp. 660–669, 2013. |
| [10] | S. C. Dixon, D. O. Scanlon, C. J. Carmalt, and I. P. Parkin, “n-Type doped transparent conducting binary oxides: an overview,” J. Mater. Chem. C, vol. 4, no. 29, pp. 6946–6961, 2016. |
| [11] | V. W. Muramba, “Preparation and Characterization of Transparent and Conducting Doped Tin Oxide Films,” PhD Thesis, Masters thesis, 2013. |
| [12] | B. Li, L. Huang, M. Zhou, N. Ren, and B. Wu, “Surface morphology and photoelectric properties of fluorine-doped tin oxide thin films irradiated with 532 nm nanosecond laser,” Ceram. Int., vol. 40, no. 1, pp. 1627–1633, 2014. |
| [13] | C.-Y. Tsay and S.-C. Liang, “Fabrication of p-type conductivity in SnO2 thin films through Ga doping,” J. Alloys Compd., vol. 622, pp. 644–650, 2015. |
| [14] | H. P. Dang, Q. H. Luc, V. H. Le, and T. Le, “The influence of deposition temperature and annealing temperature on Ga-doped SnO2 films prepared by direct current magnetron sputtering,” J. Alloys Compd., vol. 687, pp. 1012–1020, Dec. 2016, |
| [15] | A. S. Ahmed, M. Shafeeq M., M. L. Singla, S. Tabassum, A. H. Naqvi, and A. Azam, “Band gap narrowing and fluorescence properties of nickel doped SnO2 nanoparticles,” J. Lumin., vol. 131, no. 1, pp. 1–6, Jan. 2011, |
| [16] | Q. Jiang, X. Zhang, and J. You, “SnO2 : A Wonderful Electron Transport Layer for Perovskite Solar Cells,” Small, vol. 14, no. 31, p. 1801154, Aug. 2018, |
| [17] | A. M. Ganose and D. O. Scanlon, “Band gap and work function tailoring of SnO2 for improved transparent conducting ability in photovoltaics,” J. Mater. Chem. C, vol. 4, no. 7, pp. 1467–1475, Feb. 2016, |
| [18] | S. Sujatha Lekshmy and K. Joy, “Structural and optoelectronic properties of indium doped SnO2 thin films deposited by sol gel technique,” J. Mater. Sci. Mater. Electron., vol. 25, no. 4, pp. 1664–1672, Apr. 2014, |
| [19] | K. Ravichandran and K. Thirumurugan, “Type inversion and certain physical properties of spray pyrolysed SnO2: Al films for novel transparent electronics applications,” J. Mater. Sci. Technol., vol. 30, no. 2, pp. 97–102, 2014. |
| [20] | S. Yu, W. Zhang, L. Li, D. Xu, H. Dong, and Y. Jin, “Fabrication of p-type SnO2 films via pulsed laser deposition method by using Sb as dopant,” Appl. Surf. Sci., vol. 286, pp. 417–420, 2013. |
| [21] | H. M. Ali and A. M. A. Hakeem, “Characterization of n and p-type (SnO2) x (ZnO) 1-x nanoparticles thin films,” Eur. Phys. J. Appl. Phys., vol. 72, no. 1, p. 10301, 2015. |
| [22] | Y. Li, R. Deng, Y. Tian, B. Yao, and T. Wu, “Role of donor-acceptor complexes and impurity band in stabilizing ferromagnetic order in Cu-doped SnO2 thin films,” Appl. Phys. Lett., vol. 100, no. 17, 2012, Accessed: May 18, 2025. Available: |
| [23] | S. S. Pan et al., “p-type conduction in nitrogen-doped SnO2 films grown by thermal processing of tin nitride films,” Appl. Phys. A, vol. 109, no. 2, pp. 267–271, Nov. 2012, |
| [24] | M.-H. Lee, Y.-C. Peng, and H.-C. Wu, “Effects of intrinsic defects on electronic structure and optical properties of Ga-doped ZnO,” J. Alloys Compd., vol. 616, pp. 122–127, 2014. |
| [25] | K. Teshome, M. Birile, N. A. Tegegne, and F. G. Hone, “Effects of gallium doping on the structural, optical and electronic properties of PbS: Experimental and computational study,” Optik, vol. 259, p. 168964, 2022. |
| [26] | R. J. Deokate et al., “Structural, optical and electrical properties of chemically sprayed nanosized gallium doped CdO thin films,” J. Alloys Compd., vol. 496, no. 1–2, pp. 357–363, 2010. |
| [27] |
J. Ungula, “Formation and characterization of novel nanostructured un-doped and Ga-doped ZnO transparent conducting thin films for photoelectrode,” PhD Thesis, University of the Free State (Qwaqwa Campus), 2018. Accessed: May 18, 2025. Available:
https://scholar.ufs.ac.za/items/ffba44e9-7e56-4501-96c6-53bba11e6504 |
| [28] | Z. Kaddachi, M. Belhi, R. Gharbi, and M. B. Karoui, “Effect of Ga doped TiO 2 photoanode on photovoltaic performances of natural dye-sensitized solar cells,” in 2019 19th International Conference on Sciences and Techniques of Automatic Control and Computer Engineering (STA), IEEE, 2019, pp. 90–94. Accessed: May 18, 2025. Available: |
| [29] | A. Kaphle, Cobalt Doped ZnO and CuO Nanomaterials for Photovoltaic Applications. The University of Tulsa, 2019. Accessed: May 18, 2025. Available: |
| [30] | Y. Yuan et al., “Toward emerging gallium oxide semiconductors: A roadmap,” Fundam. Res., vol. 1, no. 6, pp. 697–716, 2021. |
| [31] | M. P. Subramaniam, G. Arunachalam, R. Kandasamy, P. Veluswamy, and I. Hiroya, “Effect of pH and annealing temperature on the properties of tin oxide nanoparticles prepared by sol–gel method,” J. Mater. Sci. Mater. Electron., vol. 29, no. 1, pp. 658–666, Jan. 2018, |
| [32] | G. E. Patil, D. D. Kajale, V. B. Gaikwad, and G. H. Jain, “Preparation and characterization of SnO2 nanoparticles by hydrothermal route,” Int. Nano Lett., vol. 2, no. 1, p. 17, July 2012, |
| [33] | F. Paraguay-Delgado et al., “Structural analysis and growing mechanisms for long SnO2 nanorods synthesized by spray pyrolysis,” Nanotechnology, vol. 16, no. 6, p. 688, Mar. 2005, |
| [34] | S. V. Nagirnyak, V. A. Lutz, T. A. Dontsova, and I. M. Astrelin, “Synthesis and Characterization of Tin (IV) Oxide Obtained by Chemical Vapor Deposition Method,” Nanoscale Res. Lett., vol. 11, no. 1, p. 343, Dec. 2016, |
| [35] | M. Kumar, A. Mehta, A. Mishra, J. Singh, M. Rawat, and S. Basu, “Biosynthesis of tin oxide nanoparticles using Psidium Guajava leave extract for photocatalytic dye degradation under sunlight,” Mater. Lett., vol. 215, pp. 121–124, Mar. 2018, |
| [36] | F. K. Alsammarraie, W. Wang, P. Zhou, A. Mustapha, and M. Lin, “Green synthesis of silver nanoparticles using turmeric extracts and investigation of their antibacterial activities,” Colloids Surf. B Biointerfaces, vol. 171, pp. 398–405, Nov. 2018, |
| [37] | D. Horwat et al., “Chemistry, phase formation, and catalytic activity of thin palladium-containing oxide films synthesized by plasma-assisted physical vapor deposition,” Surf. Coat. Technol., vol. 205, pp. S171–S177, July 2011, |
| [38] | G. E. Hoag, J. B. Collins, J. L. Holcomb, J. R. Hoag, M. N. Nadagouda, and R. S. Varma, “Degradation of bromothymol blue by ‘greener’nano-scale zero-valent iron synthesized using tea polyphenols,” J. Mater. Chem., vol. 19, no. 45, pp. 8671–8677, 2009. |
| [39] | S. Ahmed and S. Ikram, “Silver nanoparticles: one pot green synthesis using Terminalia arjuna extract for biological application,” J Nanomed Nanotechnol, vol. 6, no. 4, pp. 1–6, 2015. |
| [40] | H. S. Devi, M. A. Boda, M. A. Shah, S. Parveen, and A. H. Wani, “Green synthesis of iron oxide nanoparticles using Platanus orientalis leaf extract for antifungal activity,” Green Process. Synth., vol. 8, no. 1, pp. 38–45, Jan. 2019, |
| [41] | N. Kataria and V. K. Garg, “Green synthesis of Fe3O4 nanoparticles loaded sawdust carbon for cadmium (II) removal from water: Regeneration and mechanism,” Chemosphere, vol. 208, pp. 818–828, Oct. 2018, |
| [42] | I. H. Ifijen, E. U. Ikhuoria, S. O. Omorogbe, B. Anegbe, E. M. Jonathan, and D. I. Chikaodili, “Chemical, plant and microbial mediated synthesis of tin oxide nanoparticles: antimicrobial and anticancer potency,” Braz. J. Chem. Eng., vol. 40, no. 4, pp. 965–991, Dec. 2023, |
| [43] | J. Jepngetich, S. A. Opiyo, P. W. Njoroge, and S. Kiprotich, “Effects of Ag Doping Concentrations on Structural and Optical Properties of Citrus Reticulata Capped ZnO Nanoparticles,” 2025, Accessed: May 17, 2025. Available: |
| [44] | S. Siyalo, H. F. Etefa, and F. B. Dejene, “Enhancing structural and optical properties of CuO thin films through gallium doping: A pathway to enhanced photoluminescence and predict for solar cells applications,” Chem. Phys. Impact, vol. 10, p. 100832, June 2025, |
| [45] | H. Kafashan, Z. Orshesh, A. Bahrami, and F. Zakerian, “Structural and optoelectronic properties of electrodeposited CdSe thin films: effect of Cu-dopant,” Phys. B Condens. Matter, vol. 675, p. 415623, 2024. |
| [46] | S. S. Shinde, P. S. Shinde, Y. W. Oh, D. Haranath, C. H. Bhosale, and K. Y. Rajpure, “Structural, optoelectronic, luminescence and thermal properties of Ga-doped zinc oxide thin films,” Appl. Surf. Sci., vol. 258, no. 24, pp. 9969–9976, Oct. 2012, |
| [47] | H. Siddiqui, M. R. Parra, and F. Z. Haque, “Optimization of process parameters and its effect on structure and morphology of CuO nanoparticle synthesized via the sol- gel technique,” J. Sol-Gel Sci. Technol., vol. 87, pp. 125–135, 2018. |
| [48] |
G. S. Waweru, S. Kiprotich, and P. Waithaka, “Effects of growth temperature on the structural and optical properties of synthesized titanium dioxide nanoparticles,” 2024, Accessed: May 16, 2025. Available:
https://idl-bnc-idrc.dspacedirect.org/bitstreams/1e065307-334f-44fa-9559-d21854b73e9d/download |
| [49] |
K. Bett and S. Kiprotich, “Effects of Stirring Speed of Precursor Solution on the Structural Optical and Morphological Properties of ZnO Al Ga CoDoped Nanoparticles Synthesized via a Facile Sol Gel Technique,” 2024, Accessed: May 07, 2025. Available:
https://idl-bnc-idrc.dspacedirect.org/bitstreams/f20815b8-0713-4f7f-832b-de87cdf7d197/download |
| [50] | M. Saha, S. Ghosh, V. D. Ashok, and S. K. De, “Carrier concentration dependent optical and electrical properties of Ga doped ZnO hexagonal nanocrystals,” Phys. Chem. Chem. Phys., vol. 17, no. 24, pp. 16067–16079, 2015, |
| [51] | E. T. Seid and F. B. Dejene, “Gallium and indium co-doping effects on structural, optical and luminescence properties of ZnO nanostructures,” Mater. Today Commun., vol. 27, p. 102330, 2021. |
| [52] | B. Shanmuga Priya, M. Shanthi, C. Manoharan, and S. Dhanapandian, “Synthesis, characterization and photocatalytic activity of pure and Zn-doped In2O3 nanostructures,” J. Mater. Sci. Mater. Electron., vol. 28, no. 17, pp. 12784–12794, Sept. 2017, |
| [53] | D. N. Papadimitriou, “Structural, optical, electrical properties, and strain/stress of electrochemically deposited highly doped ZnO layers and nanostructured ZnO antireflective coatings for cost-effective photovoltaic device technology,” Thin Solid Films, vol. 605, pp. 215–231, 2016. |
| [54] | A. Samavati et al., “Structural, optical and electrical evolution of Al and Ga co-doped ZnO/SiO2 /glass thin film: role of laser power density,” RSC Adv., vol. 7, no. 57, pp. 35858–35868, 2017, |
| [55] | H. J. Al-Asedy, A. A. Ati, N. Bidin, and S.-L. Lee, “Gallium contents-dependent improved behavior of sol–gel-grown Al: Ga co-doped ZnO nanostructures,” Appl. Phys. A, vol. 123, no. 10, p. 665, Oct. 2017, |
| [56] | N. S. Sabri, M. S. M. Deni, A. Zakaria, and M. K. Talari, “Effect of Mn Doping on Structural and Optical Properties of SnO2 Nanoparticles Prepared by Mechanochemical Processing,” Phys. Procedia, vol. 25, pp. 233–239, 2012, |
| [57] | S. M. Hosseini, I. A. Sarsari, P. Kameli, and H. Salamati, “Effect of Ag doping on structural, optical, and photocatalytic properties of ZnO nanoparticles,” J. Alloys Compd., vol. 640, pp. 408–415, Aug. 2015, |
| [58] | N. Zebbar et al., Thin Solid Films, vol. 605, pp. 89–94, 2016. |
| [59] | M. Bhatnagar, V. Kaushik, A. Kaushal, M. Singh, and B. R. Mehta, “Structural and photoluminescence properties of tin oxide and tin oxide: C core–shell and alloy nanoparticles synthesised using gas phase technique,” AIP Adv., vol. 6, no. 9, 2016, Accessed: May 22, 2025. Available: |
| [60] | D. P. Pham et al., “In and Ga Codoped ZnO Film as a Front Electrode for Thin Film Silicon Solar Cells,” Adv. Condens. Matter Phys., vol. 2014, pp. 1–7, 2014, |
| [61] | H. Nasir et al., “Variations in structural, optical, and dielectric properties of CuO nanostructures with thermal decomposition,” J. Mater. Sci. Mater. Electron., vol. 31, pp. 10649–10656, 2020. |
APA Style
Kiprotich, B., Waithaka, P., Opiyo, S., Kiprotich, S. (2025). Green Synthesis of Ga-Doped SnO2 Nanoparticles: Effects of Ga Doping Concentrations on the Structural and Optical Properties. Journal of Photonic Materials and Technology, 10(2), 13-24. https://doi.org/10.11648/j.jpmt.20251002.11
ACS Style
Kiprotich, B.; Waithaka, P.; Opiyo, S.; Kiprotich, S. Green Synthesis of Ga-Doped SnO2 Nanoparticles: Effects of Ga Doping Concentrations on the Structural and Optical Properties. J. Photonic Mater. Technol. 2025, 10(2), 13-24. doi: 10.11648/j.jpmt.20251002.11
@article{10.11648/j.jpmt.20251002.11,
  author = {Bethwel Kiprotich and Peter Waithaka and Sylvia Opiyo and Sharon Kiprotich},
  title = {Green Synthesis of Ga-Doped SnO2 Nanoparticles: Effects of Ga Doping Concentrations on the Structural and Optical Properties
},
  journal = {Journal of Photonic Materials and Technology},
  volume = {10},
  number = {2},
  pages = {13-24},
  doi = {10.11648/j.jpmt.20251002.11},
  url = {https://doi.org/10.11648/j.jpmt.20251002.11},
  eprint = {https://article.sciencepublishinggroup.com/pdf/10.11648.j.jpmt.20251002.11},
  abstract = {This study explores the transformative impact of gallium (Ga) doping on the structural and optical properties of tin oxide NPs synthesized using chemical and green method. The nanoparticles were synthesized at different doping concentrations of gallium (Ga-SnO2). The effects of different dopant concentration on structural and optical properties of Psidium guajava capped SnO2 nanoparticles were investigated using X-ray diffraction (XRD), Ultra Violet- Visible spectrophotometer (UV-Vis), Fourier transform infrared and photoluminescence spectroscopy (PL). The bandgap energies of Ga-SnO2NPs were estimated using Tauc’s plot. The bandgap energies were observed to decrease with introduction of gallium. Highest bandgap was obtained at 2.5% and 2.0% Ga-SnO2NPs having a bandgap value of 3.25 and 3.07 eV for capped and uncapped Ga-SnO2 respectively. Smallest bandgap was obtained at 0.5% Ga-SnO2 NPs having a bandgap value of 2.29 and 2.46 eV for capped and uncapped Ga-SnO2 respectively. Fourier transform infrared spectroscopy showed the stretching vibration of SnO2 between 690–790 cm-1 wavenumbers. Structural analysis using X-ray diffraction (XRD revealed Ga doping significantly leads to a decrease in crystallite size calculated using Scherrer equation. The results obtained showed that both capped and uncapped Ga-SnO2 maintained the tetragonal rutile structure. This showed that the dopant occupied the interstitial site of the precursor materials. Derby Scherrer formula was used to calculate the crystallite size, the results obtained showed that capping agents and doping reduces the crystallite size of nanoparticles. All nanoparticles formed were in the range of 10.99–18.00 nm. The PL spectrum showed emission at a near band emission and deep level emission.
},
 year = {2025}
}
TY  - JOUR
T1  - Green Synthesis of Ga-Doped SnO2 Nanoparticles: Effects of Ga Doping Concentrations on the Structural and Optical Properties

AU  - Bethwel Kiprotich
AU  - Peter Waithaka
AU  - Sylvia Opiyo
AU  - Sharon Kiprotich
Y1  - 2025/10/09
PY  - 2025
N1  - https://doi.org/10.11648/j.jpmt.20251002.11
DO  - 10.11648/j.jpmt.20251002.11
T2  - Journal of Photonic Materials and Technology
JF  - Journal of Photonic Materials and Technology
JO  - Journal of Photonic Materials and Technology
SP  - 13
EP  - 24
PB  - Science Publishing Group
SN  - 2469-8431
UR  - https://doi.org/10.11648/j.jpmt.20251002.11
AB  - This study explores the transformative impact of gallium (Ga) doping on the structural and optical properties of tin oxide NPs synthesized using chemical and green method. The nanoparticles were synthesized at different doping concentrations of gallium (Ga-SnO2). The effects of different dopant concentration on structural and optical properties of Psidium guajava capped SnO2 nanoparticles were investigated using X-ray diffraction (XRD), Ultra Violet- Visible spectrophotometer (UV-Vis), Fourier transform infrared and photoluminescence spectroscopy (PL). The bandgap energies of Ga-SnO2NPs were estimated using Tauc’s plot. The bandgap energies were observed to decrease with introduction of gallium. Highest bandgap was obtained at 2.5% and 2.0% Ga-SnO2NPs having a bandgap value of 3.25 and 3.07 eV for capped and uncapped Ga-SnO2 respectively. Smallest bandgap was obtained at 0.5% Ga-SnO2 NPs having a bandgap value of 2.29 and 2.46 eV for capped and uncapped Ga-SnO2 respectively. Fourier transform infrared spectroscopy showed the stretching vibration of SnO2 between 690–790 cm-1 wavenumbers. Structural analysis using X-ray diffraction (XRD revealed Ga doping significantly leads to a decrease in crystallite size calculated using Scherrer equation. The results obtained showed that both capped and uncapped Ga-SnO2 maintained the tetragonal rutile structure. This showed that the dopant occupied the interstitial site of the precursor materials. Derby Scherrer formula was used to calculate the crystallite size, the results obtained showed that capping agents and doping reduces the crystallite size of nanoparticles. All nanoparticles formed were in the range of 10.99–18.00 nm. The PL spectrum showed emission at a near band emission and deep level emission.

VL  - 10
IS  - 2
ER  -
Department of Physical and Biological Science, Murang’a University of Technology, Murang’a, Kenya
Department of Physical and Biological Science, Murang’a University of Technology, Murang’a, Kenya
Department of Physical and Biological Science, Murang’a University of Technology, Murang’a, Kenya
Department of Physical and Biological Science, Murang’a University of Technology, Murang’a, Kenya
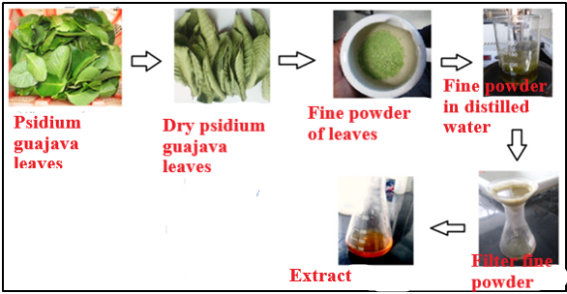
Figure 1. Schematic representation of Psidium guajava leaves extract preparation.
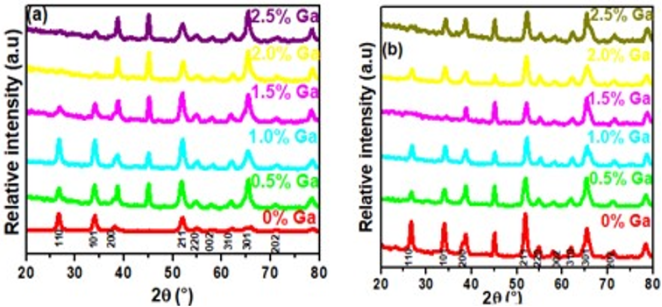
Figure 2. XRD pattern of synthesized SnO2 and Ga-SnO2 with (a) and without (b) Psidium guajava extract in the range 20-80.
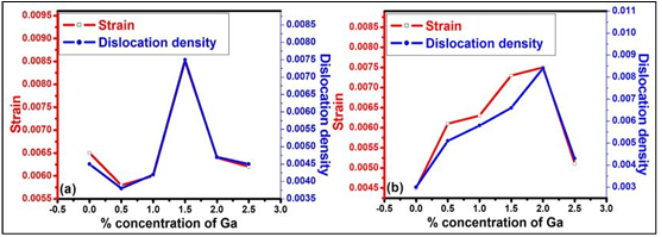
Figure 3. Trend of micro strain and dislocation density of capped (a) and uncapped (b) Ga-SnO2.
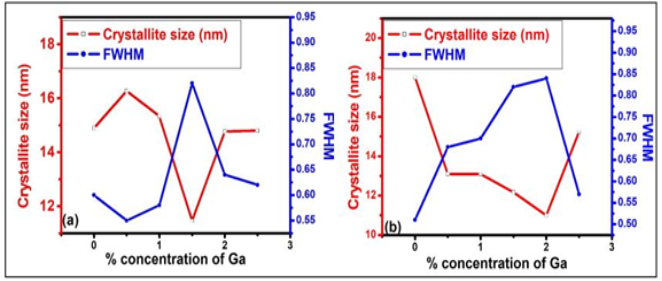
Figure 4. Relationship between crystallite size and FWHM of capped (a) and uncapped (b) Ga-SnO2.
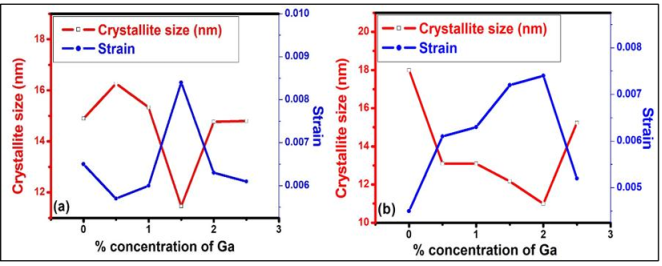
Figure 5. Shows the variation in crystallite size and strain for capped (a) and uncapped (b) Ga-SnO2.
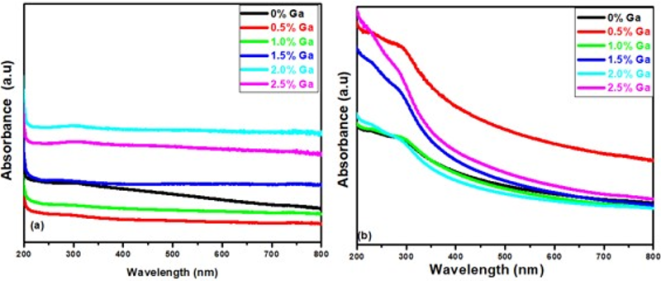
Figure 6. Absorption spectra of synthesized pure SnO2 and Ga-SnO2 with (a) and without (b) the Psidium guajava extract.
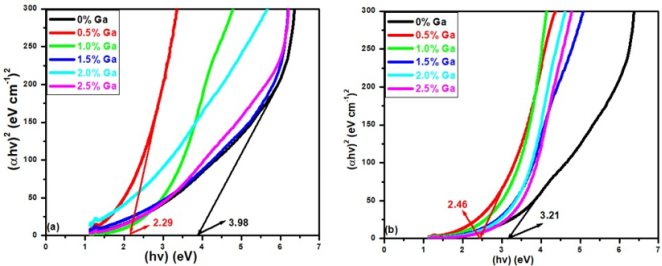
Figure 7. Tauc’s plot estimate of synthesized SnO2 and Ga-SnO2 with (a) and without (b) Psidium guajava extract.
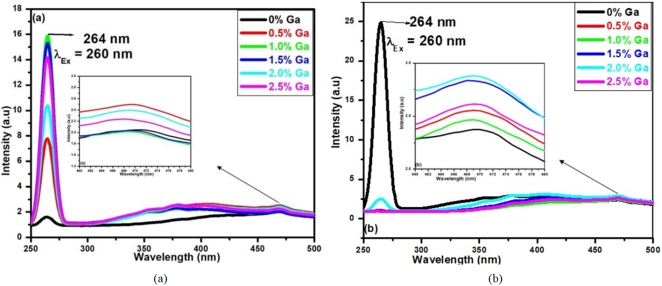
Figure 8. Photoluminescence spectra of synthesized pure and Ga-SnO2 with (a) and without (b) Psidium guajava extract.
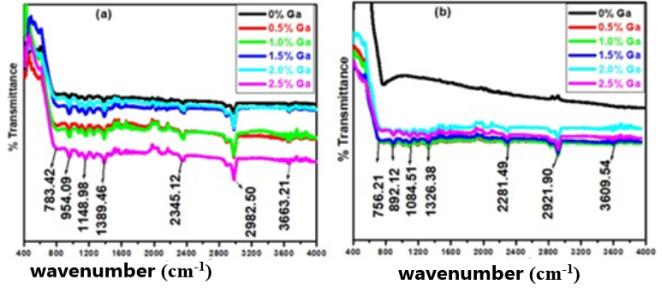
Figure 9. FTIR spectra of capped (a) and uncapped (b) Ga-SnO2 at varying concentrations of the dopant.
Information

