Abstract
In Cameroon, the crisis linked to the COVID-19 pandemic has found a society characterized by income inequalities, the response to which had to be taken into account to enable the country to pursue its objective of the vision towards emergence by 2035. It is in this context that this study aims to evaluate the effects of the measures to manage the COVID-19 crisis on the dynamics of income inequalities in Yaounde - the political capital and second largest metropolis in the country - and its surrounding areas with more than 4 million inhabitants during the period from 2019 to 2022. For this purpose, we use the Income Equality index (ER), which is an innovative indicator that we designed based on the literature. This index measures the perceptible income gaps between individuals. Between 0 and 1, a value that tends towards 1 shows that there is not a considerable gap between individuals' incomes; and a value that tends towards 0 is considered a significant degree of inequality. To assess the effects of the response measures on income inequality, a principal correspondence analysis was conducted. This analysis allowed us to see the similarities between municipalities and the correlations that exist between the different variables. As the data from the latest Cameroon Household Survey (ECAM 5) of the National Institute of Statistics conducted in 2021 have not yet been published for updating, data collection from households was carried out on a sample of 1,000 households spread across 10 municipalities. According to the results, a low dynamic of income inequality was recorded in half of the municipalities in our sample and no effect of crisis management measures was found on these income inequalities.
|
Published in
|
Journal of Public Policy and Administration (Volume 9, Issue 3)
|
|
DOI
|
10.11648/j.jppa.20250903.12
|
|
Page(s)
|
136-143 |
|
Creative Commons
|

This is an Open Access article, distributed under the terms of the Creative Commons Attribution 4.0 International License (http://creativecommons.org/licenses/by/4.0/), which permits unrestricted use, distribution and reproduction in any medium or format, provided the original work is properly cited.
|
|
Copyright
|
Copyright © The Author(s), 2025. Published by Science Publishing Group
|
Keywords
Inequality, Income, Response, COVID-19, ER, Municipality
1. Background
In recent years, researchers have been constantly addressing issues of equity and income distribution alongside those of economic growth. In Cameroon, as in many developing countries, programs implemented by the government with the support of international financial institutions are producing not only positive but also harmful effects on certain social segments of the population. To this end, particular emphasis must be placed on the most disadvantaged and therefore vulnerable groups. In other words, there must be compatibility between the economic strategy and the poverty reduction strategy; which has been the case since the Poverty Reduction Strategy Document (PRSD) in Cameroon
| [1] | MINEPAT. Document de Stratégie de Réduction de la Pauvreté. Republic of Cameroon. 2003. |
[1]
. However, implementation remains a challenge. In 2014, ECAM 4 estimated that 37.5% of Cameroon's population lived below the poverty line, and the crisis caused by the pandemic appears to have further exacerbated matters
.
The coronavirus pandemic (COVID-19) crisis has shaken the world since the beginning of 2020. No country in the world has been spared, and no social class has been immune. The COVID-19 pandemic has exposed the vulnerability of the human species. The health crisis has brought with it an economic and societal crisis unprecedented in world history, since the two (02) world wars
. The level of widespread risk reached so far has highlighted the common fate of our collective humanity.
In the medium term, this health crisis has subsided, giving way to its two offshoots: the economic crisis and the societal crisis, which are not receding at the same pace. In the Cameroonian context, the crisis has not had the same impact across the entire country. Certain areas, such as major cities, have been more exposed.
Cameroon, like other African countries infected mainly by people from outside the country, has taken a series of strong measures to deal with the pandemic.
Faced with the panic caused by the virulence, malice and speed of spread of the pandemic, the response measures recommended and implemented across continents have competed in harshness, firmness and severity. These response measures, as defined, have been likely to slow down economic activity in general and deteriorate the living conditions of populations while widening inequalities. In this context, it appears appropriate to know: “What are the effects of crisis management measures on the dynamics of income inequality in Yaounde and its surroundings during and after COVID-19?”
The general objective of this study is to assess the effects of crisis management measures on the dynamics of income inequality in Yaounde and its surrounding areas during and after COVID-19.
Specifically, this will involve to:
1) Assessing the dynamics of income inequality between 2019 and 2022;
2) Analyze the effects of government solutions on the evolution of inequalities during and after the COVID-19 pandemic.
2. The Vicious Circle of Income Inequality in Cameroon
Income inequality describes the differences in income between individuals, households, social groups or geographical areas (countries, etc.). These inequalities relate to income flow (monthly, annual, etc.) and not to wealth. Income gaps are generally linked to individuals' employment status or their wealth. These gaps can also be explained by other factors such as, for example, the level of education, gender, social or geographical origin. In addition to the analysis of income differences at a given time ("transverse" inequalities), inequalities can be studied from other dimensions, notably in terms of social mobility, for example from one generation to the next (we then speak of "longitudinal" inequalities)
.
2.1. The Role of Inequality in the Fight Against Poverty
Many economists believe that income inequality stimulates innovation and therefore growth. However, most researchers, institutions, and public authorities today believe that excessive income inequality undermines social cohesion and, more generally, economic growth
| [5] | Alvaredo, Facundo, Lucas Chancel, Thomas Piketty, Emmanuel Saez, and Gabriel Zucman. The Elephant Curve of Global Inequality and Growth. AEA Papers and Proceedings. 2018. 108: 103–08. https://doi.org/10.1257/pandp.20181073 |
[5]
.
The fight against income inequality involves, in particular, the development of structural policies focused on equal opportunities, income redistribution policies combining compulsory levies and social benefits, as well as public services allowing everyone access to basic goods (health, education, security, etc.)
.
To this end, the literature provides us with several pieces of information on empirical methods for estimating inequalities. Each method has advantages and limitations: they are complementary for measuring and analyzing inequalities. Households are often divided into 10% income groups: deciles. This organization allows us to study the interdecile ratio, which compares, for example, the income received by the richest 10% with that received by the poorest 10%. To study the share of the very rich, we also study the proportion of income received by the wealthiest 1% or 0.1%. This type of comparison allows for the analysis of income distribution at the extremes. It can be supplemented by studying the share of income received by decile groups (the poorest 50% or the middle class, for example). This provides analyses of the income of the entire population
.
The more recent Palma indicator is a form of interdecile ratio that measures the ratio between the income of the richest 10% and that of the poorest 40%: widely used for the study of developing countries, it allows us to know whether economic growth benefits the entire population or only an elite
. The Gini coefficient is also often used: it fluctuates between 0 (perfect theoretical equality where everyone receives the same income) and 1 (perfect theoretical inequality where a single individual receives the entire income of the country)
.
In recent years, researchers have been constantly addressing issues of equity and income distribution alongside those of economic growth. In Cameroon, as in many developing countries, programs implemented by the government with the support of international financial institutions are producing not only positive but also harmful effects on certain social segments of the population. To this end, special emphasis must be placed on the most disadvantaged groups of the population in correlation with the process of economic growth. In other words, there must be compatibility between the economic strategy and the strategy for combating poverty.
A pragmatic assessment of the fight against poverty requires, in particular, that we measure, possibly, the effects of growth on poverty and social inequality. Generally, analyses focus on the nature of the relationship between growth and inequality
| [8] | Anda David, Murray Leibbrandt, Vimal Ranchhod, et Rawane Yasser. Inégalités en Afrique subsaharienne, Perspectives multidimensionnelles et enjeux futurs. World Bank Publications. 2025. https://doi.org/10.1596/978-1-4648-2150-9 |
[8]
. The most important issue at present is how to accelerate the pace of poverty reduction.
The level of poverty depends on two elements, namely: average income and income inequality. Thus, the reduction in absolute poverty results mechanically from two factors: on the one hand, the increase in the average income of the population, with constant relative distribution of income, leads to a reduction in poverty; on the other hand, with constant average income, any redistribution of income towards the poor produces the same effect
| [10] | Samuel Fambon. "Croissance économique, pauvreté et inégalité des revenus au Cameroun," Revue d’économie du développement, De Boeck Université. 2005. vol. 13(1), pages 91-122. |
[10]
.
2.2. The COVID-19 Crisis in a Context of Inequality and Poverty in Cameroon
In Cameroon, growth estimates, according to various sources, may diverge on the figures, but they all converged towards a recession in 2020. Whether it is government authorities through the Ministry of Economy, the Bank of Central African States (BEAC), the central bank of the community countries, the CEMAC Commission, the UNDP Cameroon office, the AfDB, the IMF or the World Bank, the growth rate is estimated between -4 and -1.5% of GDP. The country is therefore inevitably heading towards a very difficult situation.
The measures taken by the government to mitigate the effects of the crisis have not been without negative consequences. The tourism sector has become the first victim of COVID-19. With the closure of air, land, and sea borders in all countries, and lockdown measures forcing the closure of bars, restaurants, and leisure facilities, tourism has paid the heaviest price. In the same vein, we can cite everything related to events, international conferences, fairs and festivals, etc.
.
The transport sector, being closely linked to tourism, suffered the same setback. The lockdown and the resulting shock to the tourism sector have led to a drop in activity in the brewing and other agri-food industries; similarly, the dynamics in the construction and public works sector are slowing down due to the disruption of work on several sites in connection with the lockdown measures.
Wholesale and retail trade were also affected. The decline was mainly due to lockdown measures, reduced imports and exports due to border closures, and a drop in demand for products not essential to daily survival. Furthermore, 85% of Cameroonian companies believe that their turnover is directly affected, a proportion which rises to 92% among large companies
. The Cameroon Business Association (ECAM) stated in a column published in the press that Very Small Enterprises (VSEs) and SMEs are the most negatively impacted by the pandemic. According to the results of this study, losses according to the business leaders consulted are around 60% and can sometimes reach 80%. Naturally, all these private actors turned their attention to the government for accompanying and support measures to avoid bankruptcy.
Another big loser due to COVID-19, and one that is not talked about enough due to its non-commercial nature, is the Public Administration. The recommended confinement and social distancing have increased absenteeism and reduced the low productivity of Cameroonian public administrations. However, the sector's output is measured by wages, which are resistant to falling, especially in these times of social crisis. No adjustment is possible in this context.
It is undoubtedly clear that the response measures to the health crisis in Cameroon have produced other effects on the fight against inequality and poverty. Hence the importance of measuring these effects through this study.
3. Methodology
3.1. Sampling and Data Source
As the ECAM 4 (2014) data were not updated at the time of this work, CAMERCAP-PARC mobilized investigators who collected the data using the media designed for this purpose. The data collected covered a period from 2019 to 2022, to capture the dynamics of income inequality.
A sample of 1000 households was selected, i.e. 100 households per municipality. These households were drawn randomly, thus respecting a step of 5 houses in the rural stratum, 10 for the semi-urban stratum and 15 in the urban stratum; precisely in the seven (07) municipalities of Yaounde and those of Mfou, Obala and Mbankomo. It focuses exclusively on the household component.
3.2. Measuring Income Inequality
For the analysis of inequality, we proposed an index measuring income gaps between populations. This index, called the Income Equality Index (ER), is based on the distribution of income within the population.
The ER, inspired by the survival index of children under 5 years
, is developed using statistical methods based on the estimation of the maximum probability of the beta-binomial distribution. It allows us to distinguish between household variations in income from work or other activities. To calculate the ER, we transformed income into a ratio.
Where r is the ratio of a given household's income to the country's wealth level (GDP/capita); r is the average ratio and n is the sample size.
The particular form of this synthetic index of inequality was chosen on the basis of a survey carried out among a thousand people to determine their preferences in terms of measuring inequalities. Since all measures of goal achievement are assumed to be positive, the inequality index was transformed into the equality index (1 minus inequality).
The Income Equality index (ER) ranges from 0 to 1; a value that strongly tends towards 1 indicates that there is not too much difference in income between populations. A value of 0 is considered a significant degree of inequality.
Box 1: Difference between existing inequality indices and ER.
In practice, the calculation of the GINI coefficient and others is done on the population segments. It is therefore a matter of dividing the population into segments according to income levels and then applying an index calculation between these segments. They are therefore more focused on assessing income inequality between population groups. It should be noted that difficulty in distributing the population by group can lead to significant bias in the assessment
.
However, the Income Equality Index we propose aims to assess inequalities between all households. Population segments are not predefined, but the calculation is done as if all households were in the same basket in order to clearly see the differences that exist between the incomes of all households.
Like the others, the ER varies between 0 and 1. However, for the ER, the value 0 represents perfect inequality unlike the other indices. Furthermore, an ER value that tends towards 0 demonstrates that there are income brackets in the population. This then allows us to define these slices. This index can therefore be considered as a prerequisite for using other indices to determine whether or not slices exist in the population.
In conclusion, the ER is used whatever the situation: existence or not of slices in the population.
3.3. Analytical Approach
To assess the effects of response measures on inequality dynamics, we use principal component analysis, which is one of the methods for analyzing multivariate data. Using this method allows us to assess the correlations that exist between the ER and the variables representing the response measures (Appendix,
table 3).
4. Results
4.1. Analysis of the Dynamics of Income Inequality
Between 2019 and 2022, we see that the ER for most municipalities tends towards 1. This means that almost all households from the samples of these municipalities have roughly the same income levels. There is then very little difference between these households. However, some municipalities have ER below 0.5, thus expressing the presence of strong inequalities in these localities.
The perception of inequalities depends not only on their evolution but also on their level. Gaps can be considered "acceptable" if they tend to narrow. The dynamics of society constitute a source of collective hope. One explanation for the significant gaps currently observed lies precisely in the halting of this dynamic.
The households in our sample have roughly the same income levels. This is due to the fact that Cameroon's socioeconomic structure is characterized by the existence of an informal sector, which is a source of income for most households. According to official statistics, the informal sector occupies a predominant place in the Cameroonian economy, with more than 50% of the GDP and nearly 90% of the working population being part of it, or approximately 9.2 million people in 2010
| [14] | National Institute of Statistics. Enquête sur l'Emploi et le Secteur Informel. 2010. |
[14]
.
Due to its size, the informal sector has several social and economic consequences. Often considered a social buffer, the informal sector provides income to many households; these incomes do not vary significantly from one household to another. It also generally offers goods and services at prices that meet the low purchasing power of households. According to the World Bank, a large informal sector also means poor development performance
. The presence of high informality is characterized by a low level of household income.
Table 1. Income equality index in Yaounde and its surrounding areas between 2019 and 2022.
Municipalities | 2019 | 2020 | 2021 | 2022 |
Yaounde 1 | 0.959 | 0.974 | 0.978 | 0.971 |
Yaounde 2 | 0.846 | 0.903 | 0.859 | 0.940 |
Yaounde 3 | 0.855 | 0.880 | 0.830 | 0.199 |
Yaounde 4 | 0.629 | 0.625 | 0.479 | 0.538 |
Yaounde 5 | 0.806 | 0.868 | 0.933 | 0.935 |
Yaounde 6 | 0.992 | 0.992 | 0.991 | 0.988 |
Yaounde 7 | 0.606 | 0.609 | 0.737 | 0.741 |
Mbankomo | 0.961 | 0.962 | 0.967 | 0.971 |
Mfou | 0.539 | 0.513 | 0.284 | 0.351 |
Obala | 0.997 | 0.996 | 0.995 | 0.993 |
source: Estimate based on CAMERCAP-PARC data, 2022
The negative effects of the informal sector are real and numerous. Socially, it perpetuates poverty due to the very low pay levels of the jobs offered, which are also very precarious and almost unstable for all employees
.
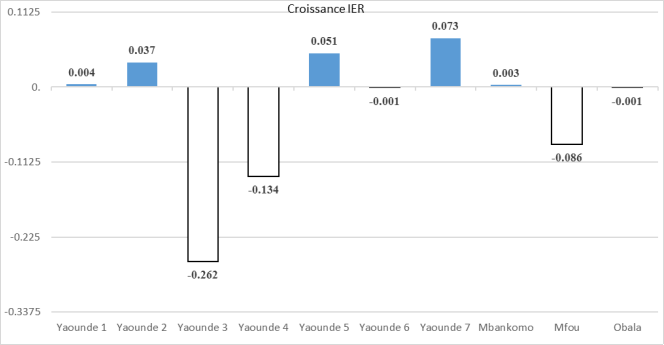
There is little dynamics in income inequality in Yaounde and its surrounding areas. The ER varies very little from one year to the next for all localities. However, we do have both positive and negative variations. Thus, we have half of the municipalities which present a negative variation reflecting an increase in income inequalities between households.
Figure 1. Average growth rate of the income equality index by municipality between 2019 and 2022.
These variations, although small, demonstrate that there was a movement in household income during the period from 2019 to 2022, a period during which the COVID-19 pandemic raged in all countries around the world.
Based on these findings, can we present pandemic response measures as the cause of this rise in inequality? The following section therefore aims to analyze the effects of pandemic management on the variation in inequality.
4.2. Measures to Fight COVID-19 and Income Inequality in Yaounde and Its Surrounding Areas
The management of COVID-19 in Cameroon is analyzed through the prism of the two stages of the response. The first concerns the implementation of restrictive measures to limit the spread of the virus; and the second consists of the implementation of support measures for vulnerable households facing the crisis.
4.2.1. The Effects of Restrictive Measures
According to this study, it appears that the COVID-19 response measures have not influenced the dynamics of income inequality in Yaounde and its surrounding areas. First, the gaps have varied very little, thus demonstrating that the crisis has had no real impact on household income. This result is entirely explained by the non-strict nature of the application of response measures.
It should be noted that Cameroon, despite having cases, is one of the countries that has not experienced any real rigor. The country did not undergo a strict lockdown, and the measures restricting freedoms were not only not respected, but also only lasted a few weeks. No open-air markets were closed.
In fact, the population was not even aware of several measures. It is noted that, according to this study, on average, 3 out of around twenty measures were known among the population.
4.2.2. The Effects of Household Support Measures
The government has announced several measures to support households affected by the COVID-19 crisis
. These measures cost 180 billion, including some activities aimed at reducing inequalities during the crisis, which are listed in the following table:
Table 2. Amount allocated to administrations to reduce the effects of the COVID-19 crisis.
Administrations | Amount (CFA F) | Planned activities |
Ministry of Economy, Planning and Regional Development (MINEPAT) | 16 billion | Social safety nets project |
Ministry of Agriculture and Rural Development | 06 billion | Reducing food dependency |
Ministry of trade | 01 billion | Implementation of a monitoring system aimed at ensuring the availability of stocks of everyday consumer products |
Ministry for the Advancement of Women and the Family | 575 million | Acquisition and distribution of agro-pastoral equipment and inputs |
source: Autors
However, when the data for this study was collected, the only effective government support was financial and food. Furthermore, the evolution of inequalities was not affected by these two measures, certainly due to the weakness of their deployment. Only 9.1% of households received support from the Government and the average amount received per household, in financial terms, was 14,151 CFA francs over the entire study period.
Several supports were not delivered to the target population. It should be noted that a significant number of households that did not meet the eligibility criteria received this support. Hence the need to conduct this study on a national scale to describe the route taken by government support. Furthermore, the case of transfers between households and support from civil society organizations has not been traced.
5. Limitation of the Study
Due to a lack of financial resources, the study could not be carried out across the entire country. This situation therefore made it impossible to verify the effectiveness of the effects of pandemic management in regions other than the central region.
6. Recommendations
Following the analysis of the results, we make some recommendations above:
1) Reproduce this study on a national scale in order to better understand the evolution of inequalities in the entire Cameroonian population/entire territory;
2) Rethink the approach to policies to combat income inequality and their methods of operation. In reality, instead of making direct donations to so-called disadvantaged households, it would be appropriate to favor the project approach, this would allow households to benefit in the long term themselves by participating. It is more about early recovery;
3) Conduct a study on the different vulnerability criteria in order to categorize the destitute and limit the “guilty destitute” who unfortunately benefit most from the support that is not intended for them;
4) Emphasize communication for development, with the role no longer being that of traditional institutional communication, but rather communication focused on achieving the objectives assigned to each of the institutions involved in the fight against income inequality;
5) Establish measures to trace funds allocated to households, according to different internal and external sources, with a view to limiting leaks and poor redistribution.
Abbreviations
CAMERCAP-PARC | Cameroon Policy Analysis and Research Center |
COVID-19 | Coronavirus Disease 2019 |
ECAM | Cameroon Household Survey |
ER | Income Equality Index |
PRSD | Poverty Reduction Strategy Document |
Author Contributions
Albert Ze: Conceptualization, Formal Analysis, Investigation, Methodology, Software, Writing – original draft
Barnabe Okouda: Project administration, Validation
Funding
The study was conducted as part of a collaboration between CAMERCAP-PARC and AERC. It was fully funded by AERC under the Africa Human Capital Building Program.
Conflicts of Interest
The authors declare no conflicts of interest.
Appendix
Table 3. Complete list of variables.
Variables | codes |
ER Growth | X2 |
Number of households headed by a man | X3 |
Average number of people in the household | X4 |
Number of households having had at least one COVID patient | X5 |
Number of households having made an expenditure for the treatment of COVID | X6 |
Average monthly amount spent on COVID treatment | D1 |
Number of households having received the COVID vaccine | X7 |
Number of households having paid for the COVID vaccine | X8 |
Average vaccine expenditure | D2 |
Number of households with a negative assessment of COVID measures | A1 |
Number of households with a positive assessment of COVID measures | A2 |
Number of households having spent on prevention | D3 |
Average expenditure related to COVID prevention | D4 |
Number of households having received government support | H1 |
Number of households having received support from municipalities | H2 |
Number of households having received support from NGOs | H3 |
Number of households having received support from private companies | H4 |
Number of households having received support from public and parapublic companies | H5 |
Number of households that received parliamentary support | H6 |
Number of households having received support from individuals | H7 |
Number of households receiving family support | H8 |
Number of households having received the prevention kits | H9 |
Number of households that received hygiene supplies | H10 |
Number of households that received food | H11 |
Number of households having received financial support | H12 |
Average amount of financial support | H13 |
Number of households satisfied with the support received | A3 |
Number of households having observed a decrease in activities | X9 |
Number of households experiencing a drop in income | X10 |
Number of households that experienced an increase in income | X11 |
Number of households experiencing delayed salary payments | X12 |
Household staff whose head has experienced a temporary stoppage | P1 |
Household head who has experienced job loss | P2 |
Household size whose head has experienced a closure or cessation of activities | P3 |
Household size whose head's activity has experienced a shortage of inputs | P4 |
Household staff whose head of household has experienced a deterioration in customer confidence | P5 |
Household size whose head's activity has experienced an increase in uncertainties | P6 |
Number of households satisfied with their income | P7 |
Source: authors
References
| [1] |
MINEPAT. Document de Stratégie de Réduction de la Pauvreté. Republic of Cameroon. 2003.
|
| [2] |
Okouda, B. Impact du COVID-19 sur l’économie camerounaise, confinement ou protectionnisme: au dela de l’urgence, une opportunité pour réaliser la rupture de notre modèle économique, CAMERCAP-PARC. 2020.
https://camercap-parc.cm/wp-content/uploads/2019/11/Impact_COVID-19_Camercap-parc_V1.pdf
|
| [3] |
GICAM. Rapport enquête COVID-19. 2020.
http://cdnss.minsante.cm/sites/default/files/GICAM Rapport Enquete COVID-19 - 24 avril 2020.pdf
|
| [4] |
Banque de France. Les inégalités de revenus. 2025.
https://www.banque-france.fr/fr/publications-et-statistiques/publications/les-inegalites-de-revenus
|
| [5] |
Alvaredo, Facundo, Lucas Chancel, Thomas Piketty, Emmanuel Saez, and Gabriel Zucman. The Elephant Curve of Global Inequality and Growth. AEA Papers and Proceedings. 2018. 108: 103–08.
https://doi.org/10.1257/pandp.20181073
|
| [6] |
Antoine Bozio. "Les méthodes d’évaluation des politiques publiques," PSE-Ecole d'économie de Paris (Postprint) halshs-03959885, HAL. 2018.
https://doi.org/10.3917/idee.193.0028
|
| [7] |
Muna Shifa and Vimal Ranchhod. Handbook on Inequality Measurement for Country Studies. African Centre of Excellence for inequality research. 2019.
https://aceir.uct.ac.za/sites/default/files/content_migration/aceir_uct_ac_za/1639/files/ACEIR%2520handbook_300519_single-page.pdf
|
| [8] |
Anda David, Murray Leibbrandt, Vimal Ranchhod, et Rawane Yasser. Inégalités en Afrique subsaharienne, Perspectives multidimensionnelles et enjeux futurs. World Bank Publications. 2025.
https://doi.org/10.1596/978-1-4648-2150-9
|
| [9] |
Marie Lamarre. L'indice de Palma. Observatoire québécois des inégalités. 2021.
https://observatoiredesinegalites.com/le-lexique-des-inegalites-lindice-de-palma/
|
| [10] |
Samuel Fambon. "Croissance économique, pauvreté et inégalité des revenus au Cameroun," Revue d’économie du développement, De Boeck Université. 2005. vol. 13(1), pages 91-122.
|
| [11] |
CAMERCAP-PARC. COVID-19 et les agendas de développement au Cameroun, en Afrique et dans le Monde: Sortie de piste? 2020.
https://camercap-parc.cm/portfolio/COVID-19-et-les-agendas-de-developpement-au-cameroun-en-afrique-et-dans-le-monde-sortie-de-piste/
|
| [12] |
World Health Organisation. The world health report 2000. World Health Organization. 2000.
https://www.who.int/publications/i/item/924156198X
|
| [13] |
Bellù, L. G. and Liberati, P. Inequality Analysis: The Gini Index. FAO. 2006. 30 p.
https://openknowledge.fao.org/server/api/core/bitstreams/a5e207ae-bff6-4a26-84b6-6108e318e706/content
|
| [14] |
National Institute of Statistics. Enquête sur l'Emploi et le Secteur Informel. 2010.
|
| [15] |
Banque Mondiale. Projet pour le développement de filets de protection sociale adaptative et l’inclusion économique. 2021.
https://documents1.worldbank.org/curated/en/099555001182251592/pdf/CADRE0DE0PLANI0S00CPPA00P1753630010.pdf
|
| [16] |
Orgnanisation Internationale du Travail. Enquête auprès des entreprises informelles du Cameroun. 2017.
https://www.ilo.org/fr/publications/enquete-aupres-des-entreprises-informelles-du-cameroun
|
Cite This Article
-
APA Style
Ze, A., Okouda, B. (2025). Dynamics of Income Inequality in Yaounde and Its Surroundings: An Analysis Based on the Management of the COVID-19 Crisis. Journal of Public Policy and Administration, 9(3), 136-143. https://doi.org/10.11648/j.jppa.20250903.12
 Copy
|
Copy
|
 Download
ACS Style
Ze, A.; Okouda, B. Dynamics of Income Inequality in Yaounde and Its Surroundings: An Analysis Based on the Management of the COVID-19 Crisis. J. Public Policy Adm. 2025, 9(3), 136-143. doi: 10.11648/j.jppa.20250903.12
Copy
|
Download
AMA Style
Ze A, Okouda B. Dynamics of Income Inequality in Yaounde and Its Surroundings: An Analysis Based on the Management of the COVID-19 Crisis. J Public Policy Adm. 2025;9(3):136-143. doi: 10.11648/j.jppa.20250903.12
Copy
|
Download
-
@article{10.11648/j.jppa.20250903.12,
  author = {Albert Ze and Barnabe Okouda},
  title = {Dynamics of Income Inequality in Yaounde and Its Surroundings: An Analysis Based on the Management of the COVID-19 Crisis
},
  journal = {Journal of Public Policy and Administration},
  volume = {9},
  number = {3},
  pages = {136-143},
  doi = {10.11648/j.jppa.20250903.12},
  url = {https://doi.org/10.11648/j.jppa.20250903.12},
  eprint = {https://article.sciencepublishinggroup.com/pdf/10.11648.j.jppa.20250903.12},
  abstract = {In Cameroon, the crisis linked to the COVID-19 pandemic has found a society characterized by income inequalities, the response to which had to be taken into account to enable the country to pursue its objective of the vision towards emergence by 2035. It is in this context that this study aims to evaluate the effects of the measures to manage the COVID-19 crisis on the dynamics of income inequalities in Yaounde - the political capital and second largest metropolis in the country - and its surrounding areas with more than 4 million inhabitants during the period from 2019 to 2022. For this purpose, we use the Income Equality index (ER), which is an innovative indicator that we designed based on the literature. This index measures the perceptible income gaps between individuals. Between 0 and 1, a value that tends towards 1 shows that there is not a considerable gap between individuals' incomes; and a value that tends towards 0 is considered a significant degree of inequality. To assess the effects of the response measures on income inequality, a principal correspondence analysis was conducted. This analysis allowed us to see the similarities between municipalities and the correlations that exist between the different variables. As the data from the latest Cameroon Household Survey (ECAM 5) of the National Institute of Statistics conducted in 2021 have not yet been published for updating, data collection from households was carried out on a sample of 1,000 households spread across 10 municipalities. According to the results, a low dynamic of income inequality was recorded in half of the municipalities in our sample and no effect of crisis management measures was found on these income inequalities.},
 year = {2025}
}
Copy
|
Download
-
TY  - JOUR
T1  - Dynamics of Income Inequality in Yaounde and Its Surroundings: An Analysis Based on the Management of the COVID-19 Crisis

AU  - Albert Ze
AU  - Barnabe Okouda
Y1  - 2025/07/28
PY  - 2025
N1  - https://doi.org/10.11648/j.jppa.20250903.12
DO  - 10.11648/j.jppa.20250903.12
T2  - Journal of Public Policy and Administration
JF  - Journal of Public Policy and Administration
JO  - Journal of Public Policy and Administration
SP  - 136
EP  - 143
PB  - Science Publishing Group
SN  - 2640-2696
UR  - https://doi.org/10.11648/j.jppa.20250903.12
AB  - In Cameroon, the crisis linked to the COVID-19 pandemic has found a society characterized by income inequalities, the response to which had to be taken into account to enable the country to pursue its objective of the vision towards emergence by 2035. It is in this context that this study aims to evaluate the effects of the measures to manage the COVID-19 crisis on the dynamics of income inequalities in Yaounde - the political capital and second largest metropolis in the country - and its surrounding areas with more than 4 million inhabitants during the period from 2019 to 2022. For this purpose, we use the Income Equality index (ER), which is an innovative indicator that we designed based on the literature. This index measures the perceptible income gaps between individuals. Between 0 and 1, a value that tends towards 1 shows that there is not a considerable gap between individuals' incomes; and a value that tends towards 0 is considered a significant degree of inequality. To assess the effects of the response measures on income inequality, a principal correspondence analysis was conducted. This analysis allowed us to see the similarities between municipalities and the correlations that exist between the different variables. As the data from the latest Cameroon Household Survey (ECAM 5) of the National Institute of Statistics conducted in 2021 have not yet been published for updating, data collection from households was carried out on a sample of 1,000 households spread across 10 municipalities. According to the results, a low dynamic of income inequality was recorded in half of the municipalities in our sample and no effect of crisis management measures was found on these income inequalities.
VL  - 9
IS  - 3
ER  -
Copy
|
Download