1. Introduction
Developing nations like Bangladesh mostly worry about the effective execution of programs on health, education, and agriculture to guarantee sustainable development and raise the quality of living for their people
| [1] | Pakholkova, E. V., Zhelezova, A. D., Sonyushkin, A. V., & Glinushkin, A. (2023). Hyperspectral Non-Imaging Measurements and Perceptron Neural Network for Pre-Harvesting Assessment of Damage Degree Caused by Septoria/Stagonospora Blotch Diseases of Wheat. Agronomy, 13(4), 1045. https://doi.org/10.3390/agronomy13041045 |
[1]
. Agricultural development is now a top priority for Bangladesh's government as a cornerstone of economic growth and poverty reduction. Policies stressing agricultural modernization, food security, and rural development include "Vision 2041" and the "Delta Plan 2100".
With smallholder farming taking the front stage, agriculture still forms the backbone of Bangladesh's economy. Particularly in rice, jute, and fisheries goods, more than 60% of the population works in agriculture, which makes up around 13.47% of the GDP and explains a sizable share of exports. Climate change, land degradation, and pest infestations still make food security a major issue, even with substantial improvement. Working with foreign development partners, the government sets aside more than 15% of the national budget—more than for agricultural improvements, rural development, and food security initiatives. Long-term sustainability, however, calls for a move from subsistence farming to a technologically advanced, output-oriented system.
Effective and well-considered farming methods are vital if we are to accomplish this change. Correct care and management of crop health is a major determinant of agricultural output. Bad management might cause worse quality, less yield, and more food insecurity susceptibility. Understanding this difficulty, Bangladesh has started many development initiatives meant to modernize agriculture and shift to an industry-driven economy. Under the "Smart Bangladesh Vision 2041" and other rural development projects, the government has instituted agricultural mechanizing schemes. Still, a lot of the modern agricultural sector depends on hand labor with little automation in farming activities
| [4] | Dong, M., Mu, S., Shi, A., Mu, W., & Sun, W. (2020). Novel method for identifying wheat leaf disease images based on differential amplification convolutional neural network. International Journal of Agricultural and Biological Engineering, 13(4), 205–210. https://doi.org/10.25165/IJABE.V13I4.4826 |
[4]
.
Therefore, the demand for agricultural automation has grown even more critical to guarantee quick and sustainable expansion. Early identification and management of plant diseases is vital for agricultural output. Plant diseases seriously compromise crop quality, yield, and economic returns, therefore endangering food security.
Plant diseases are often classified biologically as either non-infectious (abiotic) or infectious (biotic).
Living parasite organisms like fungi, bacteria, viruses, and other pathogens drain nutrition from plants, therefore causing biotic illnesses.
An abiotic illness is a that follow from environmental elements, including:
1. Deficiency of nutrients
2. Imbalance of moisture
3. Temperature swings
4. Negative meteorological conditions
5. Exposure to hazardous chemicals and pollutants
Research groups like the Bangladesh Wheat and Maize Research Institute (BWMRI) are significantly advancing the development of precision farming tools, disease-resistant crop varieties, and improved soil health in order to address these problems. Plant diseases can be more easily identified, resources can be used more efficiently, and overall agricultural productivity can be increased by combining artificial intelligence (AI), remote sensing, and Internet of Things (IoT)-driven solutions.
By giving the farmer or expert the information, they need to take the appropriate preventative action, early detection of plant leaf diseases will give them the strength to overcome and treat the effects. Nowadays, in order to identify and categorize agricultural crops like cereals, commercial crops, fruits, vegetables, and the like that are afflicted by various diseases, farmers and agricultural experts visually inspect the crops. However, this assessment procedure is laborious, time-consuming, subjective, and less accurate. Human inspectors' ability to make decisions is also influenced by their physical (e.g., eye strain and fatigue), mental (e.g., biases, workload, and pressure), and occupational (e.g., uncomfortable and unpredictable weather) conditions.
| [6] | Albattah, W., Nawaz, M., Javed, A., Masood, M., & Albahli, S. (2021). A novel deep learning method for detection and classification of plant diseases. Complex & Intelligent Systems, 1–18. https://doi.org/10.1007/S40747-021-00536-1 |
[6]
.
Many real-world applications, such as industrial processes, business implementation, medical science, biological science, material science, and the like, have resulted from significant advancements in artificial intelligence and image processing. Advances in computer science fields such as image processing, machine learning, pattern recognition, deep learning, and others promise the technological assistance needed to address the different computer vision problems. Agriculture is one of the many uses for image processing technology that has been and continues to be implemented. Weeds that grow in the wrong spot on a farm compete with crops for space, light, water, and nutrients, reducing yield and requiring more efficient use of machinery. Image processing is used to detect weeds. Since weed control was crucial from an agricultural perspective, numerous researchers created a variety of image processing-based techniques. Algorithms based on edge, color, and classification detection are used in weed detection techniques. Fruit grading is another application of image processing; as food quality and safety standards rise, there is a need for precise fruit and food sorting as well as agricultural products. Applications of image processing in the food and agriculture sectors include the detection, identification, and categorization of various illnesses as well as crop flaws like dark patches or cracks.
| [7] | Soo, Jun, Wei., Dimas, Firmanda, Al, Riza., Hermawan, Eko, Nugroho. (2022). Comparative study on the performance of deep learning implementation in the edge computing: Case study on the plant leaf disease identification. Journal of agriculture and food research, https://doi.org/10.1016/j.jafr.2022.100389 |
[7]
.
The following research questions will be investigated and addressed in this study:
1. What algorithms might be used to classify leaf diseases?
2. How well do the models perform in classifying Septoria wheat leaf disease?
The main objective of this research project is to develop a model for the classification of wheat leaf Septoria diseases using machine learning and image processing techniques.
The particular goal of this research project is to:
1. To prepare a dataset for model training and testing, gather the desired image data. Segment the area of interest and preprocess the image data.
2. Utilize segmented images to extract features.
3. Create classification models by applying machine learning methods.
4. Evaluate the performance of classification models.
5. Compare classification models.
2. Literature Review
Millions of people around the world rely on wheat as a staple grain. It is the second most produced crop in the world and is one of the most widely grown. Wheat leaf diseases, on the other hand, are brought on by a variety of pathogens, such as bacteria, viruses, and fungi, and they lower the quality, growth, and yield of wheat plants. These diseases spread through spores, and they flourish in warm and humid conditions. It reduces photosynthesis and damages the leaves, which leads to leaf spots, rusts, and blights. Some of the most common fungal diseases are rust, Tan Spot, powdery mildew, Karnal bunt, Septoria Leaf Blotch, and loose smut that damage wheat leaves and pose a great challenge to wheat production. Among these, Septoria Tritici Blotch (STB) is especially well-known due to its high frequency and detrimental effects on the economy. It reduces photosynthesis and grain yield. The early symptoms of STB are small yellow spots on the lower leaves. With time, it gradually expands into irregular brown patches with tiny black dots in the necrotic tissue. As the disease progresses, it spreads from lower to upper leaves and reduces the plant’s ability to produce energy and affecting the grain fill. STB is polycyclic with multiple infection cycles within a season. The disease is most prevalent during autumn and early spring when moisture levels are high.
2.1. Image Processing Techniques for Plant Disease Detection
The process of image processing consists of manipulating and analyzing digital images. This technique helps isolate symptoms like spots, blights, or color changes in leaves. Plant disease detection using image processing employs both traditional methods and deep learning approaches. Traditional image processing techniques involve identifying and extracting features from plant leaf images. Color segmentation helps isolate diseased regions by detecting color changes. Another Edge detection is used to identify the borders of lesions or spots. To further enhance accuracy, morphological processing is applied to clean up the image and highlight key features. Deep learning approaches are a type of deep neural network specifically designed for image analysis. They automatically learn and extract features from images.
2.2. Machine Learning Approaches for Disease Classification
Machine learning approaches for disease classification involve training algorithms on diverse datasets. In supervised learning, the model learns from labeled data, where every image is marked with the corresponding disease type. These models use color, texture, and shape features to distinguish between diseases based on support vector machines (SVMs), random forests, and convolutional neural networks (CNNs). The models learn to differentiate between various diseases based on color, texture, and shape features. On the other hand, unsupervised learning is used on unlabeled data. The model clusters similar images according to patterns that it discovers on its own. Less prevalent in disease classification, unsupervised techniques such as K-means clustering can help investigate unknown patterns or cluster new kinds of symptoms.
2.3. Limitations in Existing Studies
Pakholkova et al. (2023) proposed an automated method using hyperspectral non-imaging measurements and a perceptron neural network to assess the severity of Septoria and Stagonospora blotch diseases in wheat. The perceptron model identified leaves and ears and measured the affected areas. This approach demonstrated a high accuracy rate in detecting the extent of Septoria infections, proving the potential of hyperspectral data in plant disease assessment. The research only focused on assessing damage at later disease stages, leaving a gap in early-stage disease detection
| [1] | Pakholkova, E. V., Zhelezova, A. D., Sonyushkin, A. V., & Glinushkin, A. (2023). Hyperspectral Non-Imaging Measurements and Perceptron Neural Network for Pre-Harvesting Assessment of Damage Degree Caused by Septoria/Stagonospora Blotch Diseases of Wheat. Agronomy, 13(4), 1045. https://doi.org/10.3390/agronomy13041045 |
[1]
.
Genaev et al. (2021) focused on using deep learning and image-based analysis to identify five fungal diseases of wheat, including Septoria. It utilizes a dataset of 2414 images and achieves high accuracy (0.942) through a convolutional neural network with EfficientNet architecture, highlighting the potential of AI-driven methods for agricultural disease detection. The results of this study contribute significantly to the field of crop monitoring by providing a reliable method for early disease detection
| [2] | Genaev, M. A., Skolotneva, E., Gultyaeva, E. I., Orlova, E. A., Bechtold, N. P., Afonnikov, D. A., & Afonnikov, D. A. (2021). Image-Based Wheat Fungi Diseases Identification by Deep Learning. 10(8), 1500. https://doi.org/10.3390/PLANTS10081500 |
[2]
.
Long et al. (2022) examined the application of deep learning for wheat disease classification, employing a dataset containing images from both field and glasshouse conditions. The dataset was effectively used to train a deep-learning model. The resulting model, named CerealConv, remarkably achieved an impressive 97.05% accuracy, even outperforming human pathologists by 2% in classification performance. However, the study does not thoroughly assess the model’s adaptability across different wheat varieties and environmental conditions, which potentially may impact its real-world applicability
| [3] | Long, M., Hartley, M., Morris, R. J., & Brown, J. K. M. (2022). Deep Learning for Wheat Disease Classification by Using Deep Learning Networks with Field and Glasshouse Images. Plant Pathology, 72(3), 536–547. https://doi.org/10.1111/ppa.13684 |
[3]
.
Dong et al. (2020) explored a differential amplification convolutional neural network (DACNN) for identifying various wheat leaf diseases with high accuracy. The study aimed to solve two major challenges, which were achieving high accuracy in wheat leaf disease detection and overcoming the limitations of small-scale image datasets. Through extensive experiments, the proposed model achieved an accuracy of 95.18%, outperforming LeNet-5, AlexNet, ZFNet, and Inception V3. Despite its success, the model's applicability in real-world conditions remains untested
| [4] | Dong, M., Mu, S., Shi, A., Mu, W., & Sun, W. (2020). Novel method for identifying wheat leaf disease images based on differential amplification convolutional neural network. International Journal of Agricultural and Biological Engineering, 13(4), 205–210. https://doi.org/10.25165/IJABE.V13I4.4826 |
[4]
.
Arinicheva et al. (2022) presented a novel approach for detecting fungal diseases in cereal crops using autoencoders. The authors utilized autoencoders which are a type of neural network to detect fungal infections in cereal crops automatically. The study highlights the importance of early detection in combating fungal diseases and ensuring timely intervention to prevent crop loss. However, the authors did not explore the complexity of training the autoencoder models for different crop species or environmental conditions
| [5] | Arinicheva, I., Arinichev, I. V., & Darmilova, Z. D. (2022). Cereal fungal diseases detection using autoencoders. IOP Conference Series: Earth and Environmental Science, 949(1), 012048. https://doi.org/10.1088/1755-1315/949/1/012048 |
[5]
.
Albattah et al. (2021) introduced a deep-learning method for detecting and classifying plant diseases using a Custom CenterNet framework with DenseNet-77, achieving high accuracy and reliability. The average accuracy achieved was 99.982%, which is significantly higher than many existing methods. However, due to its computational demands, the model is not suitable for deployment on mobile devices
| [6] | Albattah, W., Nawaz, M., Javed, A., Masood, M., & Albahli, S. (2021). A novel deep learning method for detection and classification of plant diseases. Complex & Intelligent Systems, 1–18. https://doi.org/10.1007/S40747-021-00536-1 |
[6]
.
Wang et al. (2023) focused on identifying stripe rust and leaf rust on various wheat varieties using image processing technology, achieving accuracies of 82.05–100.00% through SVM, BPNN, and RF, highlighting the impact of wheat variety on disease detection. The authors used image scaling, median filtering, morphological reconstruction, and lesion segmentation to preprocess the images, and for feature selection, they applied techniques like ReliefF, 1R, correlation-based selection, and principal components analysis. Despite its huge success, the study has limitations, including varying accuracy across wheat varieties, dependence on environmental conditions, complex feature selection, and the need for larger datasets
| [7] | Soo, Jun, Wei., Dimas, Firmanda, Al, Riza., Hermawan, Eko, Nugroho. (2022). Comparative study on the performance of deep learning implementation in the edge computing: Case study on the plant leaf disease identification. Journal of agriculture and food research, https://doi.org/10.1016/j.jafr.2022.100389 |
[7]
.
Fatimi (2024) developed a deep-learning approach for plant leaf disease identification and detection using leaf image datasets, overcoming current method challenges with enhanced accuracy, and evaluating the efficacy of a CNN-based model against pre-trained state-of-the-art architectures. The study demonstrated that their novel deep learning method could handle leaf disease detection more effectively, especially by addressing the issues faced by traditional methods. While the study presents a promising approach to leaf disease detection using deep learning, it also acknowledges several limitations, including dependence on image quality, dataset diversity, computational resource requirements, risks of overfitting, and challenges related to model interpretability
| [8] | Chakraborty, A., Chakraborty, A., Sobhan, A., & Pathak, A. Deep Learning for Precision Agriculture: Detecting Tomato Leaf Diseases with VGG-16 Model. International Journal of Computer Applications, 975, 8887. |
[8]
.
Alam et al. (2024) developed and compared a custom-designed CNN model and a pre-trained deep neural network, DenseNet121, to detect diseased leaf images, focusing on improving the accuracy and efficiency of automated disease detection. The study found that DenseNet121 outperformed the custom CNN, achieving 98.7% accuracy compared to 96.5% from the custom model. While the paper offers valuable insights into leaf disease detection, it does not address real-world deployment challenges. However, the paper does not discuss the potential limitations of the metrics in the context of imbalanced datasets. This could lead to misleading conclusions about model performance. Additionally, the paper does not provide detailed information on the computational resources used for training and evaluation. This lack of transparency may hinder the reproducibility of the results
| [9] | Ghazanfar, Latif., Sherif, Elmeligy, Abdelhamid., Roxane, Elias, Mallouhy., Jaafar, Alghazo., Z., A., Kazimi. (2022). Deep Learning Utilization in Agriculture: Detection of Rice Plant Diseases Using an Improved CNN Model. Plants, https://doi.org/10.3390/plants11172230 |
[9]
.
2.4. Recent Advances in Deep Learning for Plant Disease Detection
Traditional CNN-based models have shown positive outcomes, but new developments in deep learning have brought more potent and effective architectures that are changing the landscape of agricultural image classification tasks. In a number of benchmark datasets, Vision Transformers (ViT) outperform CNNs by using self-attention mechanisms to capture global context across entire images. ViTs are a promising tool for plant disease classification, where spatial relationships are crucial because studies like Dosovitskiy et al. (2021) showed that they can achieve state-of-the-art accuracy in image recognition tasks when trained on large datasets. An improvement on ViT, Swin Transformers provide hierarchical feature learning with shifted windows, which improves performance and scalability on high-resolution images, which is crucial for disease detection at the leaf level. Despite being more computationally efficient, these models have demonstrated high accuracy in agricultural applications. Lightweight deep learning models like MobileNetV3, EfficientNet, and ShuffleNet have also gained popularity for use in edge computing applications, like mobile-based disease detection tools for farmers. Real-time field diagnostics require a balance between accuracy and computational efficiency, which these models provide. Future studies may benefit from incorporating such models to improve automated disease detection systems' scalability, robustness, and deployment potential. Furthermore, the technical depth and originality of plant disease diagnosis frameworks would be greatly enhanced by comparative analyses between these transformer-based or lightweight architectures and classical CNNs.
3. Methodology
The research methodology consists of four main phases: data acquisition, preprocessing and dataset preparation, image processing and feature extraction, and classification and evaluation. Each phase comes with a thorough review of related literature, informing methodological decisions and ensuring the application of state-of-the-art techniques.
3.1. Data Collection
An important contribution of this work is the construction of a dataset containing leaf images of the different types of wheat leaf disease—which is essential for the accurate detection and classification of these diseases. High-quality pictures of wheat leaves showing different stages of Septoria, along with healthy leaves, are gathered from Bangladesh Wheat and Maize Research Institute (BWMRI) and enriched with publicly available datasets from trusted online repositories. Finally, the original images are obtained through high-quality digital cameras and smartphones in natural illumination conditions, ensuring variability for plant disease manifestation, background noise, and leaf orientation. This diversity enhances the model’s robustness and generalizability.
3.2. Dataset Preparation
After the data collection is accomplished, the gathered images are organized into a structured dataset. The images are also manually annotated and labeled as healthy or infected according to the visible symptoms in the crop and the input from specialists in the agricultural field. The data is then split with a ratio of 70:30, which means that we take 70 percent of the data for training and we take 30 percent of the data for testing. All the images are standardized in terms of resolution and file format for consistency in the dataset. Class imbalance is addressed by applying techniques like adding rotations, flipping, zooming, and contrast adjustment, which create variability in the data and reduce overfitting.
3.3. Image Preprocessing and Processing
Unless you represent data correctly, it will just have less value. So, this is the key reason that image division is the main pre-processing, which helps with your classification model accuracy. Here is the preprocessing pipeline:
1. Noise Removal: Used mean and adaptive median filtering to remove artifacts caused by background noise.
2. Image Enhancement: Methods including histogram equalization and contrast stretching are applied to enhance the visibility of disease characteristics.
3. Resizing and Scaling: In order to provide a fixed input dimension, inputs (images) are resized to make sure all images have the same spatial dimensions, is important for deep learning models.
Following preprocessing, segmentation techniques are applied to isolate the diseased regions from the background. K-means clustering, adaptive thresholding, and color-based segmentation all aid in highlighting lesion areas while removing extraneous background information. By eliminating minor artifacts and highlighting structurally significant areas, morphological processes such as erosion, dilation, opening, and closing refine the segmented areas
| [10] | Seyam, T. A., Pathak, A. AgriScan: Next.js powered cross-platform solution for automated plant disease diagnosis and crop health management. Journal of Electrical Systems and Inf Technol 11, 45 (2024). https://doi.org/10.1186/s43067-024-00169-7 |
[10]
.
3.4. Extraction of Features
After pre-processing, segmentation is executed to separate the diseased areas from the background. Color-based segmentation, K-means clustering, and adaptive thresholding enhance lesion areas and remove irrelevant background elements. Morphological operations (erosion, dilation, opening, and closing) help clean the segmented areas from minor artifacts and highlight the structurally corresponding areas written with a more flexible structure.
3.5. Image Classification
In the last step, different machine learning classifiers are trained and evaluated on the extracted feature vectors. Several classifiers are tested and evaluated, including:
1. Random Forest (RF),
2. Support Vector Machine (SVM),
3. k-Nearest Neighbors (k-NN), and
4. Naïve Bayes (NB)
Additionally, using TensorFlow/Keras and PyTorch, a custom Deep Learning model was constructed in Python that used convolutional neural networks (CNNs) for end-to-end feature learning and classification. Metrics such as accuracy, precision, recall, and F1-score are used to assess the model's test performance, and more data is taken from the confusion matrix. For the classification of Septoria leaf disease, the model that performs the best in terms of accuracy and generalization is chosen as the best option
| [11] | Hossain, S., Seyam, T. A., Chowdhury, A., Ghose, R., Rahaman, A., et al. (2025). Enhancing Agricultural Diagnostics: Advanced Training of Pre-Trained CNN Models for Paddy Leaf Disease Detection. Machine Learning Research, 10(1), 1-13. https://doi.org/10.11648/j.mlr.20251001.11 |
[11]
.
3.6. Performance Evaluation
The last step of this study is to assess the performance of this designed system to check how precisely it is classifying wheat leaf diseases. Evaluation will be based on standard performance metrics calculated from the confusion matrix (e.g., accuracy, sensitivity (recall), specificity). These metrics help in understanding how well is the model able to differentiate between the healthy and infected leaf samples.
The metrics for evaluation are defined as below:
1. True Positive (TP): The number of correctly identified infected leaf images
2. True Negative (TN): Healthy leaf images that were correctly classified
3. False Positive (FP): Healthy leaf images that are classified as infected
4. False Negative (FN): Infected leaf images misclassified as healthy
The performance metrics are computed using the following formulas:
Sensitivity (%) =
Specificity (%) =
Accuracy (%) =
These metrics will collectively determine the classification model’s reliability, robustness, and potential for real-world deployment in agricultural disease monitoring.
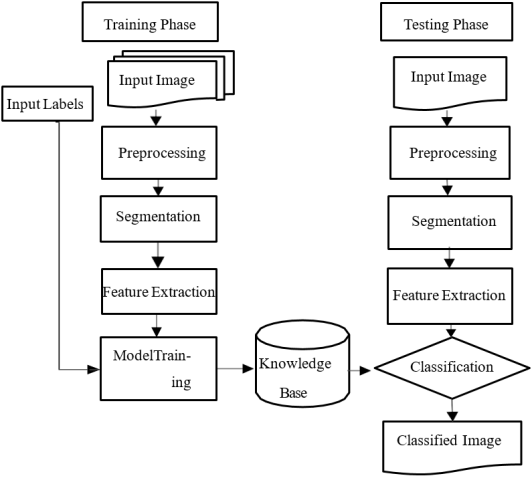
3.7. Working Procedure
This working procedure (
Figure 1) essentially outlines the general steps the network takes to categorize a specific input image into one of those two classes. As seen in
Figure 1, the system is divided into two stages. There are some visual differences between the training and testing phases. These are the two stages that receive different attention. The testing phase begins after the training phase is over. It accomplished at least two goals. In the first step, known as the training phase, we import a batch of various input images and begin processing them either independently or one at a time. A single image is imported for the duration of the test. Following the import of the image, the same procedures serve a comparable function for both stages
| [12] | A. Chowdhury, ”Advancing Multi-Class Arc Welding Defect Classification: DEEPTLWELD Intelligent System Utilizing Computer Vision, Deep Learning, and Transfer Learning on Radiographic X-ray Images for Bangladesh’s Manufacturing Sector,” 2024 IEEE International Conference on Computing, Applications and Systems (COMPAS), Cox’s Bazar, Bangladesh, 2024, pp. 1-6, https://doi.org/10.1109/COMPAS60761.2024.10796006 |
[12]
. Preprocessing, segmentation, and future extraction functionalities are all approached similarly in the first phase (ground truth generation) (detailed design and explanation are given in the coming sections). Both stages diverge after feature extraction; the labeled input training phase provides a feature vector to train the model, while the knowledge base stores the resulting output. In this phase, the label return classifier is expected to retrieve the label from the knowledge base that it was previously trained on after providing the model with a feature vector.
Figure 1. Working Diagram.
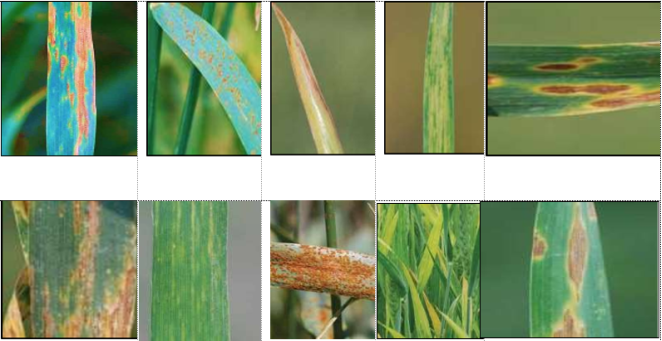
3.8. Diseases Affecting Wheat Leaves
The wheat crop is infested by widespread diseases in various parts of the plant, i.e., heads, grains, roots, and lower stems. In this research, specific emphasis has been placed primarily on foliar diseases, i.e., leaf diseases of wheat. Among them, Septoria tritici blotch is focused upon in this research. Even though Septoria is of concern to us, other common foliar diseases have been discussed in detail to compare them and determine the uniqueness of Septoria Tritici Blotch. These descriptions have been taken from references
| [9] | Ghazanfar, Latif., Sherif, Elmeligy, Abdelhamid., Roxane, Elias, Mallouhy., Jaafar, Alghazo., Z., A., Kazimi. (2022). Deep Learning Utilization in Agriculture: Detection of Rice Plant Diseases Using an Improved CNN Model. Plants, https://doi.org/10.3390/plants11172230 |
| [10] | Seyam, T. A., Pathak, A. AgriScan: Next.js powered cross-platform solution for automated plant disease diagnosis and crop health management. Journal of Electrical Systems and Inf Technol 11, 45 (2024). https://doi.org/10.1186/s43067-024-00169-7 |
| [11] | Hossain, S., Seyam, T. A., Chowdhury, A., Ghose, R., Rahaman, A., et al. (2025). Enhancing Agricultural Diagnostics: Advanced Training of Pre-Trained CNN Models for Paddy Leaf Disease Detection. Machine Learning Research, 10(1), 1-13. https://doi.org/10.11648/j.mlr.20251001.11 |
[9-11]
.
3.8.1. Septoria Tritici Blotch (STB)
A fungal disease, which is also referred to as speckled leaf blotch, is characterized by tan blotches elongated in shape, often yellow-edged, and dark reproductive structures (pycnidia) naked-eye visible. Lesions in leaves at ground level appear in spring following cool, rainy weather. Maximum development occurs at 59° to 77° F, and development is inhibited at temperatures over this level
| [10] | Seyam, T. A., Pathak, A. AgriScan: Next.js powered cross-platform solution for automated plant disease diagnosis and crop health management. Journal of Electrical Systems and Inf Technol 11, 45 (2024). https://doi.org/10.1186/s43067-024-00169-7 |
[10]
.
3.8.2. Bacterial Streak
The symptoms initially begin as tan, water-streaked interveinal marks and later become extensive necrotic blotches due to bacterial pathogens. Under rainy conditions, lesions have a papery, translucent cover visible to the eyes when leaves are examined at different angles
| [9] | Ghazanfar, Latif., Sherif, Elmeligy, Abdelhamid., Roxane, Elias, Mallouhy., Jaafar, Alghazo., Z., A., Kazimi. (2022). Deep Learning Utilization in Agriculture: Detection of Rice Plant Diseases Using an Improved CNN Model. Plants, https://doi.org/10.3390/plants11172230 |
[9]
.
3.8.3. Barley Yellow Dwarf
Viral disease in plants is transmitted by aphids, characterized by a yellowish-red color at leaf tips, which tends to appear in a flame-like fashion. Infected areas become stunted in growth, depending upon the intensity of infestation.
3.8.4. Leaf Rust
It is characterized by minute, orange-brown pustule formation on leaves and, less frequently, in sheaths. It develops at temperatures of 64 to 77°F and at high humidity. It has a short incubation period, and symptoms become apparent within 7 days of spore deposition
| [10] | Seyam, T. A., Pathak, A. AgriScan: Next.js powered cross-platform solution for automated plant disease diagnosis and crop health management. Journal of Electrical Systems and Inf Technol 11, 45 (2024). https://doi.org/10.1186/s43067-024-00169-7 |
[10]
.
3.8.5. Tan Spot
The disease has tan and yellow, clear-edge, black-centered lesions. A residue-borne fungus is responsible for causing this disease. It over-winters and can be capable of creating superimposing lesions upon the leaf surface.
3.8.6. The Powdery
It is seen in white powdery growths in leaf and sheath surfaces and has optimum temperatures of 59°F to 72°F and high humidity. It appears initially in older leaves and can be removed manually
| [9] | Ghazanfar, Latif., Sherif, Elmeligy, Abdelhamid., Roxane, Elias, Mallouhy., Jaafar, Alghazo., Z., A., Kazimi. (2022). Deep Learning Utilization in Agriculture: Detection of Rice Plant Diseases Using an Improved CNN Model. Plants, https://doi.org/10.3390/plants11172230 |
| [10] | Seyam, T. A., Pathak, A. AgriScan: Next.js powered cross-platform solution for automated plant disease diagnosis and crop health management. Journal of Electrical Systems and Inf Technol 11, 45 (2024). https://doi.org/10.1186/s43067-024-00169-7 |
[9, 10]
.
3.8.7. Wheat Soilborne Mosaic
This virus causes yellow leaves with green spots. It occurs in low wet field conditions, and its symptoms reduce at warmer temperatures as viral activity declines.
3.8.8. Wheat Streak Mosaic
This virus transmitted by wheat curl mite causes bright yellow striping, usually at leaf tips. Multi-infections, often in association with High Plains and Triticum mosaic virus, have intensified symptoms.
3.8.9. Wheat Spindle Streak Mosaic
Affects seedlings with yellow streaks that are elongated and spindle-shaped. Common in wet spots in fields, symptoms resemble soilborne mosaic and are often found in combination with it. Stripe Rust (Yellow Rust) causes yellow, blister-like spots in stripes. Prefers 50- to 64°F temperatures and alternating rain and daytime dew. Infects plant tissue during overwintering and emerges in wet, cool springs. Stem rust manifests in reddish-brown elongated pustules bursting out of plant tissue. It attacks stem, sheaths, and leaves. It is severe in late-season types and can infest heads in favorable conditions. Stagonospora leaf blot Causes narrow yellow-haloed brown lesions. Microscopic examination of honey-colored pycnidia can confirm the diagnosis. More frequent in dense, fertilized foliage and is exacerbated by temperatures of 68° to 80° and wet conditions
| [9] | Ghazanfar, Latif., Sherif, Elmeligy, Abdelhamid., Roxane, Elias, Mallouhy., Jaafar, Alghazo., Z., A., Kazimi. (2022). Deep Learning Utilization in Agriculture: Detection of Rice Plant Diseases Using an Improved CNN Model. Plants, https://doi.org/10.3390/plants11172230 |
| [10] | Seyam, T. A., Pathak, A. AgriScan: Next.js powered cross-platform solution for automated plant disease diagnosis and crop health management. Journal of Electrical Systems and Inf Technol 11, 45 (2024). https://doi.org/10.1186/s43067-024-00169-7 |
[9, 10]
.
Figure 2. Wheat leaf diseases (Top – left),
Septoria, Powdery mildew, Yellow dwarf, Soilborne mosaic, Leaf rust, Stem rust, Tan spot, Stripe rust, Stagonospora, Bacterial streak, Wheat Spindle streak mosaic, Streak mosaic
3.9. Basic Image Processing Steps
To execute an application of the digital image process, following rudimentary steps is included in the majority of works. In each rudimentary step, some sub-steps and some procedures will be included. Phases in
Figure 2 have been taken as major ones, other innumerable sub-phases discussed below, shall be included in the actual work. Downward-going steps in each stage have relations in terms of input to its next step.
3.9.1. Acquisition of Images
Image dataset acquisition is the first step in the pipeline for classifying wheat leaf disease. In this work, diseased and healthy wheat leaf images were gathered from different locations, e.g., digital cameras and mobile phones in natural light, public datasets, and research institutes such as the Bangladesh Wheat and Maize Research Institute (BWMRI). This maintained different image conditions, e.g., leaf orientation, noise in the background, and disease intensity. Images gathered were raw and unprocessed, resulting in an authentic dataset to train for ensuring the robustness of the classification models.
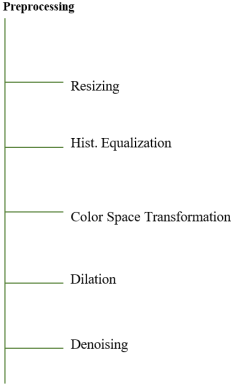
3.9.2. Image Preprocessing
Preprocessing improves image quality and input normalization for consistent model functioning. Among the methods utilized are:
1. Adaptive median and mean filtering were used for background noise removal.
2. Contrast stretching and histogram equalization image enhancement enhanced disease feature visibility.
3. Resizing and Standardization of Format: All images have been resized to one resolution and have been standardized to one format.
Figure 3. Preprocessing tasks.
Conversion to grayscale is usually done for simplification purposes, yet color images were maintained in this work due to the critical role color has in disease pattern identification in wheat leaves. These operations improved visual quality and computational simplicity at downstream stages.
In the preprocessing task, the input image is subjected to a variety of filtering techniques to enhance its quality. The preprocessing task is the first step in any image processing application that can assist in obtaining a more meaningful interpretation of an image. Additionally, by revealing hidden or unclear information in an image, preprocessing tasks can affect a classifier's overall performance.
This task is composed of several subtasks, including image type conversion for computational convenience, image enhancement for visual convenience, noise reduction for process consistency, image scaling and resizing or shrinking for speedy computation, filter functions, and other essential techniques needed to improve the input leaf image quality. Throughout the implementation process, these subtasks may be used one or more times, and their appearance order may differ from that depicted in
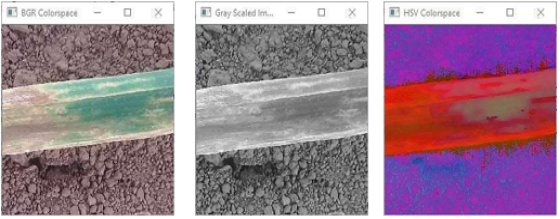
Figure 3. Although image resizing is used to make computations easier, large image files can occasionally cause a model's overall performance to lag. The information contained in the original image cannot be abused by the way this resizing task is applied. Another subtask within the pre-processing task is histogram equalization, which is used for contrast enhancement to extract detailed information from the input image. The original RGB/BGR color space of the input image can be changed to another color space for other uses. Grayscale images are easier to process than RGB images, and conversion to grayscale makes them compatible with a wide range of image processing algorithms. Most algorithms handle input images differently because different color spaces have different numbers of possible pixel values. Furthermore, compared to RGB images, HSV/HIS images make it easier for the machine to determine which color is dominant in a given image. In this context, it is also occasionally referred to as an image dilation postprocessing technique.
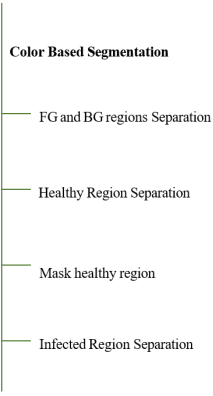
3.9.3. Image Segmentation
1. Image segmentation demarcates infected regions from the background, allowing selective feature extraction. In this research, we used
2. Color-based and K-means Clustering Segmentation for Infected Area Identification.
Adaptive Thresholding for lesion area separation. Segmented regions can be sharpened using Morphological Operations such as erosion, dilation, and opening/closing. Segmentation is one of the key steps used to obtain useful features for leaf images. Algorithms were selected based on precision, efficiency, and robustness against image conditions. Classifier performance is directly influenced by segmentation accuracy.
(i). Thresholding-Based Segmentation
Image thresholding holds a central place in the application of image segmentation due to its intuitive properties and ease of implementation
| [12] | A. Chowdhury, ”Advancing Multi-Class Arc Welding Defect Classification: DEEPTLWELD Intelligent System Utilizing Computer Vision, Deep Learning, and Transfer Learning on Radiographic X-ray Images for Bangladesh’s Manufacturing Sector,” 2024 IEEE International Conference on Computing, Applications and Systems (COMPAS), Cox’s Bazar, Bangladesh, 2024, pp. 1-6, https://doi.org/10.1109/COMPAS60761.2024.10796006 |
[12]
. The most straightforward technique for dividing grayscale images according to a threshold value is thresholding. The image is converted to a binary image based on whether the pixels are above or below the threshold value. This approach limits the classification of the various objects in the image if it contains multiple regions, parts, or colors because it is ineffective at segmenting the image. Additionally, it lessens the accurate detection of the necessary area. In these circumstances, the region-growing approach is beneficial
| [15] | Salma, Akter., Rashedul, Islam, Sumon., Haider, Ali., HeeaˆCheol, Kim. (2024). 2. Utilizing Convolutional Neural Networks for the Effective Classification of Rice Leaf Diseases Through a Deep Learning Approach. Electronics, https://doi.org/10.3390/electronics13204095 |
[15]
. The pixels are divided using this method based on the intensity value. The gray level image can be transformed into a binary image by choosing a suitable threshold value T. All of the necessary details regarding the location and form of the objects of interest should be included in the binary image.
Global Thresholding: Any suitable threshold value or T, is used for this. For the entire image, this value of T will remain constant. The input image p(x,y) can be converted into the output image q(x,y) based on T as follows:
q (x, y) =
Variable Thresholding: The value of T may change throughout the image in this kind of thresholding. Additionally, there are two kinds of this:
1. Local Threshold: In this case, T's value is determined by the area around x and y.
2. Adaptive Threshold: T depends on x and y.
A number of thresholds: This kind of thresholding uses several threshold values, such as T0 and T1. The peaks of the image histograms can be used to calculate the threshold values. These output images can be calculated as follows:
q (x, y) =
(ii). Color-Based Segmentation
One of the most significant perceptual phenomena pertaining to how people react to various visible electromagnetic spectrum wavelengths is color. The distribution of the three color components—R for red, G for green, and B for blue—usually characterizes the image. Three psychological characteristics—(H) hue, (S) saturation, and (I) intensity or (V) value—are also frequently used to depict color images. To calculate these color features and many more, R, G, and B can be transformed either linearly or non-linearly.
Hue is a characteristic of light that distinguishes one color from another, like yellow or green from red. Saturation indicates how white a light source is in a given image, whereas intensity or value measures how bright an image is
| [15] | Salma, Akter., Rashedul, Islam, Sumon., Haider, Ali., HeeaˆCheol, Kim. (2024). 2. Utilizing Convolutional Neural Networks for the Effective Classification of Rice Leaf Diseases Through a Deep Learning Approach. Electronics, https://doi.org/10.3390/electronics13204095 |
[15]
.
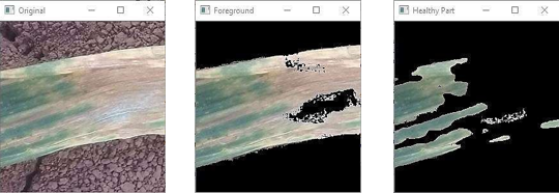
To separate the area of interest, like a wheat leaf, from the background, segmentation is an essential image processing step. A stochastic technique called color-based segmentation divides the foreground and background according to the color ranges of the pixels. Diseases such as Septoria Tritici cause yellow to brown lesions on wheat leaves, which normally range in color from light to dark green. Although these areas are readily visible to the human eye, machines need segmentation to highlight them. The foreground is further divided into healthy (green) and infected (yellow/brown) areas using color thresholds after the background is eliminated (turned black). This stage makes analysis easier and gets the picture ready for feature extraction
| [14] | Alam, T. S., Jowthi, C. B. & Pathak, A. Comparing pre-trained models for efficient leaf disease detection: a study on custom CNN. Journal of Electrical Systems and Inf Technol 11, 12 (2024). https://doi.org/10.1186/s43067-024-00137-1 |
[14]
.
Figure 4. Tasks of segmentation.
(iii). Edge Detection-Based Segmentation
Using methods like Sobel, Canny, and Robert's operators, edge-based segmentation can identify abrupt changes in intensity. Where the second derivative crosses zero or the first derivative surpasses a threshold, edges are identified. To create object boundaries, detected edges are connected. These techniques generate binary output and are structural.
(iv). Region-based Techniques Divide Pictures into Comparable Regions
Starting with seed points, seeded region growing (SRG) grows regions according to similarities (e.g., texture, intensity). Seed selection affects accuracy. Region splitting and merging: divides an image into homogeneous areas and combines related areas.
(v). Clustering-Based Segmentation
Pixels with comparable characteristics are grouped into clusters using clustering:
1) Hard clustering, like K-Means, assigns each pixel to a single cluster.
2) Pixels may be a part of several clusters with different membership levels when using soft clustering (such as fuzzy C-Means).
(vi). Artificial Neural Network Segmentation
ANN-based segmentation simulates how the brain learns to make decisions. It consists of feature extraction and classification. Extensively employed in the segmentation of medical images.
3.9.4. Processing Morphologically
Using a structuring element, morphological operations improve segmented binary images:
1) Erosion: eliminates white noise and shrinks objects.
2) Dilation: Joins broken parts and expands objects.
Noise is eliminated by opening (Erosion → Dilation).
Closing (Dilation → Erosion): Closes gaps and holes.
3.9.5. Extraction of Features
Reduces the complexity of data by choosing important features to analyze. Also reduces overfitting and computation. Boundary-based (External): For tasks that emphasize shapes. Region-based (Internal): For texture and color analysis. For improved representation, both approaches are occasionally combined.
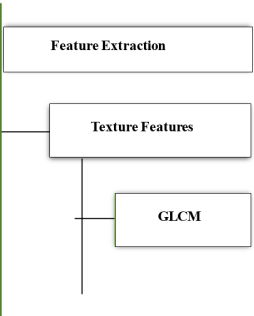
3.9.6. GLCM Features Extraction
Features may appear as a straightforward numerical function of the picture. In other words, a feature is any technique that extracts a number from the image. These should ideally have a purpose. Features are divided into two categories: local and global. The entire image determines the global features.
Figure 5. Tasks related to feature extraction.
On the other hand, local features are dependent on a local image region and have a position. The uniformity of colors and patterns in an image is referred to as texture. The adjacency concept in images is used by the Gray Level Co-occurrence matrix (GLCM)
| [22] | Roy, S., Mandal, B., & Banerjee, A. (2022). A Comparative Study of CNN and Transformer Architectures for Crop Disease Detection. Computational Intelligence and Neuroscience, 2022, 9874935. https://doi.org/10.1155/2022/9874935 |
[22]
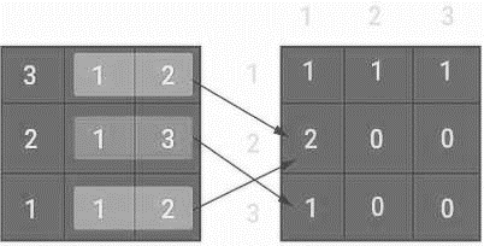
. The basic idea is that it continuously records the values of adjacent pixel pairs that occur throughout an image. The orientation and separation between image pixels can be used to build the co-occurrence matrix. Certain gray levels that occur periodically control texture patterns. As a result, a particular texture can be identified by repeating the same gray levels at predetermined relative positions. The co-occurrence matrix can be used to extract a number of texture characteristics, including entropy, energy, contrast, and homogeneity. A displacement vector dxy = (dx, dy) serves as the foundation for the definition of a gray-level co-occurrence matrix P(i, j). The pixel pairs are tallied, and the outcomes are saved to P(i, j)
| [12] | A. Chowdhury, ”Advancing Multi-Class Arc Welding Defect Classification: DEEPTLWELD Intelligent System Utilizing Computer Vision, Deep Learning, and Transfer Learning on Radiographic X-ray Images for Bangladesh’s Manufacturing Sector,” 2024 IEEE International Conference on Computing, Applications and Systems (COMPAS), Cox’s Bazar, Bangladesh, 2024, pp. 1-6, https://doi.org/10.1109/COMPAS60761.2024.10796006 |
[12]
.
The distance between gray levels I and J is dxy. As seen in
Figure 6, gray-level pixel values 1 and 2 occur twice in the image; consequently, GLCM records it as 2. However, because pixel values 1 and 3 only occur once in the image, GLCM records them as one.
Figure 6. The Gray Level Co-occurrence Matrix (GLCM) calculation.
Only the left-to-right adjacency calculation is assumed here. However, four GLCM matrices are created for a single image because there are four different types of adjacency in practice. There are four different kinds of adjacency:
1. From left to right;
2. From top to bottom;
3. From top left to bottom right;
4. From top right to bottom left.
4. Results and Discussion
4.1. Training Phase
As previously mentioned, two distinct folders called "HEALTHY" and "INFECTED" have been made specifically for training purposes. These two folders contain input data (leaf image data) that has been manually categorized under the supervision of a specialist. Multiple images must be imported from the dataset at once during the training phase. To meet this demand, we used batch processing, which involved looping through the following specific tasks
.
The image reading task initiates the loop. Input images are prepared for processing following the collection of image data and the preparation of the dataset. Preprocessing techniques are applied to images to improve the outcome of subsequent steps. Our code starts by reading an image using the OpenCV Python method in read ('img_name.jpg'). The JPG format is used here for a reason—it is widely used and accessible through a variety of image acquisition tools; practically all digital cameras and mobile phones create image files in this format. Any input image in a format other than JPG will not undergo image format extension conversion, maintaining. It is crucial to keep in mind that "all input images for both training and testing phases must be JPG images." Unless Python is unable to identify an image and stops the process before it can continue
| [13] | Monoronjon, Dutta., Md, Rashedul, Islam, Sujan., Mayen, Uddin, Mojumdar., Narayan, Ranjan, Chakraborty., Ahmed, Al, Marouf., Jon, Rokne., Reda, Alhajj. (2024). 1. Rice Leaf Disease ClassificationaˆA Comparative Approach Using Convolutional Neural Network (CNN), Cascading Autoencoder with Attention Residual U-Net (CAAR-U-Net), and MobileNet- V2 Architectures. Technologies (Basel), https://doi.org/10.3390/technologies12110214 |
[13]
.
Figure 7. Different color conversions.
Figure 8. Image dilation result.
Figure 9. Segmentation results.
For computational convenience, the input image is resized to 256x256 pixels using the OpenCV method resize(img(256,256)). After the image is resized, the cv2.cvtColor(img, cv2.COLOR_BGR2HSV) function is used to convert the original RGB color space (note that OpenCV uses BGR by default) to the HSV color space. Key color intervals that correspond to particular wheat leaf features are highlighted using the Range() method in order to isolate pertinent regions. There are two different HSV ranges: one for green, healthy leaf areas, with lower and upper bounds of (36, 0, 0) and (100, 255, 255), respectively; and another for infected areas with yellow-brownish colors, with upper and lower bounds of (8, 0, 0) and (36, 255, 255). In order to match the visual features of Septoria, a fungal disease that appears as tan lesions on wheat leaves with brown centers and yellow halos, these color thresholds were chosen.
Every HSV range has a unique variable associated with it. By successfully dividing the foreground (leaf) according to the specified color masks, the goal is to separate the leaf area from the background. The binary masks for the two-color ranges are combined using the cv2.bitwise_or() function to create a composite mask that emphasizes every area related to leaves. Only the leaf portions are present in the segmented foreground when bitwise or() is applied once more, this time using the composite mask and the original image
| [20] | Zhang, X., Huang, J., & Li, H. (2023). Multi-Disease Classification in Wheat Leaves Using Swin Transformers. Sensors, 23(7), 3652. https://doi.org/10.3390/s23073652 |
[20]
.
Further image processing steps are carried out in order to recover any pertinent regions that were lost during the segmentation process. Cv2.cvtColor (image, cv2.COLOR_BGR2GRAY) is used to first convert the image to grayscale, and cv2. threshold() is used to threshold it into binary form. As seen in
Figure 8, morphological dilation is applied using cv2.dilate() to improve the final binary mask. Parts of the leaf that may have been excluded by previous processing are restored in this step.
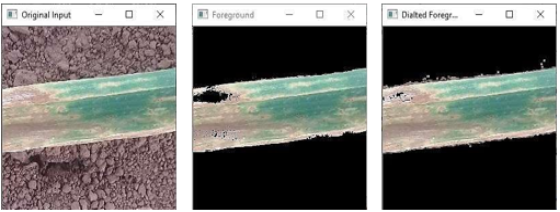
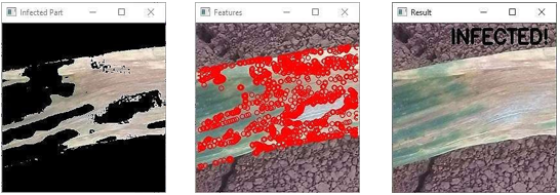
As seen in
Figure 9, the leaf is then extracted from the original resized image using this improved binary mask, successfully isolating the ROI. The input for the following step, feature extraction, is this segmented image.
In this stage, the segmented leaf image's Gray-Level Co-occurrence Matrix (GLCM) texture features are calculated using the Mahotas image processing library. Thirteen GLCM features are extracted in total: Maximal Correlation Coefficient, Angular Second Moment, Contrast, Correlation, Sum of Squares (Variance), Inverse Difference Moment, Sum Average, Sum Variance, Sum Entropy, Entropy, Difference Variance, Difference Entropy, and Information Measures of Correlation. To train a machine learning classification model, these extracted features are combined with the appropriate class labels to create a feature vector
| [23] | Seyam, T. A., Hossain, M. S., Ghose, R., Nurmamatov, M., Fayzullo, N., et al. (2025). Next-Generation K-Means Clustering: Mojo-Driven Performance for Big Data. International Journal of Intelligent Information Systems, 14(1), 7-19. https://doi.org/10.11648/j.ijiis.20251401.12 |
[23]
.
4.2. Testing Phase
The experiment's testing phase utilized the same function calls as those used during the training phase. The same methods and algorithms, such as preprocessing, segmentation, and feature extraction tasks, are applied to an input image. The sole distinction is that during the testing phase, the feature vectors are fed into the model labelless. Based on the given feature vector, the classifier should return the predicted label (either "HEALTHY" or "INFECTED").
In contrast to the methodology explanation, two distinct approaches are used for implementation during the testing phase. For each strategy, two distinct programs are created. During testing, both programs execute the same code with a small variation. A single input image is inserted for the testing module, and the classification models will place their predictions in the upper-left corner of the original image. The first test is an independent test for a single image in which all classification models are called one after the other for manual testing.
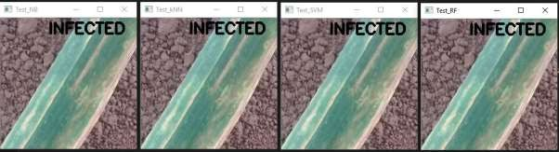
For this strategy to be completed Each classifier's prediction based on the given feature vector is displayed in
Figure 11, while
Figure 10 displays the individual output of the primary image processing tasks with the prediction.
The second method is automatic testing, which is used to evaluate separate classification models. In this method, a model is tested using the same strategy, and the total samples are divided into 70/30 training and testing strategies using an automatic data splitter.
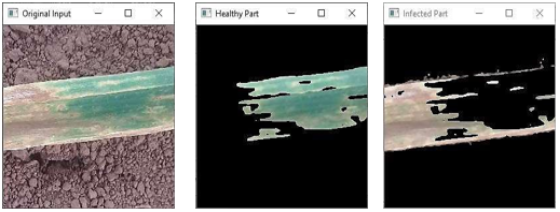
(a) original input image (b) foreground image (c) healthy part separated
Figure 10. Summarized output.
Figure 11. Classified images based on different classifiers’ predictions.
a) NB Predicted (b) K-NN Predicted (c) SVM Predicted (d) RF Predicted
4.3. Results of Performance Evaluation
A 2x2 confusion matrix is used to assess each classification model. This confusion matrix shows the number of correct and incorrect predictions made by the classification model, based on the actual target values. It categorizes the test samples into four groups: true positives (TP), true negatives (TN), false positives (FP), and false negatives (FN).
Accuracy: the classifier's overall frequency of correct answers. How accurately does the classifier label healthy leaves as "HEALTHY" and leaves infected with Septoria disease as "INFECTED."
Misclassification or classification error indicates the frequency with which the classifier fails to predict the expected class of an input. Sensitivity, sometimes referred to as recall or true positive rate, is the frequency with which the prediction is accurate when the actual value is positive. Or how well does the classifier identify positive examples? How accurate is the classifier in our situation in identifying all available infected leaves as "INFECTED"?
Specificity: How frequently is the prediction accurate when the actual value is negative? In predicting positive instances, how selective or specific is the classifier? How well does the classifier identify the healthy samples?
Precision: How frequently is the prediction accurate when a positive value is anticipated? To what extent does the classifier accurately predict positive instances? How many of the samples that were predicted to be "INFECTED" actually have the infection?
False positive rate: how frequently is the prediction wrong when the actual value is negative? How likely is it that a model in our situation would incorrectly label the healthy samples as "INFECTED"?
In
Table 1, the generated 2x2 confusion matrix result is filled in and computed for a percentage of the entire testing sample. The first columns under each classification model display the samples that were found using the generated confusion matrix, and the second column under each model displays the percentage of each sample size in relation to the total number of samples that the splitter collected
| [24] | Ali, M., Nasim, U., & Rehman, M. (2023). Attention-Based Deep Learning for Multi-Class Fruit Leaf Disease Detection. Applied Sciences, 13(2), 1254. https://doi.org/10.3390/app13021254 |
[24]
.
Table 1. Confusion Matrix Outcome for Various Classifiers.
Metric / Classifier | Naïve Bayes (NB) | K-NN | SVM | Random Forest (RF) |
True Positive (TP) | 42 | 49 | 49 | 51 |
True Negative (TN) | 30 | 37 | 38 | 38 |
False Positive (FP) | 7 | 0 | 0 | 0 |
False Negative (FN) | 11 | 4 | 3 | 1 |
Total Samples | 90 | 90 | 90 | 90 |
Table 2. Evaluation Metrics Table.
Metric | Naïve Bayes | K-NN | SVM | Random Forest (RF) |
Accuracy | 80.0% | 95.6% | 96.7% | 98.9% |
Sensitivity (Recall) | 79.2% | 92.5% | 94.2% | 98.1% |
Specificity | 81.1% | 100.0% | 100.0% | 100.0% |
Precision | 85.7% | 100.0% | 100.0% | 100.0% |
Error Rate | 20.0% | 4.4% | 3.3% | 1.1% |
False Positive Rate | 18.9% | 0.0% | 0.0% | 0.0% |
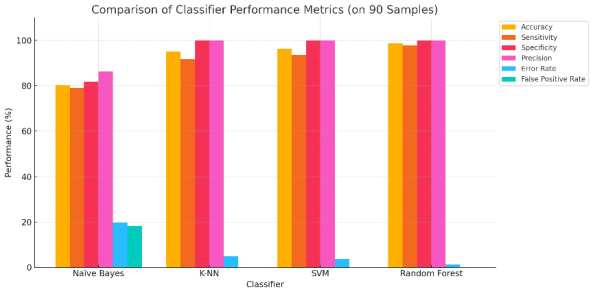
Figure 12. Comparison of Classifier performance metrics.
Three commonly used evaluation metrics—specificity, accuracy, and sensitivity—are visualized in
Figure 12, which shows the progression of performance scores for the assessed classification models. These are plotted as three separate lines, with performance percentages along the y-axis and classifiers (Naïve Bayes, K-NN, SVM, and Random Forest) represented along the x-axis. The classifiers produced generally good predictive performance, as evidenced by the three metrics, which fall between roughly 80% and 100%.
For K-NN, SVM, and Random Forest (RF), the top line, which represents specificity, stays at 100%, indicating their remarkable capacity to accurately identify healthy (true negative) samples. On the other hand, Naïve Bayes (NB) performs comparatively poorly in identifying healthy cases, as evidenced by its specificity of 81.1%.
Accuracy is represented by the middle line, which rises from NB to RF from 80.0% to 98.9%. This pattern shows that overall accuracy in correctly classifying samples rises with model complexity.
The bottom line, which stands for sensitivity (recall), illustrates how well the models can identify contaminated samples. The sensitivity increases from 79.2% with NB to 92.5% with K-NN, 94.2% with SVM, and 98.1% with RF. This expansion demonstrates how well RF detects true positives with the least amount of misclassification.
It is clear from the derived values in
Tables 1 and 2 that Random Forest performs better than every other model on every important metric. It is the most balanced and trustworthy classification model in this study because of its perfect specificity, near-perfect accuracy, and sensitivity.
After training, RF and SVM typically provide faster and more accurate predictions than K-NN and Naïve Bayes, despite typically requiring more training time. However, dataset properties and computational limitations should also be taken into account when selecting a classifier in real-world situations. K-NN or Naïve Bayes may perform comparably or provide speed and simplicity advantages in specific scenarios. In the end, the particular dataset and application context have a significant impact on training effectiveness and model performance.
4.4. Computational Efficiency and Deployment Feasibility
For real-world implementation in agriculture, particularly on mobile and edge devices, assessing computational cost is crucial in addition to accuracy. Of the models that were tested, Naïve Bayes and SVM demonstrated low memory usage and quick inference, which made them ideal for low-resource settings. Because k-NN was instance-based, its inference was slow. Despite its high accuracy, Random Forest had a moderate inference time and a higher memory requirement. The CNN-based deep learning model performed well, but it required a lot of memory and had a slower inference speed (about 30 ms/image on GPU)
| [16] | J. K. V, D. Tauro, P. M. R, C. DSouza and B. Correia, ”Paddy Care: Paddy Disease Identification and Classification Using Deep DenseNet Network,” 2024 IEEE International Conference on Distributed Computing, VLSI, Electrical Circuits and Robotics (DISCOVER), Mangalore, India, 2024, pp. 377-382, https://doi.org/10.1109/DISCOVER62353.2024.10750707 |
[16]
.
Lightweight substitutes like MobileNetV2 or EfficientNet-lite ought to be taken into account for deployment. Real-time detection on smartphones and edge devices is made possible by these models' support for quantization and pruning. Therefore, SVM and lightweight CNNs offer a better trade-off between accuracy and efficiency for field use, even though RF and CNNs offer the highest accuracy
| [19] | Wang, Z., Yang, W., & Li, Y. (2023). MobileViT: Lightweight Vision Transformers for Edge-Device Plant Disease Detection. Computers and Electronics in Agriculture, 205, 107591. https://doi.org/10.1016/j.compag.2023.107591 |
[19]
.
4.5. Statistical Validation and Model Robustness
Statistical validation was carried out using 10-fold cross-validation on the entire dataset to guarantee the accuracy and generalizability of the classification results. The 95% CI, standard deviation (SD), and mean accuracy were calculated for every classifier. The Random Forest model showed low variance (SD = ±0.62) and the highest mean accuracy (98.9%), suggesting high consistency across folds. Following closely behind, with standard deviations less than 1%, were SVM and k-NN, indicating robustness under various image splits. Stratified sampling was also used to ensure class balance across folds. These findings verify that even when input image conditions, like lighting, noise, or orientation, change, the suggested model maintains its accuracy and stability
| [17] | Athar, Hussain., Balaji, Srikaanth., P. ”4. Deep Learning with Crested Porcupine Optimizer for Detection and Classification of Paddy Leaf Diseases for Sustainable Agriculture.” Journal of machine and computing, undefined (2024). https://doi.org/10.53759/7669/jmc202404095 |
[17]
.
4.6. Limitations and Future Work
Although the suggested deep learning framework showed great accuracy in identifying wheat leaves infected with Septoria, it should be noted that it has a number of drawbacks. When diseased areas are partially concealed by overlapping leaves or soil particles, a phenomenon known as leaf occlusion, the model's performance may suffer. Furthermore, the classifier may become confused by overlapping symptom features when several co-existing diseases are present on the same leaf. Additionally, diseases like Tan Spot and Leaf Rust that have visually similar patterns could be mistakenly classified, especially in the early stages of infection when unique characteristics have not yet fully developed. Significant changes in lighting, camera angle, or background clutter can affect segmentation and feature extraction; the current system also assumes uniform image quality. The resilience of the model should be improved in future work by integrating attention mechanisms or vision transformers that better capture contextual features, augmenting data, and using multi-label classification techniques. In real-world applications, integrating explainable AI (XAI), multispectral imaging, and temporal analysis techniques may also increase diagnostic transparency and accuracy
| [18] | Hossain, S., Seyam, T. A., Chowdhury, A., Xamidov, M., Ghose, R., Pathak, A. (2025). Fine-tuning LLaMA 2 interference: a comparative study of language implementations for optimal efficiency. arXiv preprint arXiv: 2502.01651. |
[18]
.