Well logs and data are integrated in most reservoir exploration to provide a reservoir description, the depth and width of the holding subsurface structure are two reservoir parameters that must be understood in order to quantify viable hydrocarbon reservoirs, these metrics are important because they offer suitable contributions for measuring reservoir volume, the objective is to cross-plot well logs with seismic amplitude to provide reservoir characteristics, map reservoir pay zones and determine reservoir depth and thickness, the method applied in this research were collection of set of data consisting of ten wells information cutting across the Agbada formation and 3D post-stack seismic data acquired from the Niger Delta, set of well log suites and software (Word, Excel and Petrel 2014 version) used for analysis, the result analyzed after various cross plots comparing the amplitudes with well logs reveals several trends were discovered, this indicates that higher amplitudes correspond to higher concentrations of hydrocarbons or water based on peak amplitude versus neutron log cross-plot for well KR-1. This study examines the relationship between well logs and amplitude peaks with troughs, as well as potential changes in log signal resulting from variations in seismic amplitude when assessing reservoir sand.
This is an Open Access article, distributed under the terms of the Creative Commons Attribution 4.0 International License (http://creativecommons.org/licenses/by/4.0/), which permits unrestricted use, distribution and reproduction in any medium or format, provided the original work is properly cited.
Seismic Data, Well Logs, Amplitude Peaks, Reservoir Sand, Hydrocarbon
1. Introduction
Well logging (E-line logging) are used to quantify the sand layers' thickness and petrophysical properties to determine the degree to which the sand is hydrocarbon- or brine-bearing
[1]
Ganssle G., (2012). Calculation of a Synthetic Gather using the Aki-Richards Approximation to the Zoeppritz Equations. University of New Orleans Theses and Dissertations. 1566.
. This is the most crucial step in the exploration and development phase of any potential oilfield and is what we refer to as reservoir characterization
[2]
Richardson, A. A. M. (2013). Well Correlation and Petrophysical Analysis, a Case Study of "Rickie" Field Onshore Niger Delta. The International Journal of Engineering and Science, 2319–1813. Retrieved from www.theijes.com.
. Numerous techniques, including volumetrics, petrophysics, inversions, and cross-plots, can be used to characterize reservoirs. Reserving a reservoir using seismic interpretation, which includes fault characteristics, maps, and horizon picking, is a further method
[3]
Anyiam, O. A., Andrew, P. J., & Okwara, I. C. (2017). Assessment of the heterogeneity and petrophysical evaluation of reservoirs in the “Akbar Field”, Niger Delta, Nigeria. Journal of Petroleum Exploration and Production Technology, 7(4), 1035–1050.
. Characterizing hydrocarbon-bearing reservoirs' prospects in order to determine their economic value or precisely identifying and quantifying their properties are difficult tasks for the oil and gas sector
[4]
Edigbue, P. I., Komolafe, A. A., Adesida, A. A., & Itamuko, O. J. (2014). Hydrocarbon reservoir characterization of “Keke” field, Niger Delta using 3 seismic and petrophysical data. (May), 73–80.
. By using or integrating all available data and applying these data accurately when interpreting subsurface geophysical maps is one of the most important tools for developing proven hydrocarbon reserves and discovering undiscovered hydrocarbons
[5]
Harilal S. K. B. (2010). Pitfalls in seismic amplitude interpretation: lessons from Oligocene channel sandstones. Lead Edge 29(4): 384–390.
[5]
. Reserves are the amounts of petroleum that are anticipated to be economically extracted from known accumulations
[6]
Meunier, J. (2011). Distinguished Instructor Short Course. “Seismic Acquisition from Yesterday to Tomorrow”. Distinguished Instructor Series, No. 14: Society of Exploration Geophysicists.
[6]
.
Seismic reflection offers a clearer, more detailed image of the underlying geological structures
[7]
Okoch O. O, & Atakpo E. (2017). Effect of hydrocarbon production on reflection amplitude properties of reservoirs—a case of Kov Field, Niger Delta, Nigeria. Arab J Geosci 10: 380.
. Though it is also helpful for identifying and describing specific kinds of stratigraphic features, thus, it works best in regions where the petroleum is in structural stability traps
[8]
Knut, B (2010). Petroleum Geoscience: From Sedimentary Environments to Rock Physics. Springer, New York.
. From the middle of the 20th century to the present, the seismic manifestation exploration method has undergone multiple stages of development, including field investigations, data processing, and characterization
[9]
Islam, A. R. M. (2013). Interpretation of wireline log data for reservoir characterization of the Rashidpur Gas Field, Bengal Basin, Bangladesh. IOSR Journal of Applied Geology and Geophysics, 1(4), 47–54.
. Reflection techniques are useful for identifying and mapping features like reefs, salt domes, anticlines, and faults—many of which are connected to the buildup of gas and oil
[10]
Mohamed I. Abdel-Fattah, Farouk I. Metwalli, & El Sayed I. Mesilhi, (2017). Static reservoir modeling of the Bahariya reservoirs for the Oilfields development in South Umbarka area, Western Desert, Egypt, Journal of African Earth Sciences.
. Although significant convergences brought about by depositional diminution can be found, the method's resolution is not always optimal for locating stratigraphic captures
[10]
Mohamed I. Abdel-Fattah, Farouk I. Metwalli, & El Sayed I. Mesilhi, (2017). Static reservoir modeling of the Bahariya reservoirs for the Oilfields development in South Umbarka area, Western Desert, Egypt, Journal of African Earth Sciences.
. Due to the recent transition from investigation to the exploitation of already-existing fields—which has seen a high number of wells penetrate them—this has grown in importance and success. The contrast in rock properties between sand and shale depends on a number of variables, including porosity, compaction, depth of burial, and lithological composition
[11]
Ahmad M. N, & Rowell P. (2012). Application of spectral decomposition and seismic attributes to understand the structure and distribution of sand reservoirs within tertiary rift basins of Gulf of Thailand. Lead Edge 31: 630–634.
[11]
. The relative toughness of the sandy material to the covering shales determines whether the amplitude response is positive, negative, or insignificant. The amplitude may vary laterally due to permeability variation or modifications to the reservoir's condition by as much as 10–20% if we have a large reservoir sand, possibly a sheet flood, underneath a shale. These amplitude variations may be comprehensible in terms of feature changes
[12]
Chaki, S., Routray, A., & Mohanty, W. K. (2018). Well-Log and Seismic Data Integration for Reservoir Characterization: A Signal Processing and Machine-Learning Perspective. IEEE Signal Processing Magazine, 35(2), 72–81.
The traditional nature of seismic wave behavior is usually in a sinusoidal form. A wave's amplitude is its departure from the threshold of zero (Figure 1). The greatest positive amplitude is called the peak, and the highest negative intensity is called the trough
[13]
Munyithya, J. M., Ehirim, C. N., Dagogo, T. & Korowe M. O., (2020). Seismic amplitudes and spectral attribute analysis in reservoir characterisation, ‘MUN’ onshore Niger delta field. J Petrol Explor Prod Technol 10, 2257–2267.
. At a given depth, the amplitude matched the value of the seismic trace. A lot of pieces of information are hidden inside seismic amplitudes and it is an excellent way to characterize a reservoir
[14]
Alcalde, J., Marzán, I., Saura, E., Martí, D., Ayarza, P., Juhlin, C., Perez-Estaun, A., & Carbonell, R. (2014.). 3D geological characterization of the Hontomín CO2 storage site, Spain: Multidisciplinary approach from seismic, well-log and regional data, Tectonophysics, 627, 6–25.
[14]
. Geoscientists have consistently aimed to integrate seismic and well-log data
[15]
Amigun, J. O., & Odole O. A. (2013). Petrophysical Properties Evaluation for Reservoir Characterisation of SEYI Oil Field (Niger-Delta). International Journal of Innovation and Applied Studies, 3(3), 765–773.
[15]
.
2.1. Aim and Objectives of the Study
The aim of this research is to analyze and compare properties of well log data to seismic amplitudes in order to provide more reliable data for reservoir characterization. The objective is to use well log data to determine the lithology and thickness of rock strata, identify and map reservoir sand zones, to interpret faults and sealing systems using seismic data, to generate amplitude maps and model basic reservoir facies, and to cross-plot well logs with seismic amplitude to provide attributes of the reservoir.
Munyithya, J. M., Ehirim, C. N., Dagogo, T. & Korowe M. O., (2020). Seismic amplitudes and spectral attribute analysis in reservoir characterisation, ‘MUN’ onshore Niger delta field. J Petrol Explor Prod Technol 10, 2257–2267.
The information obtained from this study can be utilized to improve reservoir feature research, which will aid in well management and reservoir monitoring. Additionally, by reducing the effects of temperature variations, pore fluid concentration variations, and lithology contrast, this study will aid in the elimination of false log responses.
3. Methodology
The research methodology used in this study consists of three discrete portions. Petrophysical analysis, sometimes referred to as qualitative well-log analysis, is covered in part one. The primary goals of the qualitative investigation are to determine the top and base of the reservoir and to define its lithology. Seismic interpretation—which includes facie modeling—is the subject of the second part of the study. Cross-plots of basic well logs vs amplitude for reservoir characterization make up the third component of this research investigation.
The 3D post-stack seismic volume and well data collected from the Niger Delta were the sources of the data used in this study, which were provided by Total Energies EP Nigeria Limited. A division of Total Energies France, an integrated energy business with its main office in Courbevoie, France, close to Paris, is Total Energies EP Nigeria Limited, or TEPNG. Incomplete information is present in four (4) of the ten (10) wells in the data set that straddle the Agbada formation and are necessary for this investigation. The logs for resistivity (RES), density (DEN), porosity (POR), neutron (NEU), and gamma ray (GR) are included in the well log suites.
There are 110 and 800 X-lines (crosslines) and in-lines between 100 and 1600 that make up the seismic volume. Then, certain programs are employed, including Word, Excel, and the Petrel 2014 edition. Seismic data in 2D, 3D, and 4D may be seen, analyzed, and interpreted using Petrel, an open-source seismic determination system licensed by Schlumberger. It is also extensively utilized for the analysis of Geo-Radar data. Petrel supports all the features one would anticipate in a seismic interpretation system, such as cross-plots, log viewers, well-tie modules, Time-Depth Conversion, 3D bodies, mapping (via GMT), modeling, and more. Further supported are fault interpretation (sticks and planes) and horizon trackers (auto-tracking, manual, gridding, etc.).
3.1. Quantitative Well Log Analysis
In order to effectively compute the reservoir parameters for decision making, the volume of shale (Vsh) and the Gamma Ray Index (IGR) has to be considered.
3.1.1. Density Log
The density log calculates the bulk density of the formation by subjecting a formation to a radioactive source and counting the gamma rays that remain after Compton Spreading and photoelectric absorption
[16]
Amigun, J. O., Olisa, B., & Fadeyi, O. O. (2012). Petrophysical analysis of well logs for reservoir evaluation: A case study of ‘Laja’ Oil Field, Niger Delta. Journal of Petroleum and Gas Exploration Research, 2(10), 181–187.
[16]
. The permeability of a logged interval can be ascertained with the help of the formation density log. Porosity is determined by:
(1)
Porosity is represented by ϕ, bulk, fluid, and rock matrix densities by ρ_ma, ρ_b, and ρ_f. Compton scattering is used in density logs to calculate bulk density. A gamma ray photon transfers some of its energy to an electron in an atom's inner orbital through a process known as Compton scattering
[9]
Islam, A. R. M. (2013). Interpretation of wireline log data for reservoir characterization of the Rashidpur Gas Field, Bengal Basin, Bangladesh. IOSR Journal of Applied Geology and Geophysics, 1(4), 47–54.
. The density log uses the detection of Compton-scattered gamma rays to calculate the electron density. The intensity of scattered gamma rays is proportional to electron density
[17]
Macrae, E. J., Bond, C. E., Shipton, Z. K., and Lunn, R. J. (2016). Increasing the quality of seismic interpretation, Interpretation, 4, T395–T402.
[17]
.
3.1.2. Volume of Shale (Vsh)
The dominant lithology and implicit amount of shale are ascertained using the Gamma Ray Index
[18]
Niranjan, N. C., (2016). Chapter 2 Seismic Reflection principles: Basics, Seismic Data Interpretation and Evaluation for Hydrocarbon Exploration and Production: A Practitioner's Guide, Springer, 19–35.
[18]
. This is accomplished by analysing gamma ray logs to identify clean shale and sand lines. The first step in evaluating the petrophysical characteristics of a reservoir rock is to calculate the gamma ray index
[19]
Obiora, D. N., Gbenga, D., & Ogobiri, G. (2016). Reservoir characterization and formation evaluation of a “Royal onshore field”, Southern Niger Delta using geophysical well log data. Journal of the Geological Society of India, 87(5), 591–600.
Where: = index for the Gamma ray. = reading from the formation by the Gamma ray. = Minimum reading of Gamma ray (Sand baseline). = Maximum reading of the Gamma ray (Shale baseline).
The values from the gamma ray index served as an input data in determining actual of shale in the holding sand and it is given as:
(3)
Where: Volume of Shale. = Gamma ray Index.
3.2. Software
The software used were Word, Excel and Petrel 2014 version. Petrel is an open-source seismic determination system that is licenced from Schlumberger and it’s used to visualise, analyse, and interpret 2D, 3D, and 4D seismic data.
4. Results and Discussion
The results analyzed shows that the Agbada formation has an extreme amplitude horizon based on seismic data from KR Field in the South-South Niger Delta whose reservoir's top was reached by each well that was interpreted.
4.1. Evaluation of Reservoir Properties
4.1.1. Quantitative Interpretation
Reservoir parameters can be calculated to help determine whether or not a reservoir can be exploited
[20]
Saltus, R. W. & Blakely, R. J. (2011). Unique geologic insights from “non-unique” gravity and magnetic interpretation, GSA Today, 21, 4–11.
[20]
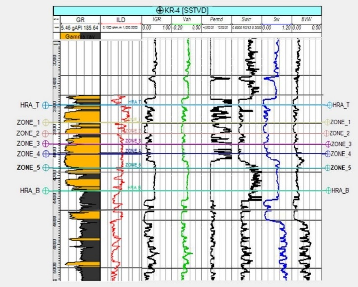
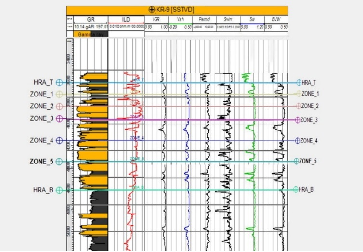
. Equations (1) and (2) were utilised to compute reservoir parameters, including the volume of shale (Vsh) and the Gamma Ray Index (IGR). Figures 2-7 shows the Petrophysical analysis log responses resulting from the calculations across all sand units in all the wells of KR field; where Depth is in Track 1, Track 2 contains the gamma ray log, Track 3 the resistivity log, Track 4 the gamma ray index, and Track 5 the volume of shale. These sands are of good facies, according to the findings from the petrophysical parameters across all delineated sand zones, which are compiled in table 1. The calculated volumes of shale for the reservoir zones in the KR-1 well are 0.15, 0.21, 0.14, 0.21, and 0.13 v/v, respectively. These values fall within the acceptable ranges for high-quality reservoirs. The volumes of shale for KR-2 are 0.17, 0.12, 0.13, 0.22, and 0.21 v/v (12–22%) for each zone, respectively. These values fall within the appropriate ranges for high-quality reservoirs. All of the mapped zones for KR-3 have volume of shale values of 0.33, 0.15, 0.17, 0.15, and 0.17v/v (15–33%), respectively, which is within allowable bounds for high reservoir quality. For KR-4, the volume of shale value in all mapped zones are 0.12, 0.12, 0.13, 0.14, and 0.15 v/v (12–15%) respectively. For KR-7, the volume of shale values in all mapped zones are 0.27, 0.53, 0.17, 0.10, and 0.65 v/v (10–53%) respectively. For KR-9, the volume of shale value in all mapped zones are 0.12, 0.50, 0.12, 0.14, and 0.13v/v (12–50%) respectively, which is within fair reservoir quality.
Table 1. Tabulated Petrophysical Parameters for KR wells of KR field.
Figure 7. Petrophysical property log responses for KR-9.
4.1.2. Fault Interpretation
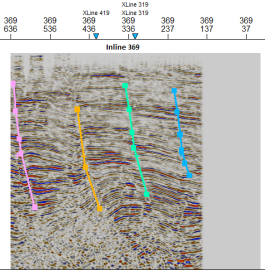
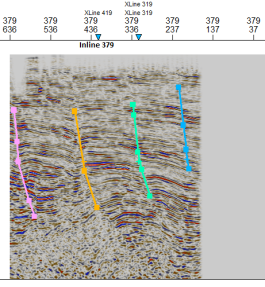
The seismic volume shows heavily fault lines both at the horizons and slices. The structural framework was completed by selecting specific fault segments on seismic inline sections, with the corresponding cross lines displaying the trace. These faults are shown on the seismic sections as either an amplitude distortion surrounding the fault zones or as a discontinuous reflection with a preferred reflector orientation.
Four faults (designated as KR-F1, KR-F2, KR-F3, and KR-F4) that were found at various inlines and cross-lines (figures 8a and b) are shown in Table 2. As referred to as major regional growth faults, they are four large regional growth faults that run the length of the field. Across the field, KR-F1, KR-F2, KR-F3, and KR-F4 (Figures 9 and 10) were found and correlated to form the boundaries to the east-west and north-south directions. While KR-F2 is dipping south from the north, the three main regional faults, KR-F1, KR-F2, and KR-F4, are dipping eastward away from the direction of sediment supply. Crested faults dipping southward the significant trapping fault KR-F3 is in charge of retaining any potential hydrocarbon in wells.
4.2. Comparing Log Property to Seismic Amplitude Analysis
The seismic signal amplitude serves as the foundation for the computation of the amplitude attribute utilised in this work. One post-stack attribute called RMS (root mean square amplitude) calculates the square root of the sum of squared amplitudes divided by the number of samples in the window that was used. This root mean square amplitude can be used to map direct zones of interest by measuring reflectivity.
A rock layer's thickness and the matching peak frequency of its seismic reflection are inversely correlated. In other words, at higher frequencies, thinner rock layers are much more visible, and at lower frequencies, thicker rock layers are much more visible. This can be applied to qualitatively detect a rock unit's thinning or thickening in various directions. A peak and trough from the Agbada formation shale were selected and mapped after the field configuration was known. After that, every tenth inline and cross line was selected to interpolate the horizon over the whole 3D image. The selected peak and trough for the seismic session are displayed in Figure 11.
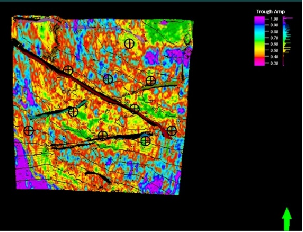
Figure 12 and Figure 13 show the Amplitude maps for Peak and Trough respectively. The amplitude values for the peak Amplitudes ranges from 10 to 100 while the Amplitude map for the Trough Amplitudes ranges from – 100 to 30.
5. Conclusions
Accurate evaluation of the formation is essential to assess the economic viability of the reservoirs in the Niger Delta Oilfield. Thus, res ervoir characterization has taken diverse forms and shapes and each result has proven to be very effective. In this research, findings shows that a lot of pieces of information can be extracted from reflection amplitudes combined with well logs for reservoir characterization. However, it is recommended that water saturation estimations and production data should be included in future work.
Abbreviations
OML: Oil Mining Lease
GR: Gamma Ray Log
RES: Resistivity
POR (Ø): Porosity
NEU: Neutron
DEN: Density Logs
KR: Oil Field or Well
Þ: Density
ma: Density of Rock Matrix
IGR: Index for the Gamma Ray
GRlog: Reading from the Formation by the Gamma Ray
GRmin: Minimum Reading of GAMMA ray (Sand Baseline)
GRmax: Maximum Reading of the Gamma Ray (Shale Baseline)
Vsh: Volume of Shale
IGR: Gamma Ray Index
Acknowledgments
I would like to express my profound gratitude to all the instructors and students of Niger Delta University's geology department for their unwavering encouragement and support during this program.
Author Contributions
Elvis Ogede Adimie: Conceptualization, Resources, Data curation, Software, Formal Analysis, Funding acquisition, Investigation, Visualization, Methodology, Writing – original draft, Project administration, Writing – review & editing
Ganssle G., (2012). Calculation of a Synthetic Gather using the Aki-Richards Approximation to the Zoeppritz Equations. University of New Orleans Theses and Dissertations. 1566.
Richardson, A. A. M. (2013). Well Correlation and Petrophysical Analysis, a Case Study of "Rickie" Field Onshore Niger Delta. The International Journal of Engineering and Science, 2319–1813. Retrieved from www.theijes.com.
Anyiam, O. A., Andrew, P. J., & Okwara, I. C. (2017). Assessment of the heterogeneity and petrophysical evaluation of reservoirs in the “Akbar Field”, Niger Delta, Nigeria. Journal of Petroleum Exploration and Production Technology, 7(4), 1035–1050.
Edigbue, P. I., Komolafe, A. A., Adesida, A. A., & Itamuko, O. J. (2014). Hydrocarbon reservoir characterization of “Keke” field, Niger Delta using 3 seismic and petrophysical data. (May), 73–80.
Harilal S. K. B. (2010). Pitfalls in seismic amplitude interpretation: lessons from Oligocene channel sandstones. Lead Edge 29(4): 384–390.
[6]
Meunier, J. (2011). Distinguished Instructor Short Course. “Seismic Acquisition from Yesterday to Tomorrow”. Distinguished Instructor Series, No. 14: Society of Exploration Geophysicists.
[7]
Okoch O. O, & Atakpo E. (2017). Effect of hydrocarbon production on reflection amplitude properties of reservoirs—a case of Kov Field, Niger Delta, Nigeria. Arab J Geosci 10: 380.
Islam, A. R. M. (2013). Interpretation of wireline log data for reservoir characterization of the Rashidpur Gas Field, Bengal Basin, Bangladesh. IOSR Journal of Applied Geology and Geophysics, 1(4), 47–54.
Mohamed I. Abdel-Fattah, Farouk I. Metwalli, & El Sayed I. Mesilhi, (2017). Static reservoir modeling of the Bahariya reservoirs for the Oilfields development in South Umbarka area, Western Desert, Egypt, Journal of African Earth Sciences.
Ahmad M. N, & Rowell P. (2012). Application of spectral decomposition and seismic attributes to understand the structure and distribution of sand reservoirs within tertiary rift basins of Gulf of Thailand. Lead Edge 31: 630–634.
[12]
Chaki, S., Routray, A., & Mohanty, W. K. (2018). Well-Log and Seismic Data Integration for Reservoir Characterization: A Signal Processing and Machine-Learning Perspective. IEEE Signal Processing Magazine, 35(2), 72–81.
Munyithya, J. M., Ehirim, C. N., Dagogo, T. & Korowe M. O., (2020). Seismic amplitudes and spectral attribute analysis in reservoir characterisation, ‘MUN’ onshore Niger delta field. J Petrol Explor Prod Technol 10, 2257–2267.
Alcalde, J., Marzán, I., Saura, E., Martí, D., Ayarza, P., Juhlin, C., Perez-Estaun, A., & Carbonell, R. (2014.). 3D geological characterization of the Hontomín CO2 storage site, Spain: Multidisciplinary approach from seismic, well-log and regional data, Tectonophysics, 627, 6–25.
[15]
Amigun, J. O., & Odole O. A. (2013). Petrophysical Properties Evaluation for Reservoir Characterisation of SEYI Oil Field (Niger-Delta). International Journal of Innovation and Applied Studies, 3(3), 765–773.
[16]
Amigun, J. O., Olisa, B., & Fadeyi, O. O. (2012). Petrophysical analysis of well logs for reservoir evaluation: A case study of ‘Laja’ Oil Field, Niger Delta. Journal of Petroleum and Gas Exploration Research, 2(10), 181–187.
[17]
Macrae, E. J., Bond, C. E., Shipton, Z. K., and Lunn, R. J. (2016). Increasing the quality of seismic interpretation, Interpretation, 4, T395–T402.
[18]
Niranjan, N. C., (2016). Chapter 2 Seismic Reflection principles: Basics, Seismic Data Interpretation and Evaluation for Hydrocarbon Exploration and Production: A Practitioner's Guide, Springer, 19–35.
[19]
Obiora, D. N., Gbenga, D., & Ogobiri, G. (2016). Reservoir characterization and formation evaluation of a “Royal onshore field”, Southern Niger Delta using geophysical well log data. Journal of the Geological Society of India, 87(5), 591–600.
Adimie, E. O., Macdonald, I. (2024). Comparing the Properties of Well Logs to Seismic Amplitude Analysis to Characterize the Reservoir of the KD Oilfield in Niger Delta, Nigeria. Petroleum Science and Engineering, 8(1), 38-46. https://doi.org/10.11648/j.pse.20240801.15
Adimie, E. O.; Macdonald, I. Comparing the Properties of Well Logs to Seismic Amplitude Analysis to Characterize the Reservoir of the KD Oilfield in Niger Delta, Nigeria. Pet. Sci. Eng.2024, 8(1), 38-46. doi: 10.11648/j.pse.20240801.15
Adimie EO, Macdonald I. Comparing the Properties of Well Logs to Seismic Amplitude Analysis to Characterize the Reservoir of the KD Oilfield in Niger Delta, Nigeria. Pet Sci Eng. 2024;8(1):38-46. doi: 10.11648/j.pse.20240801.15
@article{10.11648/j.pse.20240801.15,
  author = {Elvis Ogede Adimie and Indighe Macdonald},
  title = {Comparing the Properties of Well Logs to Seismic Amplitude Analysis to Characterize the Reservoir of the KD Oilfield in Niger Delta, Nigeria
},
  journal = {Petroleum Science and Engineering},
  volume = {8},
  number = {1},
  pages = {38-46},
  doi = {10.11648/j.pse.20240801.15},
  url = {https://doi.org/10.11648/j.pse.20240801.15},
  eprint = {https://article.sciencepublishinggroup.com/pdf/10.11648.j.pse.20240801.15},
  abstract = {Well logs and data are integrated in most reservoir exploration to provide a reservoir description, the depth and width of the holding subsurface structure are two reservoir parameters that must be understood in order to quantify viable hydrocarbon reservoirs, these metrics are important because they offer suitable contributions for measuring reservoir volume, the objective is to cross-plot well logs with seismic amplitude to provide reservoir characteristics, map reservoir pay zones and determine reservoir depth and thickness, the method applied in this research were collection of set of data consisting of ten wells information cutting across the Agbada formation and 3D post-stack seismic data acquired from the Niger Delta, set of well log suites and software (Word, Excel and Petrel 2014 version) used for analysis, the result analyzed after various cross plots comparing the amplitudes with well logs reveals several trends were discovered, this indicates that higher amplitudes correspond to higher concentrations of hydrocarbons or water based on peak amplitude versus neutron log cross-plot for well KR-1. This study examines the relationship between well logs and amplitude peaks with troughs, as well as potential changes in log signal resulting from variations in seismic amplitude when assessing reservoir sand.
},
 year = {2024}
}
TY  - JOUR
T1  - Comparing the Properties of Well Logs to Seismic Amplitude Analysis to Characterize the Reservoir of the KD Oilfield in Niger Delta, Nigeria

AU  - Elvis Ogede Adimie
AU  - Indighe Macdonald
Y1  - 2024/04/17
PY  - 2024
N1  - https://doi.org/10.11648/j.pse.20240801.15
DO  - 10.11648/j.pse.20240801.15
T2  - Petroleum Science and Engineering
JF  - Petroleum Science and Engineering
JO  - Petroleum Science and Engineering
SP  - 38
EP  - 46
PB  - Science Publishing Group
SN  - 2640-4516
UR  - https://doi.org/10.11648/j.pse.20240801.15
AB  - Well logs and data are integrated in most reservoir exploration to provide a reservoir description, the depth and width of the holding subsurface structure are two reservoir parameters that must be understood in order to quantify viable hydrocarbon reservoirs, these metrics are important because they offer suitable contributions for measuring reservoir volume, the objective is to cross-plot well logs with seismic amplitude to provide reservoir characteristics, map reservoir pay zones and determine reservoir depth and thickness, the method applied in this research were collection of set of data consisting of ten wells information cutting across the Agbada formation and 3D post-stack seismic data acquired from the Niger Delta, set of well log suites and software (Word, Excel and Petrel 2014 version) used for analysis, the result analyzed after various cross plots comparing the amplitudes with well logs reveals several trends were discovered, this indicates that higher amplitudes correspond to higher concentrations of hydrocarbons or water based on peak amplitude versus neutron log cross-plot for well KR-1. This study examines the relationship between well logs and amplitude peaks with troughs, as well as potential changes in log signal resulting from variations in seismic amplitude when assessing reservoir sand.

VL  - 8
IS  - 1
ER  -