Abstract
Background: Chronic kidney disease (CKD) is a global health burden, with an estimated prevalence of 8–16%. Ultrasound and estimated glomerular filtration rate (eGFR) are critical tools for assessing renal function, but studies evaluating their correlation in Ethiopian populations remain lacking. Existing international studies often utilize limited sample sizes, potentially affecting their generalizability to local contexts. Objective: To compare ultrasound-based renal parenchymal grading with eGFR in CKD patients at a tertiary care center in Addis Ababa, St. Paul’s Hospital Millennium Medical College. Methods: We conducted an institutional cross-sectional study of 235 CKD patients from August 2022 to May 2023. eGFR was calculated using the MDRD formula from serum creatinine values. Standardized ultrasound evaluation assessed cortical echogenicity (graded 0-3 relative to splenic echogenicity), corticomedullary differentiation, renal length, and parenchymal thickness. Statistical analysis employed descriptive statistics, ANOVA, and Spearman's correlation using SPSS version 27. Results: The cohort demonstrated significant progressive decline in mean eGFR values corresponding to worsening ultrasound grades: 60.7 ± 14.7 mL/min/1.73m2 (Grade 0), 43.2 ± 11 (Grade 1), 26.8 ± 6.1 (Grade 2), and 12.2 ± 6.4 (Grade 3). Cortical echogenicity and corticomedullary differentiation showed particularly strong negative correlations with eGFR (P < 0.001). Renal length demonstrated a significant positive correlation with eGFR (right: r = 0.470; left: r = 0.454; both P < 0.001), while parenchymal thickness measurements did not demonstrate strong statistically significant associations. Conclusion: Our study confirms significant correlations between ultrasound-based renal grading and eGFR in CKD patients. We recommend adopting this grading system in clinical practice alongside serum creatinine and GFR measurements for comprehensive renal assessment. The results serve as valuable baseline data for future research, particularly regarding cases with Grade 3 parameters but normal renal size, which may need inclusion in the grading system.
|
Published in
|
Radiation Science and Technology (Volume 11, Issue 2)
|
|
DOI
|
10.11648/j.rst.20251102.11
|
|
Page(s)
|
23-32 |
|
Creative Commons
|

This is an Open Access article, distributed under the terms of the Creative Commons Attribution 4.0 International License (http://creativecommons.org/licenses/by/4.0/), which permits unrestricted use, distribution and reproduction in any medium or format, provided the original work is properly cited.
|
|
Copyright
|
Copyright © The Author(s), 2025. Published by Science Publishing Group
|
Keywords
Chronic Kidney Disease, Ultrasound Grading, Glomerular Filtration Rate, Renal Echogenicity, Ethiopia
1. Introduction
Chronic kidney disease (CKD) is defined by the presence of kidney damage or decreased kidney function (GFR <60 mL/min/1.73 m
2) for three or more months, irrespective of the cause
. It is a major global health problem, with an estimated prevalence of 8% to 16%, nearly 500 million individuals, of whom 78% reside in low- to middle-income countries
| [2] | Cindy George, Amelie Mogueo, Ikechi Okpechi, Justin B Echouffo-Tcheugui, Andre Pascal Kengne. Chronic kidney disease in low-income to middle-income countries. The case for increased screening. BMJ Global Health. 2017, 2, e000256. https://doi.org/10.1136/bmjgh-2016-000256 |
| [3] | Abd ElHafeez S, Bolignano D, D'Arrigo G, Dounousi E, Tripepi G, Zoccali C. Prevalence and burden of chronic kidney disease among the general population and high-risk groups in Africa. A systematic review. BMJ Open. 2018, 8(1), e015069. https://doi.org/10.1136/bmjopen-2016-015069 |
[2, 3]
. The estimated incidence rates of CKD in low to middle-income countries might be up to 4 times higher than those observed in developed countries. CKD is often asymptomatic until later stages, making early detection critical to slow progression to kidney failure
. Glomerular filtration rate (GFR) is the primary laboratory tool for assessing renal function, with studies reporting CKD prevalence of 14.3%–17.3% based on eGFR equations
| [4] | Hailemaryam Alemu, Workagegnehu Hailu, Aynishet Adane. Prevalence of Chronic Kidney Disease and Associated Factors among Patients with Diabetes in Northwest Ethiopia. A Hospital-Based Cross-Sectional Study. Current Therapeutic Research. 2020, 92, 100578. https://doi.org/10.1016/j.curtheres.2020.100578 |
[4]
. However, ultrasonography remains the first-line imaging modality for evaluating renal insufficiency, as findings like echogenicity, renal length, and parenchymal thickness reflect irreversible changes and disease progression
.
In Sub-Saharan Africa, CKD is an increasing health burden with risk factors that include communicable and non-communicable diseases
| [7] | Tanifer JW, Jing B, Tolan S, Helmke N, Mukerjee R, Naicker S, Patel U. The epidemiology of chronic kidney disease in sub-Saharan Africa. A systematic review and meta-analysis. The Lancet Global Health. 2014, 2(3), e174-e181. https://doi.org/10.1016/S2214-109X(14)70002-6 |
[7]
and is more commonly affects individuals between 20 and 50 years of age, and the age of onset of ESRD is 20 years earlier in populations of African descent compared with other ethnic groups in Western countries (45 years vs 63 years)
| [3] | Abd ElHafeez S, Bolignano D, D'Arrigo G, Dounousi E, Tripepi G, Zoccali C. Prevalence and burden of chronic kidney disease among the general population and high-risk groups in Africa. A systematic review. BMJ Open. 2018, 8(1), e015069. https://doi.org/10.1136/bmjopen-2016-015069 |
[3]
. A systematic review highlighted CKD as prevalent and escalating in sub-Saharan Africa, yet the problem remains underestimated due to scarce research
| [7] | Tanifer JW, Jing B, Tolan S, Helmke N, Mukerjee R, Naicker S, Patel U. The epidemiology of chronic kidney disease in sub-Saharan Africa. A systematic review and meta-analysis. The Lancet Global Health. 2014, 2(3), e174-e181. https://doi.org/10.1016/S2214-109X(14)70002-6 |
[7]
.
Ethiopia lacks studies correlating renal ultrasound parameters (e.g., parenchymal grading) with eGFR or creatinine, despite evidence from other regions supporting this relationship. For example, several studies show sonography is a good non-invasive diagnostic tool for evaluating renal disease. A 2020 study conducted in Bangalore, India, among 80 patients concluded that there is a strong correlation between sonographic grading and eGFR calculated using the MDRD formula
| [8] | Prashanth S, Ravi N, Chandrashekar M. Sonographic grading of renal parenchymal changes and its comparison with estimated glomerular filtration rate (eGFR) using Modified Diet in Renal Disease formula. Int J Contemp Med Surg Radiol. 2020, 5(2). https://doi.org/10.21276/ijcmsr.2020.5.2.4 |
[8]
. Similarly, a 2016 study in Amritsar, India, involving 100 patients demonstrated that renal parenchymal disease grade, determined by cortical echogenicity, correlated well with serum creatinine in CKD, showing a statistically significant positive relationship (P < 0.001)
| [9] | Singh A, Gupta K, Chander R, Vira M. Sonographic grading of renal cortical echogenicity and raised serum creatinine in patients with chronic kidney disease. J Evol Med Dent Sci. 2016, 5(38), 2279-2286. https://doi.org/10.14260/jemds/2016/530 |
| [10] | Siddappa JK, Singla S, Al Ameen M, Rakshith SC, Kumar N. Correlation of ultrasonographic parameters with serum creatinine in chronic kidney disease. J Clin Imaging Sci. 2013, 3, 28. https://doi.org/10.4103/2156-7514.114809 |
[9, 10]
.
Further supporting evidence comes from a 2019 study conducted in Karachi, Pakistan, involving 200 patients. The aim of the study was to determine the role of ultrasound in diagnosing CKD and its correlation with serum creatinine levels. This research found that cortical echogenicity and its grading correlated better with serum creatinine than other sonographic parameters, such as renal length, parenchymal thickness, or cortical thickness
| [11] | Ahmed S, Bughio S, Hassan M, Lal S, Ali M. Role of ultrasound in the diagnosis of chronic kidney disease and its correlation with serum creatinine level. Cureus. 2019, 11(3), e4241. https://doi.org/10.7759/cureus.4241 |
[11]
. Additionally, a smaller study conducted in 2010 among 25 patients in Rhode Island, USA, explored the relationship between cortical thickness, renal length, and the degree of renal impairment. It concluded that cortical thickness measured on ultrasound is more closely related to eGFR than renal length
| [12] | Beland MD, Walle NL, Machan JT, Cronan JJ. Renal cortical thickness measured at ultrasound. Is it better than renal length as an indicator of renal function in chronic kidney disease? AJR Am J Roentgenol. 2010, 195(2), W146-W149. https://doi.org/10.2214/AJR.09.4104 |
[12]
. However, these studies’ limited sample sizes and geographic disparities necessitate validation in local populations. Despite the established role of ultrasound in CKD evaluation, most studies from developing countries focus only on late-stage disease detection rather than early parenchymal changes
. This is particularly concerning in lower-resourced settings, where patients often present late, when therapeutic interventions have limited impact.
The characteristic ultrasonographic findings of CKD; small kidney size, increased cortical echogenicity, and thinning of parenchyma represent irreversible damage
. However, earlier detection of these changes could potentially allow for more timely intervention to slow disease progression. While studies from India and Pakistan demonstrate good correlation between sonographic parameters and renal function tests
| [8] | Prashanth S, Ravi N, Chandrashekar M. Sonographic grading of renal parenchymal changes and its comparison with estimated glomerular filtration rate (eGFR) using Modified Diet in Renal Disease formula. Int J Contemp Med Surg Radiol. 2020, 5(2). https://doi.org/10.21276/ijcmsr.2020.5.2.4 |
| [9] | Singh A, Gupta K, Chander R, Vira M. Sonographic grading of renal cortical echogenicity and raised serum creatinine in patients with chronic kidney disease. J Evol Med Dent Sci. 2016, 5(38), 2279-2286. https://doi.org/10.14260/jemds/2016/530 |
| [11] | Ahmed S, Bughio S, Hassan M, Lal S, Ali M. Role of ultrasound in the diagnosis of chronic kidney disease and its correlation with serum creatinine level. Cureus. 2019, 11(3), e4241. https://doi.org/10.7759/cureus.4241 |
[8, 9, 11]
, their applicability to our population remains uncertain due to differences in disease patterns and healthcare access. This highlights the need for local data to guide clinical practice.
Ultrasound is indispensable for diagnosing and monitoring CKD due to its safety, accessibility, and ability to detect structural abnormalities like increased cortical echogenicity, a hallmark of chronic renal failure
| [14] | Moccia WA, Kaude JV, Wright PG, Gaffney EF. Evaluation of chronic renal failure by digital gray-scale ultrasound. Urol Radiol. 1980, 2(1), 1-7. https://doi.org/10.1007/BF02926687 |
| [15] | Moghazi S, Jones E, Schroepple J, Arya K, McClellan W, Hennigar RA, O'Neill WC. Correlation of renal histopathology with sonographic findings. Kidney Int. 2005, 67(4), 1515-1520. https://doi.org/10.1111/j.1523-1755.2005.00230.x |
[14, 15]
. While no sonographic features distinguish glomerular from tubulointerstitial diseases
, grading systems based on echogenicity and parenchymal thickness correlate significantly with serum creatinine and eGFR
| [9] | Singh A, Gupta K, Chander R, Vira M. Sonographic grading of renal cortical echogenicity and raised serum creatinine in patients with chronic kidney disease. J Evol Med Dent Sci. 2016, 5(38), 2279-2286. https://doi.org/10.14260/jemds/2016/530 |
| [10] | Siddappa JK, Singla S, Al Ameen M, Rakshith SC, Kumar N. Correlation of ultrasonographic parameters with serum creatinine in chronic kidney disease. J Clin Imaging Sci. 2013, 3, 28. https://doi.org/10.4103/2156-7514.114809 |
| [11] | Ahmed S, Bughio S, Hassan M, Lal S, Ali M. Role of ultrasound in the diagnosis of chronic kidney disease and its correlation with serum creatinine level. Cureus. 2019, 11(3), e4241. https://doi.org/10.7759/cureus.4241 |
[9-11]
. Despite this, no such studies exist in Ethiopia, leaving a gap in utilizing ultrasound for early CKD detection and management.
The clinical implications of establishing this correlation are significant for resource-limited settings like Ethiopia. Ultrasonography is more accessible and affordable than repeated eGFR measurements for CKD monitoring, particularly in peripheral health facilities
| [5] | Khati NJ, Hill MC, Kimmel PL. The role of ultrasound in renal insufficiency. The essentials. Ultrasound Q. 2005, 21(4), 227-244. https://doi.org/10.1097/01.wnq.0000186666.61037.f6 |
| [16] | Martino P, Galosi AB. Atlas of Ultrasonography in Urology, Andrology, and Nephrology. Springer; 2017. |
[5, 16]
. If validated, sonographic parameters could serve as reliable surrogates for renal function, especially where laboratory services are inconsistent. Additionally, incorporating sonographic grading systems into routine practice could improve the consistency of reporting among radiologists and sonologists, thereby standardizing CKD evaluation and facilitating better clinical decision-making. This study will address these practical needs while contributing to the limited body of African research on CKD diagnostics and serving as a baseline for future research
| [3] | Abd ElHafeez S, Bolignano D, D'Arrigo G, Dounousi E, Tripepi G, Zoccali C. Prevalence and burden of chronic kidney disease among the general population and high-risk groups in Africa. A systematic review. BMJ Open. 2018, 8(1), e015069. https://doi.org/10.1136/bmjopen-2016-015069 |
| [7] | Tanifer JW, Jing B, Tolan S, Helmke N, Mukerjee R, Naicker S, Patel U. The epidemiology of chronic kidney disease in sub-Saharan Africa. A systematic review and meta-analysis. The Lancet Global Health. 2014, 2(3), e174-e181. https://doi.org/10.1016/S2214-109X(14)70002-6 |
[3, 7]
.
This study aims to determine the relationship between sonographic parameters (cortical echogenicity, parenchymal thickness, renal length, and cortical thickness) and eGFR. For radiologists and sonologists, standardized grading of parenchymal changes would improve reporting consistency and clinical utility
| [6] | O'Neill WC. Sonographic evaluation of renal failure. Am J Kidney Dis. 2000, 35(6), 1021-1038. https://doi.org/10.1016/s0272-6386(00)70036-9 |
| [15] | Moghazi S, Jones E, Schroepple J, Arya K, McClellan W, Hennigar RA, O'Neill WC. Correlation of renal histopathology with sonographic findings. Kidney Int. 2005, 67(4), 1515-1520. https://doi.org/10.1111/j.1523-1755.2005.00230.x |
[6, 15]
. For clinicians, combining imaging findings with eGFR could enhance diagnostic confidence and monitoring of CKD progression
| [8] | Prashanth S, Ravi N, Chandrashekar M. Sonographic grading of renal parenchymal changes and its comparison with estimated glomerular filtration rate (eGFR) using Modified Diet in Renal Disease formula. Int J Contemp Med Surg Radiol. 2020, 5(2). https://doi.org/10.21276/ijcmsr.2020.5.2.4 |
[8]
. This study will address these practical needs while contributing to the limited body of African research on CKD diagnostics and serving as a baseline for future research
| [3] | Abd ElHafeez S, Bolignano D, D'Arrigo G, Dounousi E, Tripepi G, Zoccali C. Prevalence and burden of chronic kidney disease among the general population and high-risk groups in Africa. A systematic review. BMJ Open. 2018, 8(1), e015069. https://doi.org/10.1136/bmjopen-2016-015069 |
| [7] | Tanifer JW, Jing B, Tolan S, Helmke N, Mukerjee R, Naicker S, Patel U. The epidemiology of chronic kidney disease in sub-Saharan Africa. A systematic review and meta-analysis. The Lancet Global Health. 2014, 2(3), e174-e181. https://doi.org/10.1016/S2214-109X(14)70002-6 |
[3, 7]
.
2. Methods and Materials
2.1. Study Area
The study area was at St. Paul's Hospital Millennium Medical College. It is one of the tertiary referral hospitals directly under the Federal Ministry of Health of Ethiopia. The hospital serves approximately 300,000 people annually, with a catchment population exceeding 5 million. It has a total bed capacity of 360, and on average, 650 patients visit the hospital as outpatients and emergencies daily. The hospital college offers both academic and non-academic services across various clinical disciplines.
The St. Paul's Hospital Millennium Medical College renal clinic is one of the follow-up units in the internal medicine department for renal patients with chronic kidney disease and non-CKD. The follow-up clinic works three times per week on Monday, Wednesday, and Friday, where around 40 patients per day are seen, which means approximately 480 patients are seen per month. The outpatient ultrasound unit, operating within the radiology and MRT department, handles a high volume of cases. It serves approximately 80 patients daily, amounting to about 1,600 ultrasound examinations per month.
2.2. Study Period
The study was conducted from August 2022 to May 2023.
2.3. Study Design
The study design was an institutional-based cross-sectional Study.
2.4. Population
2.4.1. Target Population
All CKD patients who are on follow-up.
2.4.2. Source Population
All CKD patients who are on routine follow-up at the renal sub-specialty clinic at St. Paul’s Hospital Millennium Medical College from April 2022 to May 2023.
2.4.3. Study Population
All CKD patients who are on routine follow-up at the renal sub-specialty clinic at St. Paul’s Hospital Millennium Medical College from January 30, 2023, to February 30, 2023, who fulfill the inclusion and exclusion criteria.
2.5. Inclusion and Exclusion Criteria
2.5.1. Inclusion Criteria
1) CKD patients with bilateral renal disease at St. Paul’s Millennium Medical College from April 2022 to February 2023.
2) Age ≥18 years.
2.5.2. Exclusion Criteria
1) Patients on renal replacement therapy like dialysis (to avoid statistical variations as the serum creatinine may not be consistent in them).
2) Patients with a single kidney, obstructive uropathy, cases of polycystic kidney disease, renal malignancy, patients in sepsis, and having acute illnesses like diarrhea, dehydration, and acute febrile illness.
2.6. Sample Size Determination and Sampling Technique
2.6.1. Sample Size Determination
The sample size was calculated using the single population proportion formula. Since most literature uses small sample sizes and the p-value from those studies is small, a p-value of 50% was taken as the proportion of patients. With 95% certainty, a 0.05 type I error rate, and an approximate population of 480 patients (based on the number of patients seen in one month of data collection), a sample size of 214 was determined. Adding a 10% non-response rate yielded a final sample size of 235, calculated using the formula indicated below:
(1)
Where:
N = population size = 480
Z = z-score = 1.96
e = margin of error = 0.05
p = standard of deviation = 0.5
2.6.2. Sampling Technique
The renal clinic at SPHMMC operates three days per week (Monday, Wednesday, and Friday), with an average of 40 patients seen daily. This translates to approximately 480 patients per month during our data collection period. From this population, we applied systematic sampling to select our required 235 study participants.
The sampling was conducted by selecting every third patient from the appointment cards (1:3 sampling interval). For each selected patient, we collected clinical information and performed renal ultrasound examinations according to our study protocol.
2.7. Study Variables
2.7.1. Predictor Variables
Age
Sex
Cortical echogenicity
Cortico-medullary differentiation
Renal longitudinal size
Parenchymal/ Cortical thickness
2.7.2. Response Variables
Serum Creatinine
Glomerular Filtration Rate/GFR
2.8. Operational Definitions
Estimated Glomerular Filtration Rate (eGFR): Calculated from serum creatinine using the Modified Diet in Renal Disease (MDRD) formula. GFR and creatinine are inversely related.
Normal Renal Dimensions:
1) Longitudinal length:
i. Right kidney: 8–12.5 cm
| [17] | Okoye IJ, Agwu KK, Idigo FU. Normal sonographic renal length in adult southeast Nigerians. Afr J Med Med Sci. 2005, 34(2), 129-131. |
[17]
ii. Left kidney: 8.3–12.8 cm
| [17] | Okoye IJ, Agwu KK, Idigo FU. Normal sonographic renal length in adult southeast Nigerians. Afr J Med Med Sci. 2005, 34(2), 129-131. |
[17]
2) Parenchymal thickness: 1.8–2.24 cm
| [18] | Muthusami P, Ananthakrishnan R, Santosh P. Need for a nomogram of renal sizes in the Indian population - findings from a single centre sonographic study. Indian J Med Res. 2014, 139(5), 686-693. |
[18]
3) Cortical thickness: 8–11.5 mm
| [19] | Yamashita SR, von Atzingen AC, Iared W, Bezerra AS, Ammirati AL, Canziani ME, D'Ippolito G. Value of renal cortical thickness as a predictor of renal function impairment in chronic renal disease patients. Radiol Bras. 2015, 48(1), 12-16. https://doi.org/10.1590/0100-3984.2014.0008 |
[19]
Sonographic Parameters:
1) Cortical echogenicity: Graded as:
i. Hypoechoic (less than spleen)
ii. Isoechoic (equal to spleen)
iii. Hyperechoic (greater than spleen)
2) Corticomedullary differentiation: Classified as:
i. Preserved
ii. Decreased
iii. Lost
Rationale for Spleen Comparison: Different literature use either liver or spleen as a comparative organ for grading. In this study, the spleen was used as the reference organ because hepatic echogenicity is often unreliable in CKD patients.
Chronic conditions like diabetes mellitus (a common CKD etiology) cause hepatic steatosis, artificially increasing liver echogenicity and potentially underestimating renal pathology
| [20] | Shivashankara VU, Shivalli S, Pai BH, Acharya KD, Gopalakrishnan R, Srikanth V, Reddy V, Haris A. A comparative study of sonographic grading of renal parenchymal changes and estimated glomerular filtration rate (eGFR) using Modified Diet in Renal Disease formula. J Clin Diagn Res. 2016, 10(2), TC09-TC11. https://doi.org/10.7860/jcdr/2016/16986.7233 |
[20]
.
Grading of Renal Parenchymal Changes
| [20] | Shivashankara VU, Shivalli S, Pai BH, Acharya KD, Gopalakrishnan R, Srikanth V, Reddy V, Haris A. A comparative study of sonographic grading of renal parenchymal changes and estimated glomerular filtration rate (eGFR) using Modified Diet in Renal Disease formula. J Clin Diagn Res. 2016, 10(2), TC09-TC11. https://doi.org/10.7860/jcdr/2016/16986.7233 |
[20]
:
1) Grade 0: Normal kidney size; cortical echogenicity < spleen; preserved corticomedullary differentiation.
2) Grade 1: Normal kidney size; cortical echogenicity = spleen; maintained corticomedullary differentiation.
3) Grade 2: Normal kidney size; cortical echogenicity > spleen; decreased corticomedullary differentiation.
4) Grade 3: Reduced renal length; cortical echogenicity > spleen; poorly maintained corticomedullary differentiation.
2.9. Data Collection, Analysis & Quality Control
This study was conducted in the Department of Radiology and MRT at St. Paul's Hospital Millennium Medical College in collaboration with the Department of Medicine. Clinical data including age, sex, duration of illness, comorbidities and other parameters from the inclusion/exclusion criteria were collected from patient medical cards. The estimated glomerular filtration rate (eGFR) was calculated from serum creatinine levels using the Modified Diet in Renal Disease (MDRD) formula, which gives eGFR in ml/min/1.73 m2. Abdominal sonography was then performed by a final year radiology resident for all patients who met the inclusion criteria. As the principal investigator, I used a self-developed digital data collection template through KoBoToolbox to carefully record both the ultrasound findings and clinical data from medical charts, organizing the information as both numeric and categorical data for statistical analysis.
For data quality control, the KoBoToolbox form was prepared with predetermined sets of information before data collection began to minimize errors, and the principal investigator double-checked all collected data before being submitted to the system. The entered data were then transferred from KoBoToolbox to SPSS version 27 for analysis. The data analysis included descriptive statistics (proportions, means, medians and frequencies presented in tables and graphs) as well as inferential statistical analysis using one-way ANOVA methods and Spearman's correlation coefficient to examine relationships between variables.
2.10. Ethical Considerations
Ethical clearance was obtained from both the Department of Radiology and Medical Radiology Technology and the Institutional Review Board (IRB) of St. Paul's Hospital Millennium Medical College prior to initiating data collection. All patient information was handled with strict confidentiality, and collected data were used exclusively for research purposes following the approved study protocol.
All participants provided written informed consent before taking part in the study. They were thoroughly informed about the study’s objectives, inclusion criteria, what their participation would involve, and how their privacy would be protected. Participants were also reminded that their participation was entirely voluntary and that they could decline to participate without any consequence.
3. Result
3.1. Socio-Demographic Characteristics
The study included 235 participants, consisting of 140 males (59.6%) and 95 females (40.4%). Participants had a mean age of 49 years with a standard deviation of 14.7 years, ranging from 16 to 86 years. No gender-based differences were observed in the findings.
3.2. Sonographic Characteristics
3.2.1. Cortical Echogenicity and Corticomedullary Differentiation
Cortical echogenicity was normal/hypoechoic in 16 cases (6.8%), isoechoic in 65 cases (27.7%), and hyperechoic in 154 cases (65.5%). Corticomedullary differentiation was preserved in 88 cases (37.4%), decreased in 33 cases (14%), and lost in 114 cases (48.5%). No hypo-/isoechoic kidneys exhibited CMD loss. Hyperechoic cortices (65% of cases) showed severe dysfunction, with creatinine levels 5.5× higher (6.48 ± 3.04 vs. 1.83 ± 0.50 mg/dL, p < 0.001). Notably, every case of decreased (14%) and lost (48.5%) cortical medullary differentiation (CMD) was observed exclusively in hyperechoic kidneys [
Table 1].
Table 1. Cortical Echogenicity, CMD Status and Renal Function.
Parameter | Hypoechoic (n=16) | Isoechoic (n=65) | Hyperechoic | p-value |
Decreased CMD (n=30) | Lost CMD (n=114) |
Creatinine (mg/dL) | 1.52 ± 0.40 | 1.91 ± 0.52 | 2.71 ± 0.53 | 6.48 ± 3.04 | <0.001 |
eGFR | 60.7 ± 14.7 | 42.6 ± 11.5 | 26.8 ± 6.1 | 12.6 ± 6.2 | <0.001 |
CMD Status (%) | 100% Preserved | 100% Preserved | 100% Decreased | 100% Lost | |
Abbreviations: CMD = corticomedullary differentiation; eGFR = estimated glomerular filtration rate; n = number of participants
3.2.2. Renal Size and Function
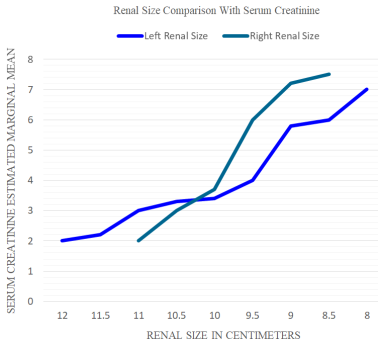
Kidney size was normal in 70% of cases and small in 30%, with no significant difference between right and left kidneys, and no abnormal enlargement was seen. The mean renal length was 9.5 cm (SD ± 0.8) on the right side and 9.8 cm (SD ± 1.1) on the left side. Renal length showed a statistically significant positive correlation with eGFR and a negative correlation with serum creatinine (p < 0.001) [
Table 2] [
Figure 1].
Figure 1. Renal Function Trends Across Varying Renal Sizes.
Table 2. Correlation of Renal Size with Kidney Function Markers (Spearman's correlation matrix).
Variable | Serum Creatinine (r, p) | GFR (r, p) | Renal Size (Right) (r, p) | Renal Size (Left) (r, p) |
Serum Creatinine | 1.000 | - | -0.479* (<0.001) | -0.459* (<0.001) |
eGFR | - | 1.000 | 0.470* (<0.001) | 0.454* (<0.001) |
Renal Size (Right) | -0.479* (<0.001) | 0.470* (<0.001) | 1.000 | 0.888* (<0.001) |
Renal Size (Left) | -0.459* (<0.001) | 0.454* (<0.001) | 0.888** (<0.001) | 1.000 |
Abbreviations: r = Spearman's rank correlation coefficient, p = p-value (2-tailed), * = Significant at p < 0.01. eGFR, estimated glomerular filtration rate, Sample size (N = 235) is consistent for all analyses.
3.2.3. Renal Parenchymal and Cortical Thickness
The mean parenchymal thickness was 1.77 cm (range: 1-2.35 cm; SD ± 0.3), with Right: 1.1 cm (range: 1.0–2.35 cm; SD± 0.3 cm), Left: 1.3 cm (range: 1.0–2.35 cm; SD± 0.3 cm).
Renal parenchyma showed normal thickness in 75% of cases, reduced thickness in 18%, and unmeasurable thickness in 7% due to lost corticomedullary differentiation. Cortical thickness averaged 1.3 cm (range: 1.1–2.5 cm; SD ± 1.2) bilaterally.
Pearson correlation analysis revealed the following key findings: (1) No significant correlations were observed between parenchymal thickness of either kidney and serum creatinine levels (right: r=-0.059, p=0.513; left: r=-0.090, p=0.310); (2) While left kidney parenchymal thickness showed no association with eGFR (r=0.052, p=0.560), right kidney parenchymal thickness demonstrated a weak positive correlation with eGFR (r=0.176, p=0.048); (3) Cortical thickness measurements for both kidneys failed to show any significant correlations with either eGFR or serum creatinine levels (all p>0.05) [
Table 3].
Table 3. Correlations of Renal Parenchymal and Cortical Thickness Measurements with eGFR and Serum Creatinine (Pearson correlation).
Parameter | eGFR (r, p) | Serum Creatinine (r, p) |
Right Parenchymal Thickness | 0.176*, 0.048 | −0.059, 0.513 |
Left Parenchymal Thickness | 0.052, 0.560 | −0.090, 0.310 |
Right Cortical Thickness | 0.016, 0.874 | −0.108, 0.268 |
Left Cortical Thickness | 0.044, 0.654 | −0.140, 0.153 |
Abbreviations: r = Pearson correlation coefficient; p = p-value
3.2.4. Renal Parenchymal Grading and Renal Function
Ultrasound evaluation revealed the following distribution of renal parenchymal changes: grade 0 in 16 cases (6.8%), grade 1 in 62 cases (26.4%), grade 2 in 30 cases (12.8%), and grade 3 in 70 cases (29.8%).
Mean serum creatinine levels increased progressively across parenchymal grades: grade 0 (1.518 0.395 mg/dL; range: 1.12–1.913), grade 1 (1.875 ± 0.496 mg/dL; range: 1.38–2.37), grade 2 (2.713 ± 0.528 mg/dL; range: 2.185–3.24), and grade 3 (6.7 ± 3.11 mg/dL; range: 3.59–9.81). Mean eGFR values decreased with higher parenchymal grades: grade 0 (60.7 ± 14.7 mL/min/1.73 m2; range: 46–75.4), grade 1 (43.2 ± 11 mL/min/1.73 m2; range: 32.2–54.2), grade 2 (26.8 ± 6.1 mL/min/1.73 m2; range: 20.7–32.9), and grade 3 (12.2 ± 6.4 mL/min/1.73 m2; range: 5.8–18.6).
Grade 0 was associated with a normal mean eGFR of 60.7 ± 14.7 mL/min. Grades 1 and 2 showed intermediate impairment, with significant differences across groups (p < 0.001, ANOVA). Grade 3 correlated with end-stage renal disease (ESRD)-range eGFR of 12.2 ± 6.4 mL/min and elevated serum creatinine (6.70 ± 3.11 mg/dL) [
Table 4].
Table 4. Renal Parenchymal Grading and Renal Function.
Grade | Ultrasound Parameters | Number (%) | Mean Creatinine ± SD (mg/dL) | Creatinine Range | Mean eGFR ± SD (mL/min/1.73m2) | GFR Range |
0 | Hypoechoic, Preserved CMD, Normal size | 16 (6.8%) | 1.52 ± 0.40 | 1.12–1.91 | 60.7 ± 14.7 | 46.0–75.4 |
1 | Isoechoic, Preserved CMD, Normal size | 62 (26.4%) | 1.88 ± 0.50 | 1.38–2.37 | 43.2 ± 11.0 | 32.2–54.2 |
2 | Hyperechoic, Decreased CMD, Normal size | 30 (12.7%) | 2.71 ± 0.53 | 2.18–3.24 | 26.8 ± 6.1 | 20.7–32.9 |
3 | Hyperechoic, Lost CMD, Decreased size | 70 (29.7%) | 6.70 ± 3.11 | 3.59–9.81 | 12.2 ± 6.4 | 5.8–18.6 |
Abbreviations: CMD = Corticomedullary differentiation; SD = Standard deviation; eGFR = Estimated glomerular filtration rate; CKD = Chronic kidney disease.
3.3. Univariate Analysis of Echogenicity and Corticomedullary Differentiation
Univariate two-way ANOVA showed statistically significant differences (p < 0.001) in mean serum creatinine and eGFR values across grades of cortical echogenicity and corticomedullary differentiation [
Table 5].
Table 5. Univariate Two-Way ANOVA Analysis Results for Renal Function by Cortical Characteristics.
Characteristic | Group | Serum Creatinine (mg/dL) | eGFR (mL/min/1.73m2) | Post-Hoc Comparisons (p<0.001) |
Cortical Echogenicity | | F=47.1, p<0.001 | F=37.7, p<0.001 | Hyperechoic > Isoechoic > Hypoechoic |
| Hypoechoic (n=16) | 1.52 ± 0.40 | 60.7 ± 14.8 | Hypo vs Hyper: Δ44.5 GFR |
| Isoechoic (n=65) | 1.91 ± 0.52 | 42.6 ± 11.5 | Iso vs Hyper: Δ26.4 GFR |
| Hyperechoic (n=154) | 5.46 ± 3.14 | 16.2 ± 9.0 | |
CMD Status | | F=62.5, p<0.001 | F=35.0, p<0.001 | Lost > Decreased > Preserved |
| Preserved (n=88) | 1.83 ± 0.50 | 46.1 ± 14.2 | Lost vs Preserved: Δ33.5 GFR |
| Decreased (n=33) | 2.71 ± 0.51 | 27.0 ± 6.1 | Decreased vs Preserved: Δ19.1 GFR |
| Lost (n=114) | 6.48 ± 3.04 | 12.6 ± 6.2 | |
ANOVA = Analysis of Variance; F = F-statistic; p = probability value; CMD = Corticomedullary differentiation; eGFR = Estimated glomerular filtration rate; post-hoc comparisons performed using Hochberg's GT2 method to account for unequal variances (all Levene's tests p<0.001); Δ Change/difference in value; Data shown as mean ± Standard deviation
4. Discussion
In this study, we observed that hyperechoic renal cortices were present in the majority of CKD patients (65.5%), with corticomedullary differentiation (CMD) either decreased or lost in 48.5% of cases. Notably, all cases with lost or decreased CMD were exclusively associated with hyperechoic cortices, reinforcing the progressive nature of CKD-related structural changes. These findings align with established literature, where increased cortical echogenicity is a hallmark of chronic renal parenchymal disease
. Recent studies confirm that ultrasonography has become an essential non-invasive tool for evaluating kidney diseases
. Grading renal parenchymal changes by ultrasound helps assess disease severity
| [22] | Page JE, Morgan SH, Eastwood JB, Smith SA, Webb DJ, Dilly SA, Chow J, Pottier A, Joseph AE. Ultrasound findings in renal parenchymal disease. Comparison with histological appearances. Clin Radiol. 1994, 49(12), 867-870. https://doi.org/10.1016/s0009-9260(05)82877-6 |
[22]
, while eGFR calculated using the MDRD formula remains the most important indicator of renal function, prognosis, and disease staging
| [23] | Bailie GR, Uhlig K, Levey AS. Clinical practice guidelines in nephrology. Evaluation, classification, and stratification of chronic kidney disease. Pharmacotherapy. 2005, 25(4), 491-502. https://doi.org/10.1592/phco.25.4.491.61034 |
[23]
. Our results are consistent with reports identifying increased cortical echogenicity as the most common ultrasonographic abnormality in CKD patients
.
The grading system used in this study revealed a clear inverse relationship between ultrasound grades and renal function. Specifically, higher grades of cortical echogenicity (Grades 2 and 3) correlated with significantly elevated serum creatinine levels (Grade 2: 2.713 ± 0.528 mg/dL; Grade 3: 6.7 ± 3.11 mg/dL) and markedly reduced eGFR values (Grade 2: 26.8 ± 6.1 mL/min/1.73 m
2; Grade 3: 12.2 ± 6.4 mL/min/1.73 m
2). These findings are supported by J. Siddappa et al., who reported that among various sonographic parameters, renal echogenicity and its grading as the most reliable ultrasound features correlating with serum creatinine levels in CKD patients. Their study demonstrated that as cortical echogenicity increased, renal function, reflected by serum creatinine, worsened
| [10] | Siddappa JK, Singla S, Al Ameen M, Rakshith SC, Kumar N. Correlation of ultrasonographic parameters with serum creatinine in chronic kidney disease. J Clin Imaging Sci. 2013, 3, 28. https://doi.org/10.4103/2156-7514.114809 |
[10]
. Similarly, Shivashankara et al. found a linear inverse correlation between eGFR and the sonographic grade of parenchymal changes, supporting the clinical relevance of echogenicity grading
| [20] | Shivashankara VU, Shivalli S, Pai BH, Acharya KD, Gopalakrishnan R, Srikanth V, Reddy V, Haris A. A comparative study of sonographic grading of renal parenchymal changes and estimated glomerular filtration rate (eGFR) using Modified Diet in Renal Disease formula. J Clin Diagn Res. 2016, 10(2), TC09-TC11. https://doi.org/10.7860/jcdr/2016/16986.7233 |
[20]
.
A 2016 prospective study conducted in Amritsar, India, involving 100 patients, also reported that the grading of renal parenchymal disease by cortical echogenicity showed a statistically significant positive correlation between increased cortical echogenicity and higher serum creatinine levels (P < 0.001)
| [9] | Singh A, Gupta K, Chander R, Vira M. Sonographic grading of renal cortical echogenicity and raised serum creatinine in patients with chronic kidney disease. J Evol Med Dent Sci. 2016, 5(38), 2279-2286. https://doi.org/10.14260/jemds/2016/530 |
[9]
. Additionally, a study published in 2020 in Bangalore, India, among 80 patients concluded that there was a good correlation between sonographic grading and eGFR using the MDRD formula
| [8] | Prashanth S, Ravi N, Chandrashekar M. Sonographic grading of renal parenchymal changes and its comparison with estimated glomerular filtration rate (eGFR) using Modified Diet in Renal Disease formula. Int J Contemp Med Surg Radiol. 2020, 5(2). https://doi.org/10.21276/ijcmsr.2020.5.2.4 |
[8]
. Our research shows a comparable result, emphasizing the clinical usefulness of sonographic grading in assessing renal function in CKD patients. The histological basis for this correlation is well-documented, as increased echogenicity reflects interstitial fibrosis and glomerulosclerosis, which are irreversible markers of CKD progression
.
In addition, renal length also showed significant correlation with renal function (P < 0.001). Specifically, significant inverse correlation with serum creatinine (Right: ρ=-0.479, p<0.001; Left: ρ=-0.459, p<0.001), Significant positive correlation with eGFR (Right: ρ=0.470, p<0.001; Left: ρ=0.454, p<0.001), and Strong bilateral symmetry in correlations (Right-Left correlation: ρ=0.888, p<0.001) was observed. These findings align with O’Neill et al.
, who identified renal length as a clinical predictor of functional decline in CKD, though our correlations were stronger than those reported in some prior studies where renal length lacked significance
| [9] | Singh A, Gupta K, Chander R, Vira M. Sonographic grading of renal cortical echogenicity and raised serum creatinine in patients with chronic kidney disease. J Evol Med Dent Sci. 2016, 5(38), 2279-2286. https://doi.org/10.14260/jemds/2016/530 |
| [14] | Moccia WA, Kaude JV, Wright PG, Gaffney EF. Evaluation of chronic renal failure by digital gray-scale ultrasound. Urol Radiol. 1980, 2(1), 1-7. https://doi.org/10.1007/BF02926687 |
[9, 14]
. Still, our results suggest that renal length may still serve as a supplementary marker in certain clinical contexts, particularly in early-stage CKD, where structural changes are less pronounced.
In this study, parenchymal and cortical thickness measurements did not exhibit a strong significant correlation with renal function. Except for the weak positive correlation found between right renal parenchymal thickness and eGFR (Spearman's ρ = 0.176, p = 0.048), no statistically significant association was found between renal parenchymal or cortical thickness and either eGFR or serum creatinine levels (P > 0.01). This aligns with the work of Yamashita et al., who concluded that parenchymal thickness lacks predictive value for renal function impairment, urging clinicians to discourage its use in clinical contexts to infer correlation
| [19] | Yamashita SR, von Atzingen AC, Iared W, Bezerra AS, Ammirati AL, Canziani ME, D'Ippolito G. Value of renal cortical thickness as a predictor of renal function impairment in chronic renal disease patients. Radiol Bras. 2015, 48(1), 12-16. https://doi.org/10.1590/0100-3984.2014.0008 |
[19]
. On the other hand, earlier studies have shown a statistically significant correlation between cortical thickness and renal function.
| [12] | Beland MD, Walle NL, Machan JT, Cronan JJ. Renal cortical thickness measured at ultrasound. Is it better than renal length as an indicator of renal function in chronic kidney disease? AJR Am J Roentgenol. 2010, 195(2), W146-W149. https://doi.org/10.2214/AJR.09.4104 |
| [13] | Päivänsalo M, Huttunen K, Suramo I. Ultrasonographic findings in renal parenchymal diseases. Scand J Urol Nephrol. 1985, 19(2), 119-123. https://doi.org/10.3109/00365598509180238 |
| [19] | Yamashita SR, von Atzingen AC, Iared W, Bezerra AS, Ammirati AL, Canziani ME, D'Ippolito G. Value of renal cortical thickness as a predictor of renal function impairment in chronic renal disease patients. Radiol Bras. 2015, 48(1), 12-16. https://doi.org/10.1590/0100-3984.2014.0008 |
[12, 13, 19]
. While differences in sample size, contributions of differing population characteristics (e.g., proportion of diabetic CKD participants), and measurement techniques can explain this difference, it has been shown that cortical thickness does not significantly correlate with histologic markers (Tubular atrophy, interstitial inflammation/fibrosis, and glomerular sclerosis), which supports the finding of this study
.
From a regional perspective, there is a notable scarcity of published data on this subject from our geographical area. While this limited direct comparison with local studies, our findings provide valuable new evidence by demonstrating significant correlations between sonographic parameters and renal function markers, relationships established in other populations but previously unconfirmed in our population. The strong associations we observed between ultrasound findings (particularly cortical echogenicity and renal length) and biochemical markers align with international studies, suggesting sonographic assessment could be valuable for CKD monitoring in resource-limited settings. These results provide foundational data for establishing local reference standards and should prompt further investigation of population-specific variations.
5. Strengths and Limitations of the Study
5.1. Strengths
A major strength of this study is its practical and cost-efficient design, which allowed for reliable data collection with minimal resources. This approach not only makes our methods easily replicable but also particularly valuable, especially in low-resource settings where complex or expensive techniques may not be feasible. The cross-sectional design also allowed us to efficiently examine multiple variables at once, capturing important relationships within our study population.
5.2. Limitations
One limitation of our study was the absence of a published article based on our geography that recommends standard measurements of some of the ultrasound parameters, like renal size, cortical and parenchymal thickness, since these values differ in different races and geographic areas. Additionally, our statistical analysis was constrained by the violation of ANOVA’s homogeneity of variance assumption, which could influence the reliability of the results. Finally, our grading system did not account for a significant number of overlapping cases where patients exhibited parameters similar to Grade 3 but had normal renal size, which could influence the comprehensiveness of the grading criteria.
6. Conclusion and Recommendations
6.1. Conclusion
In this study, we assessed the relationship between sonographic parameters and grading of renal parenchymal changes with serum creatinine and estimated GFR (eGFR). Our findings show a statistically significant negative correlation between renal parenchymal grading and eGFR (p < 0.01), as well as a statistically significant positive correlation between renal parenchymal grading and serum creatinine (p < 0.01).
Therefore, we can conclude that renal parenchymal grading using ultrasound shows a meaningful association with both eGFR and serum creatinine, supporting its potential use as a helpful tool in evaluating renal function.
6.2. Recommendations
From the findings of this research, it is recommended that the renal parenchymal grading system used in this study be considered as part of routine ultrasound evaluation, as it may aid in assessing renal function alongside serum creatinine and eGFR. This grading approach can also serve as a baseline reference for future studies in similar clinical settings. In addition, cases with sonographic features closely resembling Grade 3 changes but showing normal renal size should be evaluated for possible inclusion under Grade 3, given the notable overlap observed. Further research is also necessary, especially focusing on parameters and measurements noted in this study’s limitations, to expand understanding and validate these findings across different populations and clinical contexts.
Abbreviations
CKD | Chronic Kidney Disease |
eGFR | Glomerular Filtration Rate |
MDRD | Modification of Diet in Renal Disease |
ANOVA | Analysis of Variance |
SPSS | Statistical Package for the Social Sciences |
eGFR | estimated Glomerular Filtration Rate |
LMICs | Low- and Middle-Income Countries |
ESRD | End-Stage Renal Disease |
SSA | Sub-Saharan Africa |
MRT | Medical Radiology Technology |
SPHMMC | St. Paul's Hospital Millennium Medical College |
SD | Standard Deviation |
CMD | Cortico-Medullary Differentiation |
IRB | Institutional Review Board |
SPSS | Statistical Package for the Social Sciences |
WHO | World Health Organization |
Acknowledgments
The Department of Radiology and MRT at St. Paul Hospital Millennium Medical College (SPHMMC) deserves our sincere gratitude for providing the opportunity to research a topic of great interest. We also want to express our heartfelt appreciation to those who advised and guided us throughout the development of this research project.
Author Contributions
Yosef Alemayehu Habtegiorgis: Conceptualization, Methodology, Writing – original draft
Fanuel Alemayehu Tefera: Formal Analysis, Methodology, Writing – review & editing
Fiyameta Abraham Fissehatsion: Formal Analysis, Methodology, Project administration, Supervision
Saron Negasi Gidey: Formal Analysis, Project administration, Resources, Validation
Getahun Worku Alemu: Formal Analysis, Investigation, Supervision
Simon Zemenfes Hailu: Data curation, Funding acquisition, Resources
Elsabeth Alemayehu Haile: Funding acquisition, Software, Visualization
Bemnet Gossaye Teka: Data curation, Formal Analysis, Visualization
Medhanet Azene Gebeyehu: Investigation, Methodology, Supervision
Funding
This research is self-funded; no external sources of funding were used.
Data Availability Statement
The dataset used in this study is available from the corresponding author upon reasonable request.
Conflicts of Interest
The authors declare no conflicts of interest.
References
| [1] |
Chapter 1. Definition and classification of CKD. Kidney Int Suppl (2011). 2013, 3(1), 19-62.
https://doi.org/10.1038/kisup.2012.64
|
| [2] |
Cindy George, Amelie Mogueo, Ikechi Okpechi, Justin B Echouffo-Tcheugui, Andre Pascal Kengne. Chronic kidney disease in low-income to middle-income countries. The case for increased screening. BMJ Global Health. 2017, 2, e000256.
https://doi.org/10.1136/bmjgh-2016-000256
|
| [3] |
Abd ElHafeez S, Bolignano D, D'Arrigo G, Dounousi E, Tripepi G, Zoccali C. Prevalence and burden of chronic kidney disease among the general population and high-risk groups in Africa. A systematic review. BMJ Open. 2018, 8(1), e015069.
https://doi.org/10.1136/bmjopen-2016-015069
|
| [4] |
Hailemaryam Alemu, Workagegnehu Hailu, Aynishet Adane. Prevalence of Chronic Kidney Disease and Associated Factors among Patients with Diabetes in Northwest Ethiopia. A Hospital-Based Cross-Sectional Study. Current Therapeutic Research. 2020, 92, 100578.
https://doi.org/10.1016/j.curtheres.2020.100578
|
| [5] |
Khati NJ, Hill MC, Kimmel PL. The role of ultrasound in renal insufficiency. The essentials. Ultrasound Q. 2005, 21(4), 227-244.
https://doi.org/10.1097/01.wnq.0000186666.61037.f6
|
| [6] |
O'Neill WC. Sonographic evaluation of renal failure. Am J Kidney Dis. 2000, 35(6), 1021-1038.
https://doi.org/10.1016/s0272-6386(00)70036-9
|
| [7] |
Tanifer JW, Jing B, Tolan S, Helmke N, Mukerjee R, Naicker S, Patel U. The epidemiology of chronic kidney disease in sub-Saharan Africa. A systematic review and meta-analysis. The Lancet Global Health. 2014, 2(3), e174-e181.
https://doi.org/10.1016/S2214-109X(14)70002-6
|
| [8] |
Prashanth S, Ravi N, Chandrashekar M. Sonographic grading of renal parenchymal changes and its comparison with estimated glomerular filtration rate (eGFR) using Modified Diet in Renal Disease formula. Int J Contemp Med Surg Radiol. 2020, 5(2).
https://doi.org/10.21276/ijcmsr.2020.5.2.4
|
| [9] |
Singh A, Gupta K, Chander R, Vira M. Sonographic grading of renal cortical echogenicity and raised serum creatinine in patients with chronic kidney disease. J Evol Med Dent Sci. 2016, 5(38), 2279-2286.
https://doi.org/10.14260/jemds/2016/530
|
| [10] |
Siddappa JK, Singla S, Al Ameen M, Rakshith SC, Kumar N. Correlation of ultrasonographic parameters with serum creatinine in chronic kidney disease. J Clin Imaging Sci. 2013, 3, 28.
https://doi.org/10.4103/2156-7514.114809
|
| [11] |
Ahmed S, Bughio S, Hassan M, Lal S, Ali M. Role of ultrasound in the diagnosis of chronic kidney disease and its correlation with serum creatinine level. Cureus. 2019, 11(3), e4241.
https://doi.org/10.7759/cureus.4241
|
| [12] |
Beland MD, Walle NL, Machan JT, Cronan JJ. Renal cortical thickness measured at ultrasound. Is it better than renal length as an indicator of renal function in chronic kidney disease? AJR Am J Roentgenol. 2010, 195(2), W146-W149.
https://doi.org/10.2214/AJR.09.4104
|
| [13] |
Päivänsalo M, Huttunen K, Suramo I. Ultrasonographic findings in renal parenchymal diseases. Scand J Urol Nephrol. 1985, 19(2), 119-123.
https://doi.org/10.3109/00365598509180238
|
| [14] |
Moccia WA, Kaude JV, Wright PG, Gaffney EF. Evaluation of chronic renal failure by digital gray-scale ultrasound. Urol Radiol. 1980, 2(1), 1-7.
https://doi.org/10.1007/BF02926687
|
| [15] |
Moghazi S, Jones E, Schroepple J, Arya K, McClellan W, Hennigar RA, O'Neill WC. Correlation of renal histopathology with sonographic findings. Kidney Int. 2005, 67(4), 1515-1520.
https://doi.org/10.1111/j.1523-1755.2005.00230.x
|
| [16] |
Martino P, Galosi AB. Atlas of Ultrasonography in Urology, Andrology, and Nephrology. Springer; 2017.
|
| [17] |
Okoye IJ, Agwu KK, Idigo FU. Normal sonographic renal length in adult southeast Nigerians. Afr J Med Med Sci. 2005, 34(2), 129-131.
|
| [18] |
Muthusami P, Ananthakrishnan R, Santosh P. Need for a nomogram of renal sizes in the Indian population - findings from a single centre sonographic study. Indian J Med Res. 2014, 139(5), 686-693.
|
| [19] |
Yamashita SR, von Atzingen AC, Iared W, Bezerra AS, Ammirati AL, Canziani ME, D'Ippolito G. Value of renal cortical thickness as a predictor of renal function impairment in chronic renal disease patients. Radiol Bras. 2015, 48(1), 12-16.
https://doi.org/10.1590/0100-3984.2014.0008
|
| [20] |
Shivashankara VU, Shivalli S, Pai BH, Acharya KD, Gopalakrishnan R, Srikanth V, Reddy V, Haris A. A comparative study of sonographic grading of renal parenchymal changes and estimated glomerular filtration rate (eGFR) using Modified Diet in Renal Disease formula. J Clin Diagn Res. 2016, 10(2), TC09-TC11.
https://doi.org/10.7860/jcdr/2016/16986.7233
|
| [21] |
Kalantarinia K. Novel imaging techniques in acute kidney injury. Curr Drug Targets. 2009, 10(12), 1184-1189.
https://doi.org/10.2174/138945009789753246
|
| [22] |
Page JE, Morgan SH, Eastwood JB, Smith SA, Webb DJ, Dilly SA, Chow J, Pottier A, Joseph AE. Ultrasound findings in renal parenchymal disease. Comparison with histological appearances. Clin Radiol. 1994, 49(12), 867-870.
https://doi.org/10.1016/s0009-9260(05)82877-6
|
| [23] |
Bailie GR, Uhlig K, Levey AS. Clinical practice guidelines in nephrology. Evaluation, classification, and stratification of chronic kidney disease. Pharmacotherapy. 2005, 25(4), 491-502.
https://doi.org/10.1592/phco.25.4.491.61034
|
Cite This Article
-
APA Style
Habtegiorgis, Y. A., Tefera, F. A., Fissehatsion, F. A., Gidey, S. N., Hailu, S. Z., et al. (2025). Comparison of Ultrasound Grading of Renal Parenchymal Disease and Estimated Glomerular Filtration Rate in Chronic Kidney Disease Patients at St. Paul Hospital, Ethiopia. Radiation Science and Technology, 11(2), 23-32. https://doi.org/10.11648/j.rst.20251102.11
 Copy
|
Copy
|
 Download
ACS Style
Habtegiorgis, Y. A.; Tefera, F. A.; Fissehatsion, F. A.; Gidey, S. N.; Hailu, S. Z., et al. Comparison of Ultrasound Grading of Renal Parenchymal Disease and Estimated Glomerular Filtration Rate in Chronic Kidney Disease Patients at St. Paul Hospital, Ethiopia. Radiat. Sci. Technol. 2025, 11(2), 23-32. doi: 10.11648/j.rst.20251102.11
Copy
|
Download
AMA Style
Habtegiorgis YA, Tefera FA, Fissehatsion FA, Gidey SN, Hailu SZ, et al. Comparison of Ultrasound Grading of Renal Parenchymal Disease and Estimated Glomerular Filtration Rate in Chronic Kidney Disease Patients at St. Paul Hospital, Ethiopia. Radiat Sci Technol. 2025;11(2):23-32. doi: 10.11648/j.rst.20251102.11
Copy
|
Download
-
@article{10.11648/j.rst.20251102.11,
  author = {Yosef Alemayehu Habtegiorgis and Fanuel Alemayehu Tefera and Fiyameta Abraham Fissehatsion and Saron Negasi Gidey and Simon Zemenfes Hailu and Elsabeth Alemayehu Haile and Getahun Worku Alemu and Bemnet Gossaye Teka and Medhanet Azene Gebeyehu},
  title = {Comparison of Ultrasound Grading of Renal Parenchymal Disease and Estimated Glomerular Filtration Rate in Chronic Kidney Disease Patients at St. Paul Hospital, Ethiopia
},
  journal = {Radiation Science and Technology},
  volume = {11},
  number = {2},
  pages = {23-32},
  doi = {10.11648/j.rst.20251102.11},
  url = {https://doi.org/10.11648/j.rst.20251102.11},
  eprint = {https://article.sciencepublishinggroup.com/pdf/10.11648.j.rst.20251102.11},
  abstract = {Background: Chronic kidney disease (CKD) is a global health burden, with an estimated prevalence of 8–16%. Ultrasound and estimated glomerular filtration rate (eGFR) are critical tools for assessing renal function, but studies evaluating their correlation in Ethiopian populations remain lacking. Existing international studies often utilize limited sample sizes, potentially affecting their generalizability to local contexts. Objective: To compare ultrasound-based renal parenchymal grading with eGFR in CKD patients at a tertiary care center in Addis Ababa, St. Paul’s Hospital Millennium Medical College. Methods: We conducted an institutional cross-sectional study of 235 CKD patients from August 2022 to May 2023. eGFR was calculated using the MDRD formula from serum creatinine values. Standardized ultrasound evaluation assessed cortical echogenicity (graded 0-3 relative to splenic echogenicity), corticomedullary differentiation, renal length, and parenchymal thickness. Statistical analysis employed descriptive statistics, ANOVA, and Spearman's correlation using SPSS version 27. Results: The cohort demonstrated significant progressive decline in mean eGFR values corresponding to worsening ultrasound grades: 60.7 ± 14.7 mL/min/1.73m2 (Grade 0), 43.2 ± 11 (Grade 1), 26.8 ± 6.1 (Grade 2), and 12.2 ± 6.4 (Grade 3). Cortical echogenicity and corticomedullary differentiation showed particularly strong negative correlations with eGFR (P Conclusion: Our study confirms significant correlations between ultrasound-based renal grading and eGFR in CKD patients. We recommend adopting this grading system in clinical practice alongside serum creatinine and GFR measurements for comprehensive renal assessment. The results serve as valuable baseline data for future research, particularly regarding cases with Grade 3 parameters but normal renal size, which may need inclusion in the grading system.
},
 year = {2025}
}
Copy
|
Download
-
TY  - JOUR
T1  - Comparison of Ultrasound Grading of Renal Parenchymal Disease and Estimated Glomerular Filtration Rate in Chronic Kidney Disease Patients at St. Paul Hospital, Ethiopia

AU  - Yosef Alemayehu Habtegiorgis
AU  - Fanuel Alemayehu Tefera
AU  - Fiyameta Abraham Fissehatsion
AU  - Saron Negasi Gidey
AU  - Simon Zemenfes Hailu
AU  - Elsabeth Alemayehu Haile
AU  - Getahun Worku Alemu
AU  - Bemnet Gossaye Teka
AU  - Medhanet Azene Gebeyehu
Y1  - 2025/09/25
PY  - 2025
N1  - https://doi.org/10.11648/j.rst.20251102.11
DO  - 10.11648/j.rst.20251102.11
T2  - Radiation Science and Technology
JF  - Radiation Science and Technology
JO  - Radiation Science and Technology
SP  - 23
EP  - 32
PB  - Science Publishing Group
SN  - 2575-5943
UR  - https://doi.org/10.11648/j.rst.20251102.11
AB  - Background: Chronic kidney disease (CKD) is a global health burden, with an estimated prevalence of 8–16%. Ultrasound and estimated glomerular filtration rate (eGFR) are critical tools for assessing renal function, but studies evaluating their correlation in Ethiopian populations remain lacking. Existing international studies often utilize limited sample sizes, potentially affecting their generalizability to local contexts. Objective: To compare ultrasound-based renal parenchymal grading with eGFR in CKD patients at a tertiary care center in Addis Ababa, St. Paul’s Hospital Millennium Medical College. Methods: We conducted an institutional cross-sectional study of 235 CKD patients from August 2022 to May 2023. eGFR was calculated using the MDRD formula from serum creatinine values. Standardized ultrasound evaluation assessed cortical echogenicity (graded 0-3 relative to splenic echogenicity), corticomedullary differentiation, renal length, and parenchymal thickness. Statistical analysis employed descriptive statistics, ANOVA, and Spearman's correlation using SPSS version 27. Results: The cohort demonstrated significant progressive decline in mean eGFR values corresponding to worsening ultrasound grades: 60.7 ± 14.7 mL/min/1.73m2 (Grade 0), 43.2 ± 11 (Grade 1), 26.8 ± 6.1 (Grade 2), and 12.2 ± 6.4 (Grade 3). Cortical echogenicity and corticomedullary differentiation showed particularly strong negative correlations with eGFR (P Conclusion: Our study confirms significant correlations between ultrasound-based renal grading and eGFR in CKD patients. We recommend adopting this grading system in clinical practice alongside serum creatinine and GFR measurements for comprehensive renal assessment. The results serve as valuable baseline data for future research, particularly regarding cases with Grade 3 parameters but normal renal size, which may need inclusion in the grading system.

VL  - 11
IS  - 2
ER  -
Copy
|
Download