This work concerns the determination of conditions for optimizing the synthesis of a composite material consisting of activated carbon and iron (III) oxide nanoparticles in order to improve adsorptions properties such as adsorption yield and enthalpy of adsorption of malachite green. A three-point central full factorial design was used for this purpose to evaluate impact of optimal synthesis parameters namely the concentration of iron nitrate, the annealing temperature, the synthesis pH and the citric acid/iron nitrate molar ratio. The existence of interaction between the synthesis parameters increases the effects of the latter on the properties of the composite material obtained. The increase in the concentration and the decrease in the annealing temperature favors an increase in the adsorption yield from 60% to 76%. There is also an increase in the adsorption enthalpy up to values greater than or equal to 40 kJ.mol-1 when there is an increase in the synthesis pH and the iron nitrate concentration simultaneously with the drop in the molar ratio citric acid/iron nitrate and the annealing temperature. Composite material obtained following the optimal conditions: annealing temperature at 400°C, with an ionic iron concentration of 0.150 mol.L-1 at pH 5 and a molar ratio close to 0.250 exhibited an adsorption yield of ~80%, higher than pristine activated carbon (~70%) and an increase in the variation of enthalpy (from -12.010 kJ.mol-1 to 52.612 kJ.mol-1). The results of this work provide a basis from which to effectively functionalize an adsorbent with iron oxide nanoparticles with the aim of having more improved adsorbent properties.
| Published in | Science Journal of Chemistry (Volume 13, Issue 4) |
| DOI | 10.11648/j.sjc.20251304.13 |
| Page(s) | 122-139 |
| Creative Commons |
This is an Open Access article, distributed under the terms of the Creative Commons Attribution 4.0 International License (http://creativecommons.org/licenses/by/4.0/), which permits unrestricted use, distribution and reproduction in any medium or format, provided the original work is properly cited. |
| Copyright |
Copyright © The Author(s), 2025. Published by Science Publishing Group |
Nanoparticles, Optimization, Full Factorial Design, Adsorption Yield, Enthalpy
Factors | Variables | Units | values of levels | ||
|---|---|---|---|---|---|
Hight level | Center | Low level | |||
Iron nitrate concentration | X1 | mol.L-1 | 0.050 | 0.100 | 0.150 |
Annealing temperature | X2 | °C | 400 | 450 | 500 |
Synthesis pH | X3 | - | 1 | 3 | 5 |
Citric acid/iron nitrate molar ratio | X4 | - | 0.250 | 1.125 | 2 |
Run order | Concentration (mol.L-1) | Temperature (°C) | pH | MR | Yield (%) | ΔH (kJ.mol-1) |
|---|---|---|---|---|---|---|
1 | 0.100 | 450 | 3 | 1.125 | 68.650 | 13.380 |
2 | 0.050 | 500 | 1 | 2.000 | 55.290 | 10.280 |
3 | 0.050 | 500 | 1 | 0.250 | 58.780 | 11.390 |
4 | 0.150 | 400 | 5 | 0.250 | 78.350 | 64.925 |
5 | 0.050 | 400 | 1 | 2.000 | 65.420 | 6.800 |
6 | 0.150 | 500 | 5 | 2.000 | 56.960 | 13.260 |
7 | 0.150 | 400 | 1 | 0.250 | 69.690 | 42.088 |
8 | 0.050 | 500 | 5 | 0.250 | 63.720 | 12.470 |
9 | 0.050 | 400 | 5 | 2.000 | 60.860 | 21.991 |
10 | 0.150 | 400 | 5 | 2.000 | 69.350 | 44.300 |
11 | 0.150 | 500 | 1 | 2.000 | 57.720 | 14.730 |
12 | 0.150 | 500 | 1 | 0.250 | 57.640 | 27.056 |
13 | 0.150 | 400 | 1 | 2.000 | 68.610 | 27.558 |
14 | 0.100 | 450 | 3 | 1.125 | 67.230 | 13.410 |
15 | 0.050 | 400 | 5 | 0.250 | 67.750 | 34.560 |
16 | 0.100 | 450 | 3 | 1.125 | 66.670 | 13.400 |
17 | 0.050 | 400 | 1 | 0.250 | 64.260 | 13.400 |
18 | 0.150 | 500 | 5 | 0.250 | 62.120 | 20.709 |
19 | 0.050 | 500 | 5 | 2.000 | 54.270 | 11.510 |
Run order | Yield Experimental | ΔH Experimental | Yield predicted | ΔH predicted | Yield Residual | ΔH Residual |
|---|---|---|---|---|---|---|
1 | 68.650 | 13.380 | 67.536 | 13.392 | 1.113 | -0.012 |
2 | 55.290 | 10.280 | 56.613 | 11.450 | -1.323 | -1.170 |
3 | 58.780 | 11.390 | 57.445 | 10.984 | 1.335 | -0.406 |
4 | 75.350 | 64.925 | 76.333 | 63.118 | 2.016 | 1.806 |
5 | 65.420 | 6.800 | 63.168 | 5.030 | 2.251 | 1.770 |
6 | 56.960 | 13.260 | 55.827 | 13.390 | 1.132 | -0.130 |
7 | 69.690 | 42.088 | 70.939 | 44.158 | -1.249 | -2.070 |
8 | 63.720 | 12.470 | 62.838 | 11.301 | 0.881 | 1.168 |
9 | 60.860 | 21.991 | 61.772 | 23.990 | -0.912 | -1.999 |
10 | 69.350 | 44.300 | 68.712 | 45.330 | 0.637 | -1.030 |
11 | 57.720 | 14.730 | 57.223 | 14.790 | 0.496 | -0.060 |
12 | 57.640 | 27.056 | 58.054 | 24.458 | -0.414 | 2.597 |
13 | 68.610 | 27.558 | 70.108 | 26.370 | -1.498 | 1.188 |
14 | 67.230 | 13.410 | 67.536 | 13.392 | -0.306 | 0.017 |
15 | 67.750 | 34.560 | 69.393 | 33.361 | -1.643 | 1.198 |
16 | 66.670 | 13.400 | 67.536 | 13.392 | -0.866 | 0.007 |
17 | 64.260 | 13.400 | 63.999 | 14.401 | 0.260 | -1.001 |
18 | 62.120 | 20.709 | 63.448 | 23.058 | -1.328 | -2.349 |
19 | 54.270 | 11.510 | 55.217 | 10.050 | -0.947 | 1.460 |
Responses | Ftabulated | Fpredicted | P-values | R2 | R2 adjusted |
|---|---|---|---|---|---|
Yield | 3.220 | 11.310 | 0.000 | 0.960 | 0.961 |
Δ H | 3.010 | 8.610 | 0.001 | 0.991 | 0.991 |
Materials | diffraction Angle (°) | cristallines Phases | Miller Indice |
|---|---|---|---|
AC | 22.943 | NaAlSi3O8 | (1-11) |
23.957 | P2O6 | (002) | |
ACNPS | 16.203 | Acide benzoïque | (20-1) |
20.381 | Mg2P2O7 | (10-2) | |
24.205; 33.100; 35.768; 57.539 | Hématite | (1-12); (1-1-4); (2-10); (42-1) | |
26.591 | Graphite | (003) |
Specific area (m2.g-1) | Median pore with (Å) | Total volume (cm3.g-1) | |
|---|---|---|---|
AC | 312 | 32.797 | 0.202 |
ACNPS | 282 | 24.603 | 0.199 |
Temperature (K) | ΔG (kJ.mol-1) | ΔH (kJ.mol-1) | ΔS (kJ.mol-1.K-1) | |
|---|---|---|---|---|
AC | 303 | -0.307 | -12.010 | 0.033 |
313 | -0.198 | |||
328 | -0.572 | |||
343 | -0.703 | |||
358 | -0.457 | |||
ACNPS | 303 | 0.349 | 52.602 | 0.026 |
313 | 0.581 | |||
328 | -0.818 | |||
343 | -3.132 | |||
358 | -6.171 |
AC | Activated Carbon |
ACNPS | Activated Carbon with Nano Particles |
ANOVA | Analysis of Variance |
BET/BJH | Brunauer-Emmet-Teller and Barrett-Joyner-Hallenda |
CFD | Central Full Design |
DSC | Differential Scanning Calorimetric |
FT-IR | Fourier Transform Infrared |
MG | Malachite Green |
MR | Molar Ratio Chelating Agent/Metal Precursor |
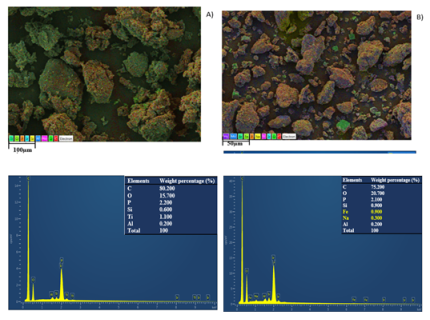
SEM/EDX | Scanning Electronic Microscopy Coupled Energy Dispersive X Ray |
TGA | Thermogravimetric Analysis |
XRD | X Ray Diffraction |
∆ G | Free Enthalpy Variation |
∆ H | Enthalpy Variation |
∆ S | Entropy Variation |
| [1] | El Gaidoumi A., Doña-Rodrıguez J. M., Pulido Melian E. and al., “Mesoporous pyrophyllite-titania nanocomposites: synthesis and activity in phenol photocatalytic degradation.” Research on Chemical Intermediates, vol. 45, no. 2, pp. 333–353, 2018. |
| [2] | Xu P., Zeng G. M., Huang D. L., Feng C. L., Hu S., Zhao M. H., Lai C., Wei Z., Huang C., Xie G. X., Liu Z. F.,”Use of iron oxide nanomaterials in wastewater treatment: a review, Science of The Total Environment.” vol. 424, pp. 1-10, 2012. |
| [3] | Yang S., Xu Y., Sun Y., Zhang G., Gao D., “Size-controlled synthesis, magnetic property, and photocatalytic property of uniform α-Fe2O3 nanoparticles via a facile additive free hydrothermal route.” Cryst Eng Comm, 2012. |
| [4] | Guo S., Zhang G., Guo Y., Yu J. C., “Graphene oxide–Fe2O3 hybrid material as highly efficient heterogeneous catalyst for degradation of organic contaminants.” Carbon, vol. 60, pp. 437-444, 2013. |
| [5] | Chen Y. H., Lin C. C., “Effect of nano-hematite morphology on photocatalytic activity.” Physics and Chemistry of Minerals, vol. 41(10), pp. 727-736, 2014. |
| [6] | Atabaev T. S., “Facile hydrothermal synthesis of flower-like hematite microstructure with high photocatalytic properties.” Journal of Advanced Ceramics, vol. 4(1), pp. 61-64, 2015. |
| [7] | Liang H., Chen W., Wang R., Qi Z., Mi J., Wang Z., “X-shaped hollow α-FeOOH penetration twins and their conversion to α-Fe2O3 nanocrystals bound by high-index facets with enhanced photocatalytic activity.” Chemical Engineering Journal, vol. 274, pp. 224-230, 2015. |
| [8] |
Bencheikh I., Mabrouki J., Azoulay K., Moufti A., El Hajaji S., “Predictive Analytics and Optimization of Wastewater Treatment Efficiency Using Statistic Approach Big Data and Networks Technologies.”
https://doi.org/10.1007/978-3-030-23672-4_22, Chemical Data Collections, 2020. |
| [9] | Khan Y., Durrani S. K., Siddique M. and Mehmood M. “Hydrothermal synthesis of alpha Fe2O3 nanoparticles capped by Tween-80.”, Materials Letters, vol. 14, pp. 2224-2227, 2011. |
| [10] | Cuong N. D., Hoa T. T., Khieu D. Q., Hoa N. D. and Hieu N. V., “Gas sensor based on nanoporous hematite nanoparticles: effect of synthesis pathways on morphology and gas sensing properties.”, Current Applied Physics, vol. 5, pp. 1355-1360, 2012. |
| [11] | Vuong D. D., Phuoc L. H., Hien V. X., Chien N. D., Mater. Sci. Simecon. Proc. Vol. 107, pp. 104861, 2020. |
| [12] | Chekem C. T., Richardson Y., Drobek M., Plantard G., Blin J., Goetz V. “Efective coupling of phenol adsorption and photodegradation at the surface of micro-and mesoporous TiO2-pmactivated carbon materials.” Reac Kinet Mech Cat., vol. 122(2), pp. 1297–1321. |
| [13] | Al-Saad K. A., Amr M., Hadi D. T., Arar R. S., AL-Sulaiti M. M., Abdulmalik T. A., Alsahamary N. M., Kwak J. C., “Iron oxide nanoparticles: applicability for heavy metal removal from contaminated water.” Arab Journal of Nuclear Sciences and Applications, vol. 45(2), pp. 335-346, 2012. |
| [14] | Karami H., “Heavy metal removal from water by magnetite nanorods.” Chemical Engineering Journal, vol. 219, pp. 209-216, 2013. |
| [15] | Shipley H. J., Engates K. E., Grover V. A., “Removal of Pb (II), Cd (II), Cu (II), and Zn (II) by hematite nanoparticles: effect of sorbent concentration, pH, temperature, and exhaustion.” Environmental Science and Pollution Research, vol. 20(3), pp. 1727-1736, 2013. |
| [16] | Akhbarizadeh R., Shayestefar M. R., Darezereshki E., “Competitive removal of metals from wastewater by maghemite nanoparticles: a comparison between simulated wastewater and AMD.” Mine Water and the Environment, vol. 33(1), pp. 89-96, 2014. |
| [17] | Azari A., Nabizadeh R., Hossein A. M, Nasseri S., “Magnetic multi-walled carbon nanotubes loaded alginate for treatment of industrial dye manufacturing effluent: adsorption modelling and process optimisation by central composite face-central design.” International Journal of Environmental Analytical Chemistry, 2021. |
| [18] | Shan C., Ma Z., Tong M., “Efficient removal of trace antimony (III) through adsorption by hematite modified magnetic nanoparticles.” Journal of Hazardous Materials, 268, pp. 229-236, 2014. |
| [19] | Kumari M., Pittman J. R., C. U., Mohan D., “Heavy metals [chromium (VI) and lead (II)] removal from water using mesoporous magnetite (Fe3O4) nanospheres, Journal of colloid and interface science.” vol. 442, pp. 120-132, 2015. |
| [20] | Aydin H., Murat K., Cheshmeh S. R., Alireza K. and Semra K., "Optimization of the adsorption of a textile dye onto nanoclay using a central composite design." Turkish Journal of Chemistry, Vol. 39, No. 4, Article 3. |
| [21] | Ahlam F., Abdelali E. G., Youssef M., Rabea E. M., Anissa L. “Pineapple bark performance in dyes adsorption: optimization by the central composite design.” Hindawi Journal of Chemistry, vol. 2019, pp. 1, 2019. |
| [22] | Asfaram A., Ghaedi M., Agarwalb S., Tyagib I. and Gupta VK. “Removal of basic dye Auramine-O by ZnS: Cu nanoparticles loaded on activated carbon Optimization of parameters using response surface methodology with central composite design.” RSC Adv. Vol. 5, pp. 18438-18450, 2015. |
| [23] | Imane B. S. D. “Optimisation of operative conditions for elimination of dye «Methylene blue» by biosorption: Application of experimental design method.” University A. M. Oulhadj – Bouira, 2020. |
| [24] | Luttah I., Onunga D. O., Shikuku V. O., Otieno B. and Kowenje C. O. “Removal of endosulfan from water by municipal waste incineration fy ash-based geopolymers: Adsorption kinetics, isotherms, and thermodynamics.” Front Environ Chem 4. |
| [25] | Belkacem B. and Aicha Y. “Elimination of acids colorants in aqueous solution by bentonite and kaolin.” C. R. Chimie, vol. 12, 2009. |
| [26] | Nsami N. J. “Textural properties and adsorption characteristics of activated carbon prepared from cola (c. acuminata) nut shells: Application for the elimination of methylene blue from aqueous solution.” University of Yaounde I, pp. 54-55, 2014. |
| [27] | Genç N., Durna E., and Gengeç E. “Heterogeneous Activation of Persulfate by Graphene Oxide-TiO2 Nanosheet for Oxidation of Diclofenac Optimization by Central Composite Design.”, water air soil poll. pp. 229-330, 2018. |
| [28] | Elmoubarki R., Taoufik M., Moufti A., Tounsadi H., Mahjoubi F. Z., Bouabi Y., Qourzal S., Abdennouri M. and Barka N. “Box-Behnken experimental design for the optimization of methylene blue adsorption onto Aleppo pine cones.”, J. Mater. Environ. Sci. Vol. 6, pp, 2184-2191, 2017. |
| [29] | Dagnelie P. “Experimentation principles: Planification of experiences and analysis of their results.” Agronomics Edition Press of Grenoble, A. S. B. L, 2012. |
| [30] | Yahiaoui I. “Experience planes and the analysis of factorials design with two levels and centrals composites design.” course, university of Bejaia, 2015. |
| [31] | Ali I., Sabrina C., Jean-Claude B., Lazhar B., Ammar T., Abdelkrim B., Atef El J., Aymen A., Abdeltif A., and Lotfi M., “Zeolite Waste Characterization and Use as Low-Cost, Ecofriendly, and Sustainable Material for Malachite Green and Methylene Blue Dyes Removal: Box–Behnken Design, Kinetics, and Thermodynamics” Appl. Sci., |
| [32] | Long A., Zhang H., Lei Y., “Surfactant flushing remediation of toluene contaminated soil: optimization with response surface methodology and surfactant recovery by selective oxidation with sulfate radicals.” Separation and Purification Technology, vol. 118, pp. 612–619, 2013. |
| [33] | Dil E. A., Ghaedi M., Asfaram A., Goudarzi A., Hajati S. and Gupta V. K. “Modeling of quaternary dyes adsorption onto ZnO-NR-AC artificial neural network: Analysis by derivative spectrophotometry.”, J and eng chem, vol. 34, pp. 186-197, 2016. |
| [34] | Charmot A. “News strategies of insertion of iron oxides particles in organised meso structures, characterization et catalytic activity.” Catalysis. University of Poitiers, p. 23-32, 2006. |
| [35] | Auffan M. “Metallic oxides nanoparticles: relations between surface reactivity and biological responses.”, Physique [physics]. University Paul Cezanne - Aix-Marseille III, p. 18, 2007. |
| [36] | Mourad M., Rachida H., Frédéric V., and Abdelkader B. “Kinetics and thermodynamics adsorption of phenolic compounds on organic-inorganic hybrid mesoporous material.” International Journal of Innovation and Applied Studies ISSN 2028‐9324 Vol. 3, pp. 1116‐1124, 2013. |
| [37] | Belaid, K. D. and Kacha, S., “Kinetic and thermodynamic study of the adsorption of a basic colorant on the sawdust.” Water science review / Journal of Water Science, 24(2), p. 131–144, 2011. |
| [38] | Mbaye G. “Development of activated carbon from lignocellulosic biomass for application in water treatment”, Intrnational institut of water and environment, 2015. |
| [39] | Torrellas S. A., Lovera R. G., Escalona N., Sepúlveda C., Sotelo J. L. and García J. “Chemical-activated carbons from peach stones for the adsorption of emerging contaminants in aqueous solutions.”, Chemical Engineering Journal, vol. 279, p. 788–798, 2015. |
| [40] | Idohou E. A., Fatomb J. K., Ossen A. S., Agan I., Neumeyer D., Verelst M., Robert Mauricotc R. and Aminoub T. “Preparation of activated carbon/chitosan/Carica papaya seeds composite for efficient adsorption of cationic dye from aqueous solution.” Surfaces and Interfaces, vol. 21, 2020. |
| [41] | Ndongo G. K., Ndi J. N. and Ketcha J. M. “Ferromagnetic activated carbon from cassava (Manihot dulcit) peels activated by iron (III) chloride: Synthesis and characterization.” Bioressource, vol. 15, pp. 20133-20146, 2020. |
| [42] | Tayebeh M., Abbas A., Mazaher A. and Hasan B. “Removal of some cationic dyes from aqueous solutions using magnetic-modified multi-walled carbon nanotubes.” Journal of Hazardous Materials, vol. 196, p. 109–114, 2011. |
| [43] | Fouda M. R., El-Kholy M. B., Moustafa S. A., Hussien A. I., Wahba M. A. and El-Shahat M. F., “Synthesis and characterization of nanosized Fe2O3 pigments.” International Journal of Inorganic Chemistry, 2012. |
| [44] | Karima A., Imane B., Ahmed M., Abdelmalek D., Jamal M. and Souad E. “comparative study between static and dynamic adsorption efficiency of dyes by the mixture of palm waste using the central composite design”, Chemical Data Collections, |
| [45] | Lamia B. “Macroscopic and spectroscopic study of ions phosphate fixation on iron oxyhydroxides- Application on aquatics sediments.” University of Mentoury, Thesis p. 36, 2017. |
| [46] | Dolasa H., Sahinb O., Sakac C., Demirb H., “A new method on producing high surface area activated carbon: The effect of salton the surface area and the pore size distribution of activated carbon prepared from pistachio shell.”, Chemical Engineering Journal, vol. 166: p. 191–197, 2011. |
| [47] | Hadoun H., Sadaoui Z., Souami N., Sahel D. and Toumert I. “Characterization of mesoporous carbon prepared from date stems by H3PO4 chemical activation.” Appl Surf Sci., vol. 13, pp. 745– 749. |
| [48] | Zhang X., Ningyum S., Baojian W., Yi L., Tianzheng G. and Wei W. “Physical characterisation of lansoprazole/PVP solid dispersion porepared by fluid-bed coating technique.” science direct, vol. 182, p. 480-485, 2008. |
| [49] | Aarfane A., Salhi A., El Krati M., Tahiri S., Monkade M., Lhadi E. K. and Bensitel M. “Kinetic and thermodynamic study of the adsorption of Red195 and Methylene blue dyes on fly ash and bottom ash in aqueous medium”, J. Mater. Environ. Sci. pp. 1927-1939, 2014. |
APA Style
Lincold, N. M., Jules, M. L., Guy, N. P., Jacques, M. B., Shikuku, V., et al. (2025). Optimization of the Synthetic Procedure for Functionalizing Activated Carbon Produced from Canarium Ovatum with Iron Oxide Nanoparticles Toward Effective Adsorption Using a Central Full Factorial Design. Science Journal of Chemistry, 13(4), 122-139. https://doi.org/10.11648/j.sjc.20251304.13
ACS Style
Lincold, N. M.; Jules, M. L.; Guy, N. P.; Jacques, M. B.; Shikuku, V., et al. Optimization of the Synthetic Procedure for Functionalizing Activated Carbon Produced from Canarium Ovatum with Iron Oxide Nanoparticles Toward Effective Adsorption Using a Central Full Factorial Design. Sci. J. Chem. 2025, 13(4), 122-139. doi: 10.11648/j.sjc.20251304.13
AMA Style
Lincold NM, Jules ML, Guy NP, Jacques MB, Shikuku V, et al. Optimization of the Synthetic Procedure for Functionalizing Activated Carbon Produced from Canarium Ovatum with Iron Oxide Nanoparticles Toward Effective Adsorption Using a Central Full Factorial Design. Sci J Chem. 2025;13(4):122-139. doi: 10.11648/j.sjc.20251304.13
@article{10.11648/j.sjc.20251304.13,
  author = {Nintedem Magapgie Lincold and Mabou Leuna Jules and Ngassa Piegang Guy and Mbouombouo Bomiko Jacques and Victor Shikuku and Gerard Pierre Tchieta},
  title = {Optimization of the Synthetic Procedure for Functionalizing Activated Carbon Produced from Canarium Ovatum with Iron Oxide Nanoparticles Toward Effective Adsorption Using a Central Full Factorial Design
},
  journal = {Science Journal of Chemistry},
  volume = {13},
  number = {4},
  pages = {122-139},
  doi = {10.11648/j.sjc.20251304.13},
  url = {https://doi.org/10.11648/j.sjc.20251304.13},
  eprint = {https://article.sciencepublishinggroup.com/pdf/10.11648.j.sjc.20251304.13},
  abstract = {This work concerns the determination of conditions for optimizing the synthesis of a composite material consisting of activated carbon and iron (III) oxide nanoparticles in order to improve adsorptions properties such as adsorption yield and enthalpy of adsorption of malachite green. A three-point central full factorial design was used for this purpose to evaluate impact of optimal synthesis parameters namely the concentration of iron nitrate, the annealing temperature, the synthesis pH and the citric acid/iron nitrate molar ratio. The existence of interaction between the synthesis parameters increases the effects of the latter on the properties of the composite material obtained. The increase in the concentration and the decrease in the annealing temperature favors an increase in the adsorption yield from 60% to 76%. There is also an increase in the adsorption enthalpy up to values greater than or equal to 40 kJ.mol-1 when there is an increase in the synthesis pH and the iron nitrate concentration simultaneously with the drop in the molar ratio citric acid/iron nitrate and the annealing temperature. Composite material obtained following the optimal conditions: annealing temperature at 400°C, with an ionic iron concentration of 0.150 mol.L-1 at pH 5 and a molar ratio close to 0.250 exhibited an adsorption yield of ~80%, higher than pristine activated carbon (~70%) and an increase in the variation of enthalpy (from -12.010 kJ.mol-1 to 52.612 kJ.mol-1). The results of this work provide a basis from which to effectively functionalize an adsorbent with iron oxide nanoparticles with the aim of having more improved adsorbent properties.},
 year = {2025}
}
TY  - JOUR
T1  - Optimization of the Synthetic Procedure for Functionalizing Activated Carbon Produced from Canarium Ovatum with Iron Oxide Nanoparticles Toward Effective Adsorption Using a Central Full Factorial Design

AU  - Nintedem Magapgie Lincold
AU  - Mabou Leuna Jules
AU  - Ngassa Piegang Guy
AU  - Mbouombouo Bomiko Jacques
AU  - Victor Shikuku
AU  - Gerard Pierre Tchieta
Y1  - 2025/08/13
PY  - 2025
N1  - https://doi.org/10.11648/j.sjc.20251304.13
DO  - 10.11648/j.sjc.20251304.13
T2  - Science Journal of Chemistry
JF  - Science Journal of Chemistry
JO  - Science Journal of Chemistry
SP  - 122
EP  - 139
PB  - Science Publishing Group
SN  - 2330-099X
UR  - https://doi.org/10.11648/j.sjc.20251304.13
AB  - This work concerns the determination of conditions for optimizing the synthesis of a composite material consisting of activated carbon and iron (III) oxide nanoparticles in order to improve adsorptions properties such as adsorption yield and enthalpy of adsorption of malachite green. A three-point central full factorial design was used for this purpose to evaluate impact of optimal synthesis parameters namely the concentration of iron nitrate, the annealing temperature, the synthesis pH and the citric acid/iron nitrate molar ratio. The existence of interaction between the synthesis parameters increases the effects of the latter on the properties of the composite material obtained. The increase in the concentration and the decrease in the annealing temperature favors an increase in the adsorption yield from 60% to 76%. There is also an increase in the adsorption enthalpy up to values greater than or equal to 40 kJ.mol-1 when there is an increase in the synthesis pH and the iron nitrate concentration simultaneously with the drop in the molar ratio citric acid/iron nitrate and the annealing temperature. Composite material obtained following the optimal conditions: annealing temperature at 400°C, with an ionic iron concentration of 0.150 mol.L-1 at pH 5 and a molar ratio close to 0.250 exhibited an adsorption yield of ~80%, higher than pristine activated carbon (~70%) and an increase in the variation of enthalpy (from -12.010 kJ.mol-1 to 52.612 kJ.mol-1). The results of this work provide a basis from which to effectively functionalize an adsorbent with iron oxide nanoparticles with the aim of having more improved adsorbent properties.
VL  - 13
IS  - 4
ER  -
Department of Chemistry, Faculty of Science, University of Douala, Douala, Cameroon
Department of Chemistry, Faculty of Science, University of Douala, Douala, Cameroon
Department of Chemistry, Faculty of Science, University of Douala, Douala, Cameroon
Department of Chemistry, Faculty of Science, University of Douala, Douala, Cameroon
Department of Physical Sciences, Kaimosi Friends University, Kaimosi, Kenya
Department of Chemistry, Faculty of Science, University of Douala, Douala, Cameroon
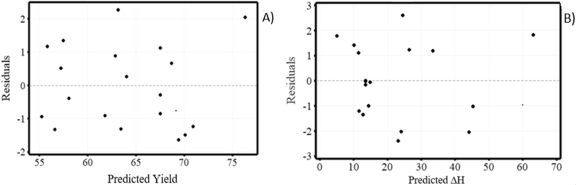
Figure 1. Distribution of residues for Yield response (A); ΔH (B).
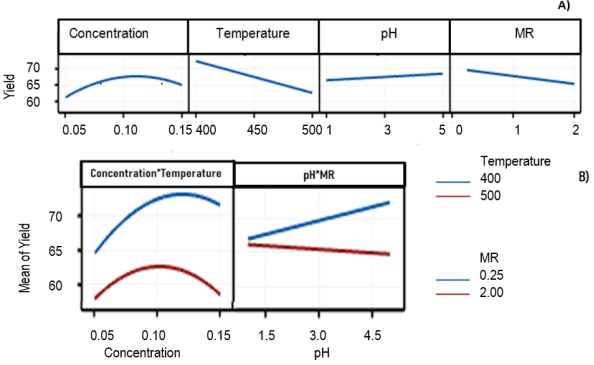
Figure 2. Effect of variables (A) and interactions (B) on yield.
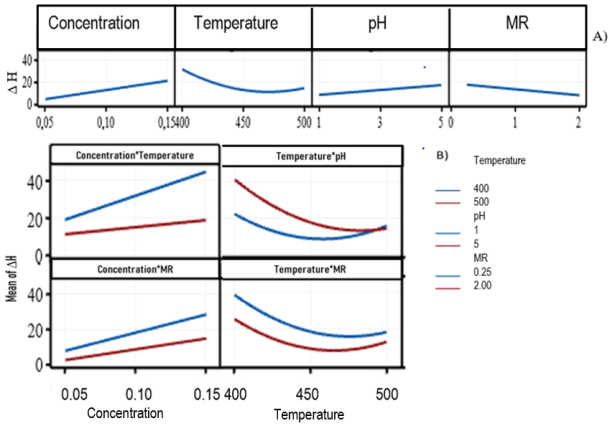
Figure 3. Effect of variables (A) and interactions (B) on ΔH.
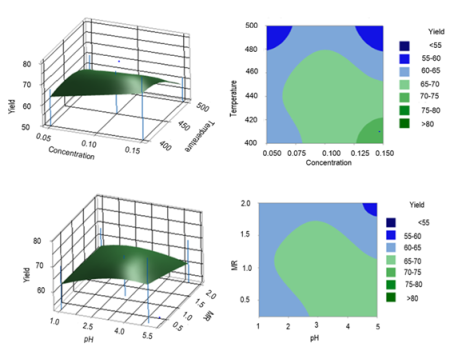
Figure 4. Responses surfaces and Contour plot of yield as a function of the variables studied.
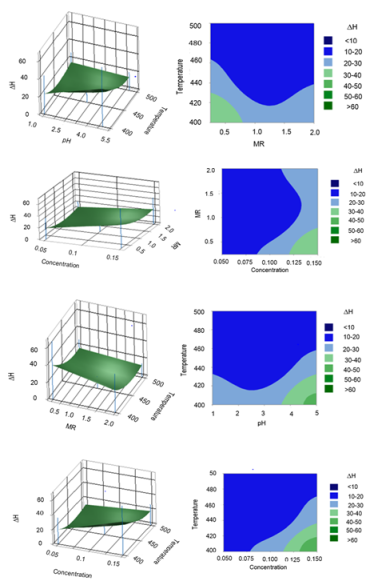
Figure 5. Responses surfaces and Contour plots of ΔH according to the studied variables.
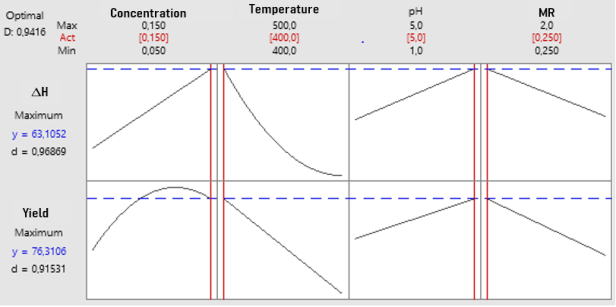
Figure 6. Optimal conditions.
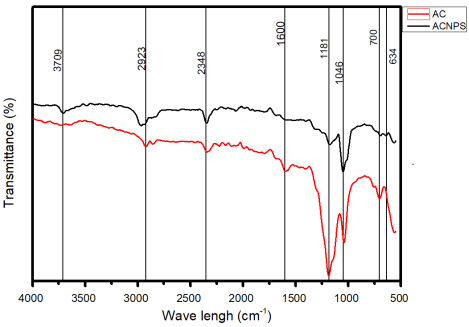
Figure 7. FT-IR spectra of AC and ACNP.
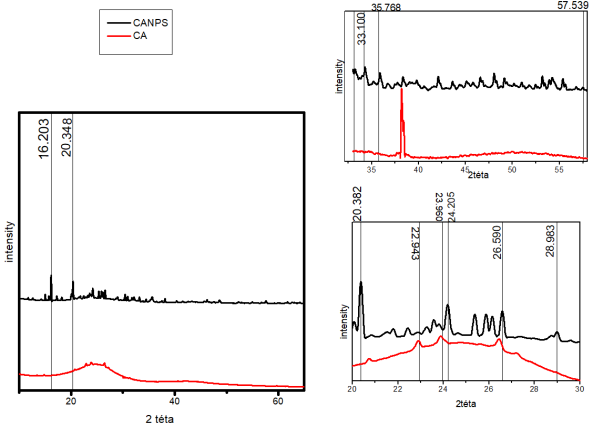
Figure 8. Diffractogram of material.
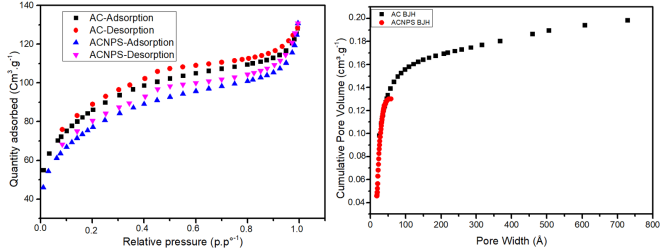
Figure 9. The N2 adsorption-desorption isotherms and pores size distribution.
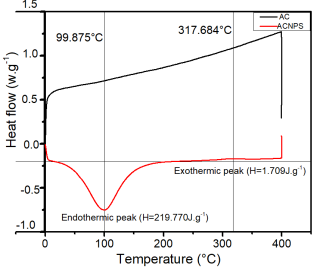
Figure 11. DSC curves of AC and ACNPS.
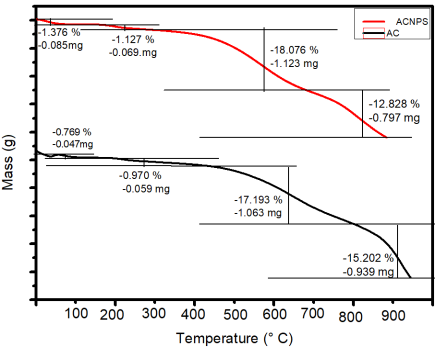
Figure 12. Thermogravimetric pot of AC and ACNPS.
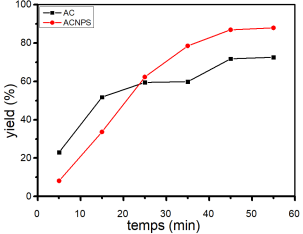
Figure 13. Evolution of the removal yield.
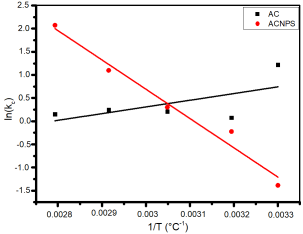
Figure 14. Thermodynamic regression linear.
Information

