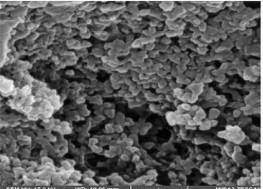
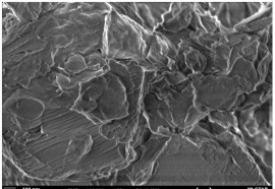
Absorption, emission, time resolved fluorescence spectra and molecular modelling of 2-anisidine (2AS) with α-CD and β-CD in pH~2, pH~7 and pH~11 solutions were examined. Cu: 2AS: CD nanomaterials were investigated by SEM, DSC, FTIR, XRD and 1H NMR techniques. The absorption and emission maxima and spectral shape of 2AS in all the pH solutions and solvents are different from each other. 2AS gave a single broad emission spectrum in all the solvents while dual emission noticed at pH~11. The lifetimes of the inclusion complexes were longer than that of the free 2AS molecule. The geometrical restriction of the α-CD cavity likely limits the free rotation of the amino and methoxy groups, thereby enhancing the emission intensity. The calculated HOMO–LUMO energy gap, total energy, free energy, enthalpy, entropy, dipole moment, and zero-point vibrational energy of the CD: 2AS complex differed significantly from those of the isolated 2AS, α-CD and β-CD molecules, and both the vertical and horizontal bond lengths between the amino and methoxy groups are smaller than the β-CD cavity size confirming the formation of an inclusion complex. In FTIR, most of the peaks are not appeared and a substantial decrease in intensity was noted in the Cu: 2AS: CD nano. The chemical shift value of 2AS protons are shifts to up field and down field and the peak intensities are very low in the nano copper with CD nanomaterials. SEM image of the nanomaterials are different from isolated 2AS molecule.
| Published in | Science Journal of Chemistry (Volume 14, Issue 2) |
| DOI | 10.11648/j.sjc.20261402.11 |
| Page(s) | 38-48 |
| Creative Commons |
This is an Open Access article, distributed under the terms of the Creative Commons Attribution 4.0 International License (http://creativecommons.org/licenses/by/4.0/), which permits unrestricted use, distribution and reproduction in any medium or format, provided the original work is properly cited. |
| Copyright |
Copyright © The Author(s), 2026. Published by Science Publishing Group |
2-Anisidine, Copper Nano, Cyclodextrin, Inclusion Complex, Nanomaterials
Concentration of α-CD x10-3 mol/dm3 | pH - 2.0 | pH - 7 | pH - 11 | |||||||||
|---|---|---|---|---|---|---|---|---|---|---|---|---|
abs | log | flu | τ | abs | log | flu | τ | abs | log | flu | τ | |
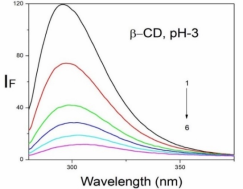
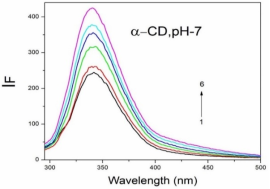
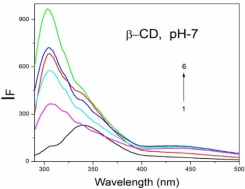
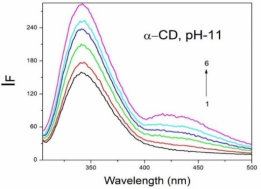
2AS only (without CD) | 269 215 | 2.38 | 297 | 0.59 | 282 231 | 3.53 | 342 | 0.61 | 282 231 | 3.41 | 341 300 | - 0.54 |
0.002 mol/dm3 α-CD | 269 215 | 3.43 | 295 | 0.65 | 282 232 | 3.54 | 340 | 0.68 | 282 232 | 3.41 | 438 344 300 | 0.67 0.14 |
0.01 mol/dm3 α-CD | 269 215 | 3.41 | 296 | 0.80 | 283 233 | 3.59 | 340 | 0.82 | 283 231 | 3.40 | 438 342 | 0.82 0.24 |
0.002 mol/dm3 β-CD | 268 215 | 3.41 | 297 | 0.68 | 279 232 | 3.45 | 440 306 | 0.76 0.14 | 282 233 | 3.41 | 440 344 | 0.70 0.16 |
0.01 mol/dm3 β-CD | 269 216 | 3.47 | 305 | 0.87 | 273 214 | 3.36 | 440 306 | 0.86 0.24 | 283 232 | 3.47 | 440 354 | 0.89 0.26 |
α-CD- K (1: 1) x105 dm3/mol | 89 | 278 | 62 | 229 | 88 | 124 | ||||||
β-CD- K (1: 1) x105 dm3/mol | 140 | 388 | 133 | 597 | 94 | 357 | ||||||
α-CD- G (kJmol-1) | -47.28 | -59.41 | -43.51 | -57.32 | -47.28 | -48.53 | ||||||
β-CD- G (kJmol-1) | -52.3 | -63.18 | -51.46 | -67.36 | -48.12 | -61.92 | ||||||
Excitation wavelength (nm) | 260 | 280 | 270 | |||||||||
Properties | 2AS | α-CD | β-CD | 2AS: α-CD | 2AS: β-CD |
|---|---|---|---|---|---|
EHOMO (eV) | -8.13 | -10.38 | -10.35 | -7.92 | -7.99 |
ELUMO (eV) | 0.34 | 1.26 | 1.23 | 0.52 | 0.63 |
EHOMO – ELUMO (eV) | -8.47 | -11.63 | -11.58 | -8.44 | -8.62 |
Dipole moment (D) | 2.03 | 11.34 | 12.29 | 11.69 | 11.97 |
E (k J/mol) | -65.06 | -5219.62 | -6098.72 | -5407.86 | -6001.36 |
E (k J/mol) | -121.04 | -25.86 | |||
G (k J/mol) | 270.45 | -2388.39 | -2793.03 | 2604.21 | 3125.11 |
ΔG (k J/mol) | -485.34 | -602.50 | |||
H (k J/mol) | 385.35 | -2829.93 | -3303.35 | 3059.55 | 3528.87 |
ΔH (k J/mol) | -614.96 | -610.86 | |||
S (k J/mol) | 0.385 | 1.477 | 1.711 | 1.782 | 1.887 |
ΔS (k J/mol) | -0.079 | -0.210 | |||
ZPE* | 69.96 | 635.09 | 740.56 | 703.46 | 808.36 |
Mullikan charge | 0.00 | 0.00 | 0.00 | 0.00 | 0.00 |
Protons | 2AS (δ) | Cu: 2AS: α-CD | Cu: 2AS: β-CD |
|---|---|---|---|
Ha - para to OCH3 | 6.76 | 8.27 | 8.29 |
Hb -ortho to OCH3 | 6.74 | 5.69 | 5.71 |
Hc –Meta to OCH3 | 6.70 | 4.79 | 4.81 |
Hd –ortho to NH2 | 6.65 | 4.46 | 4.48 |
He -OCH3 | 3.77 | 2.48 | 2.50 |
Hf - NH2 | 3.70 | 2.05 | 2.07 |
FTIR | Fourier Transform Infrared Spectroscopy |
DTA | Differential Thermal Analysis |
XRD | X-ray Diffraction |
SEM | Scanning Electron Microscopy |
HOMO | Highest Occupied Molecular Orbital |
LUMO | Lowest Unoccupied Molecular Orbital |
2AS | 2-Anisidine |
Ag NPs | Silver Nanoparticles |
α-CD | Alpha Cyclodextrin |
β-CD | Beta Cyclodextrin |
PM3 | Parametric Method 3 |
ΔE | Iinternal Energy Change |
ΔH | Enthalpy Change |
ΔG | Free Energy Change |
ΔS | Entropy Change |
| [1] | S. Akkın, G. Varan, D. Aksüt, M. Malanga, A. Ercan, M. Şen, et al., A different approach to immunochemotherapy for colon cancer: Development of nanoplexes of cyclodextrins and interleukin-2 loaded with 5-FU, Int. J. Pharm. 623 (2022) 121940. |
| [2] | N. A. Alhakamy, S. M. Badr-Eldin, O. A. A. Ahmed, H. M. Aldawsari, S. Z. Okbazghi, M. A. Alfaleh, et al., Green nanoemulsion stabilized by in situ self-assembled natural oil/native cyclodextrin complexes: An eco-friendly approach for enhancing anticancer activity of costunolide against lung cancer cells, Pharmaceutics 14 (2022) 227. |
| [3] | K. Zheng, X. Liu, H. Liu, D. Dong, L. Li, L. Jiang, et al., Novel pH-triggered doxorubicin-releasing nanoparticles self-assembled by functionalized β-cyclodextrin and amphiphilic phthalocyanine for anticancer therapy, ACS Appl. Mater. Interfaces 13 (2021) 10674-10688. |
| [4] | Y. Zhang, X. Li, X. Chen, Y. Zhang, Y. Deng, Y. Yu, et al., Construction of ultrasmall gold nanoparticles based contrast agent via host-guest interaction for tumor-targeted magnetic resonance imaging, Mater. Des. 217 (2022) 110620. |
| [5] | R. Zhang, X. You, M. Luo, X. Zhang, Y. Fang, H. Huang, et al., Poly (β-cyclodextrin)/platinum prodrug supramolecular nano system for enhanced cancer therapy: Synthesis and in vivo study, Carbohydr. Polym. 292 (2022) 119695. |
| [6] | Y. Yuan, T. Nie, Y. Fang, X. You, H. Huang, J. Wu, Stimuli-responsive cyclodextrin-based supramolecular assemblies as drug carriers, J. Mater. Chem. B 10 (2022) 2077-2096. |
| [7] | H. M. Ameen, S. Kunsági-Máté, L. Szente, B. Lemli, Encapsulation of sulfamethazine by native and randomly methylated β-cyclodextrins: The role of the dipole properties of guests. Spectrochim. Acta A 225 (2020) 117475. |
| [8] | M. Jamrógiewicz, K. Milewska, Sacharides and their derivatives as pharmaceutical additives Spectrochim. Acta A 219 (2019) 346. |
| [9] | M. A. Chouker, H. Abdallah, A. Zeiz, M. H. El-Dakdouki, Host-guest inclusion complex of quinoxaline-1, 4-dioxide derivative with 2-hydroxypropyl-β-cyclodextrin: Preparation, characterization, and antibacterial activity. J. Mol. Struct. (2021) 130273. |
| [10] | M. Levine, B. R. Smith, Tuning fluorescence energy transfer for carcinogen detection and medical diagnostics. J. Fluoresc. 30 (2020) 1015. |
| [11] | I. Lafifi, L. Nouar, F. Madi, A. Guendouzi, M. Cheriet, N. Boulaha, B. Houari, Computational study of inclusion complex of L-Glutamine/β-Cyclodextrin: Electronic and intermolecular interactions investigations. J. Mol. Struct. 1206 (2020) 127740. |
| [12] | M. Akhondi, E. Jamalizadeh, A. Mohebbi, MD and DFT calculations on the structural variations of amino-cyclodextrin as a pH-sensitive carrier for smart carriage and release of Doxorubicin. J. Mol. Struct. 1230 (2021) 129855. |
| [13] | A. Obaid, A. Khairani, M. Jamil, S. Prabu, S. M. Saharin, S. Mohamad, Spectroscopic studies for the inclusion complexation of ketoprofen enantiomers with β-cyclodextrin. Spectrochim. Acta A 225 (2020) 118674. |
| [14] | Gu Alice, Wheate Nial, Macrocycles as drug-enhancing excipients in pharmaceutical formulations, J. Incl. Phenom. Macrocycl. Chem. 100 (2021) 55-69. |
| [15] | Hui He, Chuchu Xie, Liu Yao, Ge Ning, Yonghong Wang, A novel β-cyclodextrin functionalized fluorescent probe for selective detection of metal ions in aqueous solution, J. Fluoresc. 31 (2021) 63-71. |
| [16] | S. Das, Fluorescence quenching studies in inclusion complexes, Chem. Phys. Lett. 361 (2002) 21-26. |
| [17] | P. R. Sainz-Rozas, J. R. Isasi, M. Sánchez, G. Tardajos, G. González-Gaitano, Host-guest complexation studies of cyclodextrins with fluorescent probes, J. Phys. Chem. A 108 (2004) 392-401. |
| [18] | M. S. Matos, M. H. Gehlen, Photophysical characterization of inclusion complexes of fluorescent dyes with cyclodextrins, Spectrochim. Acta A Mol. Biomol. Spectrosc. 60 (2004) 1421-1427. |
| [19] | S. Shaomin, Y. Yu, P. Jinghao, Analytical application of fluorescence quenching by cyclodextrin inclusion, Anal. Chim. Acta 457 (2002) 305-312. |
| [20] | G. González-Gaitano, P. R. Sainz-Rozas, J. R. Isasi, M. Sánchez, G. Tardajos, Inclusion complexation studies of cyclodextrins with aromatic guests, J. Phys. Chem. A 108 (2004) 392-401. |
| [21] | A. Mani, P. Ramasamy, A. Antony Muthu Prabhu, N. Rajendiran, Investigation of Ag and Ag/Co bimetallic nanoparticles with naproxen-cyclodextrin inclusion complex, J. Mol. Struct. 1284 (2023) 135301. |
| [22] | A. Mani, G. Venkatesh, P. Senthilraja, N. Rajendiran, Synthesis and characterisation of Ag-Co-Venlafaxine-cyclodextrin nanorods, Eur. J. Adv. Chem. Res. 5 (2024) 9-16. |
| [23] | A. Mani, P. Ramasamy, A. Antony Muthu Prabhu, P. Senthilraja, N. Rajendiran, Synthesis and analysis of Ag/Olanzapine/cyclodextrin and Ag/Co/Olanzapine/cyclodextrin inclusion complex nanorods, Phys. Chem. Liq. 62 (2024) 196-209. |
| [24] | A. Mani, P. Ramasamy, A. Antony Muthu Prabhu, P. Senthilraja, N. Rajendiran, Synthesis and characterisation of Ag/Co/Chloroquine/cyclodextrin inclusion complex nanomaterials, J. Sol-Gel Sci. Technol. 115 (2025) 844-856. |
| [25] | N. Rajendiran, A. Mani, M. Venkatesan, B. Sneha, E. Nivetha, P. Senthilraja, Spectral, microscopic, antibacterial and anticancer activity of pyrimethamine drug with Ag nano, DNA, RNA, BSA, dendrimer and cyclodextrins, J. Solution Chem. (In press). |
| [26] | T. Stalin, P. Vasantharani, B. Shanthi, A. Sekar, N. Rajendiran, Inclusion complex of 1, 2, 3-trihydroxybenzene with α- and β-cyclodextrins, Indian J. Chem. A 45 (2006) 1113-1120. |
| [27] | R. K. Sankaranarayanan, S. Siva, A. Antony Muthu Prabhu, N. Rajendiran, Inclusion complexation of 3, 4, 5-trihydroxybenzoic acid with β-cyclodextrin at different pH, J. Incl. Phenom. Macrocycl. Chem. 67 (2010) 461-470. |
| [28] | R. K. Sankaranarayanan, A. Antony Muthu Prabhu, N. Rajendiran, Inclusion complexation of 3, 5-dihydroxybenzoic acid with β-cyclodextrin at different pH, Indian J. Chem. A 48 (2009) 1515-1521. |
| [29] | J. Prema Kumari, A. Antony Muthu Prabhu, G. Venkatesh, V. K. Subramanian, N. Rajendiran, Spectral characteristics of sulfadiazine and sulfisomidine: effect of solvents, pH and β-cyclodextrin, Phys. Chem. Liq. 49 (2011) 108-132. |
| [30] | N. Rajendiran, S. Siva, J. Saravanan, Inclusion complexation of sulfapyridine with α- and β-cyclodextrins: spectral and molecular modeling study, J. Mol. Struct. 1054-1055 (2013) 215-222. |
| [31] | N. Rajendiran, R. K. Sankaranarayanan, Azo dye/cyclodextrin: new findings of identical nanorods through 2: 2 inclusion complexes, Carbohydr. Polym. 106 (2014) 422-431. |
| [32] | N. Rajendiran, R. K. Sankaranarayanan, J. Saravanan, Supramolecular host-guest interaction of dothiepin and doxepin drugs with cyclodextrin macrocycles, J. Mol. Struct. 1067 (2014) 252-260. |
| [33] | A. Antony Muthu Prabhu, N. Rajendiran, Encapsulation of labetalol and pseudoephedrine in β-cyclodextrin cavity: spectral and molecular modeling studies, J. Fluoresc. 22 (2012) 1461-1474. |
| [34] | N. Rajendiran, G. Venkatesh, J. Saravanan, Supramolecular aggregates formed by sulfadiazine and sulfisomidine inclusion complexes with α- and β-cyclodextrin, Spectrochim. Acta A 129 (2014) 157-162. |
| [35] | N. Rajendiran, G. Venkatesh, T. Mohandoss, Fabrication of 2D nanosheet through self-assembly behavior of sulfamethoxypyridazine inclusion complex with α- and β-cyclodextrins, Spectrochim. Acta A 123 (2014) 158-166. |
| [36] | R. S. Sarpal, S. K. Dogra, Prototropism in aminophenols and anisidines: a reinvestigation, J. Photochem. 38 (1987) 263-276. |
| [37] | N. Rajendiran, R. K. Sankaranarayanan, G. Venkatesh, Excimer emission in inclusion complexes of dibenzofuran and 5-dibenzosuberenone with α- and β-cyclodextrins, Bull. Chem. Soc. Jpn. 87 (2014) 797-808. |
| [38] | N. Rajendiran, T. Mohandoss, J. Thulasidhasan, Excimer emission in norepinephrine and epinephrine drugs with α- and β-cyclodextrins: spectral and molecular modeling studies, J. Fluoresc. 24 (2014) 1003-1014. |
| [39] | A. Antony Muthu Prabhu, G. Venkatesh, N. Rajendiran, Unusual spectral shifts of imipramine and carbamazepine drugs, J. Fluoresc. 20 (2010) 1199-1210. |
| [40] | A. Anton Smith, K. Kannan, R. Manavalan, N. Rajendiran, Intramolecular charge transfer effects on flutamide drug, J. Fluoresc. 20 (2010) 809-820. |
| [41] | P Ramasamy, A Mani, B Sneha, E Nivetha, M Venkatesan, N Rajendiran, Azo-hydrazo tautomerism in Sudan Red-B and Cyclodextrin/ Sudan Red-B doped ZnO nanomaterials. J Molecular Structure 1329 (2025) 141423-32. |
| [42] | P. Ramasamy, A. Mani, B. Sneha, E. Nivetha, A. Antony Muthu Prabhu, G. Venkatesh, N. Rajendiran,* Synthesis and Characterisation of Sudan Red-G/Cyclodextrin doped ZnO Nanocrystals. American J Physical Chemistry 14 (2025) 23-32, |
| [43] | P. Ramasamy, A. Mani, B. Sneha, E. Nivetha, A. Antony Muthu Prabhu, G. Venkatesh, P. Senthilraja, N. Rajendiran*, Synthesis and Characterisation of Cyclodextrin /Methyl Violet doped ZnO Nanocrystals. Colloid and Surface Science 9 (2025) 19-30, |
| [44] | P. Ramasamy, A. Mani, B. Sneha, E. Nivetha, A. Antony Muthu Prabhu, G. Venkatesh, P. Senthilraja, N. Rajendiran*, Synthesis and Characterisation of Cyclodextrin/ Sudan Black-B Caped ZnO/ Nanocrystals. American J Quantum Chemistry and Molecular Spectroscopy 9 (2025) 1-11, |
| [45] | P. Ramasamy, A. Mani, A. Antony Muthu Prabhu, G. Venkatesh, N. Rajendiran* Azo-Imino Tautomerism in Sudan Red 7B/Cyclodextrin Coated ZnO Nanocomposites: Evidence by Spectral and Microscopic Perspectives. Science Journal of Chemistry 13 (2025) 65 - 75, |
| [46] | P. Ramasamy, A. Mani, A. Antony Muthu Prabhu, G. Venkatesh, P. Senthilraja, N. Rajendiran* PICT Effects and Anticancer Potential on Rosaniline and Spectral Characterisation of Rosaniline/Cyclodextrin Covered ZnO/ Nanocrystals. International J. Pure and Applied Chemistry 26 (2025) 107-121, |
| [47] | P. Ramasamy, A. Mani, P. Senthilraja, N. Rajendiran Keto-Enol Tautomerism and Anticancer Potential on Sudan Blue II and Synthesis and Characterisation of Sudan Blue II/ Cyclodextrin doped ZnO Nanocrystals, J. Materials Science and Nanotechnology, 13 (2025) 1-16. |
| [48] | P. Ramasamy, A. Mani, P. Senthilraja, N. Rajendiran, Spectral, Microscopic and Anticancer Activity Investigation on Dimethyl Yellow/Cyclodextrin Doped ZnO Nanocomposites Journal of Chemical and Pharmaceutical Sciences (JCHPS) 18 (3) (2025) 33-43. |
| [49] | P. Ramasamy, A. Mani, P. Senthilraja, N. Rajendiran, Spectral Characteristics of ZnO/Mordent Yellow 12/ Cyclodextrin Nanomaterials, J Chemical Health Risks, (JCHR) 15 (2025) 542-553, |
| [50] | P. Ramasamy, A. Mani, P. Senthilraja, S. Senthilmurugan, N. Rajendiran, Spectral, Microscopic and Anticancer Activity of 1, 8-Diaminonaphthalene Doped ZnO Nanocrystals, VVIJOURNAL 14 (2026) 135-147, |
APA Style
Rajendiran, N., Mani, A., Ramasamy, P., Senthilmurugan, S. (2026). Synthesis of Copper: 2-Anisidine: Cyclodextrin Nanomaterials and Characterization of 2-Anisidine–Cyclodextrin Inclusion Complexes at Various pH Conditions. Science Journal of Chemistry, 14(2), 38-48. https://doi.org/10.11648/j.sjc.20261402.11
ACS Style
Rajendiran, N.; Mani, A.; Ramasamy, P.; Senthilmurugan, S. Synthesis of Copper: 2-Anisidine: Cyclodextrin Nanomaterials and Characterization of 2-Anisidine–Cyclodextrin Inclusion Complexes at Various pH Conditions. Sci. J. Chem. 2026, 14(2), 38-48. doi: 10.11648/j.sjc.20261402.11
@article{10.11648/j.sjc.20261402.11,
  author = {Narayanasamy Rajendiran and Ayyadurai Mani and Palanichamy Ramasamy and Sengamalai Senthilmurugan},
  title = {Synthesis of Copper: 2-Anisidine: Cyclodextrin Nanomaterials and Characterization of 2-Anisidine–Cyclodextrin Inclusion Complexes at Various pH Conditions},
  journal = {Science Journal of Chemistry},
  volume = {14},
  number = {2},
  pages = {38-48},
  doi = {10.11648/j.sjc.20261402.11},
  url = {https://doi.org/10.11648/j.sjc.20261402.11},
  eprint = {https://article.sciencepublishinggroup.com/pdf/10.11648.j.sjc.20261402.11},
  abstract = {Absorption, emission, time resolved fluorescence spectra and molecular modelling of 2-anisidine (2AS) with α-CD and β-CD in pH~2, pH~7 and pH~11 solutions were examined. Cu: 2AS: CD nanomaterials were investigated by SEM, DSC, FTIR, XRD and 1H NMR techniques. The absorption and emission maxima and spectral shape of 2AS in all the pH solutions and solvents are different from each other. 2AS gave a single broad emission spectrum in all the solvents while dual emission noticed at pH~11. The lifetimes of the inclusion complexes were longer than that of the free 2AS molecule. The geometrical restriction of the α-CD cavity likely limits the free rotation of the amino and methoxy groups, thereby enhancing the emission intensity. The calculated HOMO–LUMO energy gap, total energy, free energy, enthalpy, entropy, dipole moment, and zero-point vibrational energy of the CD: 2AS complex differed significantly from those of the isolated 2AS, α-CD and β-CD molecules, and both the vertical and horizontal bond lengths between the amino and methoxy groups are smaller than the β-CD cavity size confirming the formation of an inclusion complex. In FTIR, most of the peaks are not appeared and a substantial decrease in intensity was noted in the Cu: 2AS: CD nano. The chemical shift value of 2AS protons are shifts to up field and down field and the peak intensities are very low in the nano copper with CD nanomaterials. SEM image of the nanomaterials are different from isolated 2AS molecule.},
 year = {2026}
}
TY  - JOUR
T1  - Synthesis of Copper: 2-Anisidine: Cyclodextrin Nanomaterials and Characterization of 2-Anisidine–Cyclodextrin Inclusion Complexes at Various pH Conditions
AU  - Narayanasamy Rajendiran
AU  - Ayyadurai Mani
AU  - Palanichamy Ramasamy
AU  - Sengamalai Senthilmurugan
Y1  - 2026/04/10
PY  - 2026
N1  - https://doi.org/10.11648/j.sjc.20261402.11
DO  - 10.11648/j.sjc.20261402.11
T2  - Science Journal of Chemistry
JF  - Science Journal of Chemistry
JO  - Science Journal of Chemistry
SP  - 38
EP  - 48
PB  - Science Publishing Group
SN  - 2330-099X
UR  - https://doi.org/10.11648/j.sjc.20261402.11
AB  - Absorption, emission, time resolved fluorescence spectra and molecular modelling of 2-anisidine (2AS) with α-CD and β-CD in pH~2, pH~7 and pH~11 solutions were examined. Cu: 2AS: CD nanomaterials were investigated by SEM, DSC, FTIR, XRD and 1H NMR techniques. The absorption and emission maxima and spectral shape of 2AS in all the pH solutions and solvents are different from each other. 2AS gave a single broad emission spectrum in all the solvents while dual emission noticed at pH~11. The lifetimes of the inclusion complexes were longer than that of the free 2AS molecule. The geometrical restriction of the α-CD cavity likely limits the free rotation of the amino and methoxy groups, thereby enhancing the emission intensity. The calculated HOMO–LUMO energy gap, total energy, free energy, enthalpy, entropy, dipole moment, and zero-point vibrational energy of the CD: 2AS complex differed significantly from those of the isolated 2AS, α-CD and β-CD molecules, and both the vertical and horizontal bond lengths between the amino and methoxy groups are smaller than the β-CD cavity size confirming the formation of an inclusion complex. In FTIR, most of the peaks are not appeared and a substantial decrease in intensity was noted in the Cu: 2AS: CD nano. The chemical shift value of 2AS protons are shifts to up field and down field and the peak intensities are very low in the nano copper with CD nanomaterials. SEM image of the nanomaterials are different from isolated 2AS molecule.
VL  - 14
IS  - 2
ER  -
Department of Chemistry, Annamalai University, Annamalai Nagar, India
Department of Chemistry, Annamalai University, Annamalai Nagar, India
Molecular Biophysics Unit, Indian Institute of Science, Bangalore, India
Department of Zoology, Annamalai University, Annamalai Nagar, India
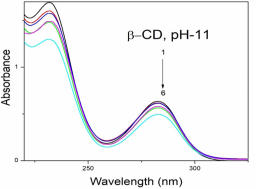
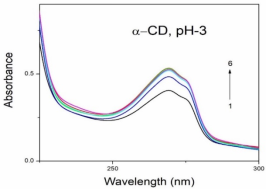
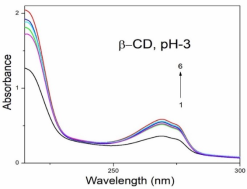
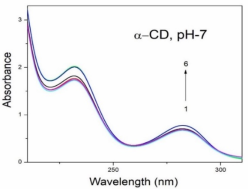
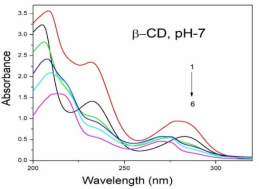
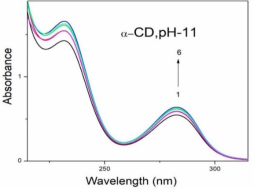
Figure 1. Absorption spectra of 2AS in different α-CD and β-CD concentrations (mol/dm3): (1) 0, (2) 0.002, (3) 0.004, (4) 0.006, (5) 0.008 and (6) 0.01.
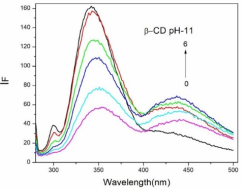
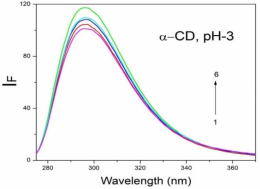
Figure 2. Fluorescence spectra of 2AS in different α-CD and β-CD concentrations (mol/dm3): (1) 0, (2) 0.002, (3) 0.004, (4) 0.006, (5) 0.008 and (6) 0.01.
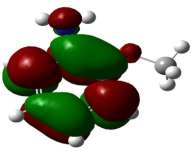
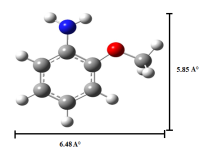
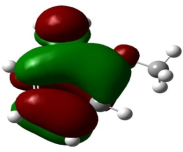
Figure 3. PM3 optimized structures of (a, b) 2AS (c, d) HOMO, LUMO of 2AS.
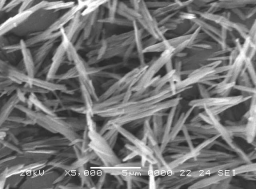
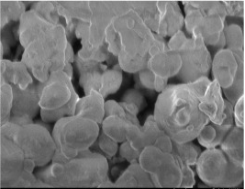
Figure 4. SEM images for a) Cu nano, b) 2AS, c) Cu: 2AS: α-CD and d) Cu: 2AS: β-CD.
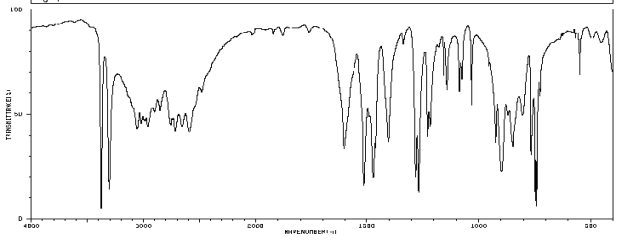
Figure 5. FTIR spectra of 2AS.
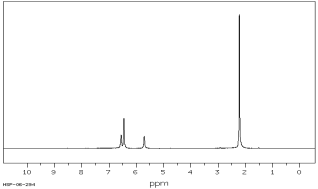
Figure 6. 1H-NMR spectra of 2AS.
Information