Research Article | | Peer-Reviewed

A Study on the Adsorption of Methyl Orange in Aqueous Solution by Activated Carbon Prepared from Neem Oil Cakes: Kinetic and Thermodynamic Analyses

Received: 18 March 2026     Accepted: 21 April 2026     Published: 30 April 2026
Views:       Downloads:
Abstract

This worked is aimed at studying the thermodynamic and kinetic adsorption of methyl orange (MO) onto activated carbon (AC) obtained from Neem oil cakes (NOC). The ACs were synthesized by chemical activation of Neem oil cakes with H3PO4 of 2, 5 and 10 percent (respectively labeled AC-2, AC-5, and AC-10) followed by pyrolysis at 450°C for 1 hr. Various characterizations of the synthesized ACs include Fourier Transformed Infrared spectroscopy FTIR, microstructural and elemental analyses (SEM/TEM, EDS), pHPZC, moisture content, and iodine and methylene blue adsorption methods were used to determine the surface area. The ACs were employed to adsorb methyl orange (MO) from a synthetic aqueous solution. The results obtained show that: pHPZC was less than 7, indicating that the three activated carbons have predominantly acidic surface. The adsorbents AC-5 and AC-10 have microporous and mesoporous structures respectively, with respective specific surface area by iodine adsorption (SI2) method estimated to be around 688.45 and 689.70 m2/g. The adsorption of MO was pH dependent, with an optimal adsorption at pH =2. The EDS results confirm that these adsorbents are primarily composed of carbon. Results from kinetic studies showed that the adsorption process followed a pseudo second order kinetic model. The experimental data from the equilibrium adsorption of MO on the ACs showed the best fit with the Langmuir isotherm, suggesting monolayer adsorption. Maximum adsorption capacity of 232.558 mg.g-1 was obtained for AC-10. These results show that the adsorption of MO is spontaneous and endothermic. Chemisorption is the predominant mechanism for MO removal on AC-2, AC-5, and AC-10.

Published in Science Journal of Chemistry (Volume 14, Issue 2)
DOI 10.11648/j.sjc.20261402.13
Page(s) 60-74
Creative Commons

This is an Open Access article, distributed under the terms of the Creative Commons Attribution 4.0 International License (http://creativecommons.org/licenses/by/4.0/), which permits unrestricted use, distribution and reproduction in any medium or format, provided the original work is properly cited.

Copyright

Copyright © The Author(s), 2026. Published by Science Publishing Group

Keywords

Neem Oil Cake, Activated Carbon, Adsorption, Methyl Orange, Pseudo-second Order, Langmuir Isotherm

1. Introduction
The presence of colored dyes in effluents in aqueous environments decreases sunlight penetration, which affects aquatic ecosystems due to reduced photosynthesis. These dyes in the environment come from the discharge of wastewater from the textile, car, food, paint, cosmetics, and rubber industries . Some of the dyes discharged to the environment are non-biodegradable and therefore, harmful to living organisms . Among these dyes, methyl orange is a widespread water pollutant and is the focus in this study. Methyl orange (MO) is a widely used in the textile industry and also as an indicator in laboratory titrations. These activities discharge MO in wastewater which are among the biggest pollutants in groundwater. MO is considered a recalcitrant environmental pollutant due to it being non biodegradable, has carcinogenic and mutagenic harmful effects to humans and aquatic life . Due to its toxicity, the disposal of MO to the environment is of great concern. Therefore, it is necessary to decontaminate waste water before discharge to the environment. In recent years, different physicochemical techniques have been reported for removing contaminant dyes from wastewater, including ion exchange, photocatalysis, reverse osmosis procedures, coagulation/flocculation, filtration, oxidation and adsorption . Among these techniques, adsorption shows advantages over the other techniques including simplicity of design, low cost and high efficiency . Several natural and agricultural adsorbents have investigated for removal of dyes in waste water such as zeolites , sawmill waste , pea shell waste and clay minerals . However, raw lignocellulosic wastes utilized as adsorbents generally show very low adsorption capacity. Their transformation into activated carbon (AC) improves the textural properties notably increased specific surface area and chemical properties which results in improved adsorption. Thus, ACs have extensive adsorption capability and are used in the elimination of various compounds from wastewater such as organic dyes, heavy metals, pharmaceuticals and gaseous pollutants .
There is continuous effort to minimize the cost of treatment of polluted effluents. One effective way is to use lignocellulose waste materials as precursors for synthesizing activated carbons which offers several advantages being their low cost, abundant availability, non-toxicity and renewable nature. Neem oil cake (NOC) is a byproduct derived from Neem seeds after crushing to obtain oil. The present study is aimed at converting Neem oil cakes into low cost activated carbon by chemical activation using H3PO4 followed by pyrolysis in order to improve the adsorbent properties for effluent treatment processes. The thermodynamic and kinetic studies on adsorption of methyl orange (MO) in aqueous solution by activated carbon (AC) from Neem oil cakes (NOC) were conducted. Various parameters in the adsorption process including dye concentration, pH, particle size, contact time, adsorbent dosage, agitation speed and temperature were optimized. The experimental equilibrium adsorption data of MO on the ACs showed a good fit with the Langmuir isotherm and the kinetic analysis showed a pseudo second order kinetic model.
2. Experimental
2.1. Chemicals
Analytical grade Iodine (I2, 99%), potassium iodide (KI, 99.5%), sodium thiosulfate (Na2S2O4, 99%), phosphoric acid (H3PO4, 85%), hydrochloric acid (HCl, 37%), sodium hydroxide (NaOH, 99%), sodium chloride (NaCl, 99.5%) were purchased from Sigma-Aldrich; Methyl orange (C14H14N4NaO3S, 99%) and methylene blue (C16H18ClN3S, 99.5%) were obtained from Merck and deionized water were all used as obtained without further purification.
2.2. Precursor Pretreatment
Neem oil cakes used in this work were collected in the Diamare Department in the Far North Region (Cameroon). Neem oil cakes were washed with distilled water to remove other materials found in the biomass. Then, it was dried under the sun for 14 days until a constant mass was obtained, crushed and sieved with a 100 µm sieve to obtain homogeneous particle distribution of the powder. Figure 1 shows the images of obtained neem oil cakes and powder after pretreatment respectively.
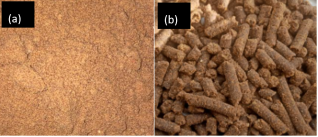
Figure 1. Neem oil cakes (NOC) (a) and Neem oil cakes powder (b).
2.3. Preparation of Activated Carbon
A mass of 50 g of neem oil cake powder was added to 150 mL of H3PO4 solution at different mass percentages of 2, 5 and 10%. The suspension was stirred at room temperature for 1 hour, then incubated at 105°C for 24 hours. The impregnate was calcined in an electric oven at 450°C, heating rate of 5°C min -1 for 1 hr. The activated carbon formed after pyrolysis was allowed to cool, then washed with distilled water on a filter paper until pH of around 7 was attained, and then baked at 105°C for 24 hours. The prepared activated carbons are designated according to the mass percentage of phosphoric acid as AC-2, AC-5, AC-10.
2.4. Characterization of Activated Carbon
The synthesized carbonaceous materials were analyzed by different complementary methods: Fourier Transformed Infrared spectroscopy (FTIR), pH of zero charge point, humidity level, iodine and methylene blue numbers, Scanning Electron Micoscopy, (SEM) and Energy Dispersive X-ray Spectroscopy (EDS).
Fourier Transform Infrared spectroscopy (FTIR) was performed using a spectrophotometer Brûker alpha-P in the wavenumber range from 4000 to 400 cm-1.
SEM and EDS analyses were performed using a TESCAN VEGA 3-LMU device running at 8 kV. Prior to the analysis, a small amount of the samples were pressed on aluminum stubs and coated with a thin layer of gold to make them conductive.
The microporosity of the materials was determined using the iodine number (II2) method according to the protocol described elsewhere . For each sample, 0.2 g was added to 20 mL of 0.02 N iodine solution (I2) while stirring for 1 hr at room temperature. Then, the solution was filtered and 10 mL of the filtrate was titrated with 0.1 M sodium thiosulfate (Na2SO3) solution using starch as indicator till a colorless solution was formed. The iodine number (II2, mg/g) was calculated by Eq (1).
II2=Co-Cn×Vn2VI2MI2× Vads mads(1)
where Vn is the volume of sodium thiosulphate (mL) with concentration Cn (mol/L), C0 is the initial concentration (mol/L) of iodine solution, VI2 is the volume of iodine added (mL), MI2 is the molar mass (g/mol) of iodine, Vads represents the adsorption volume (mL), and mads is the mass of the adsorbent (g).
From the mass of iodine adsorbed at equilibrium per gram of activated carbon (Qe) the specific surface area ios determined according to equation (2):
S12=QeσNAM12(m2g-1)=1.28×10⁵Qe(m2g-1)(2)
where σ is the area occupied by an iodine (σ = 0.213 nm2), NA is the Avogadro’s constant (6.023.1023mol-1) and MI2 is the molar mass of iodine (g/mol).
The mesoporosity of the materials was evaluated by the methylene blue adsorption tests using the protocol described in . For each sample, 0.2 g was introduced into 50 mL of 100 mg/L methylene blue (MB) solution. The mixture was stirred at room temperature for 2 hours. Then, the concentration of residual MB in the filtrate was determined with a UV-visible spectrophotometer (SCHOTT Instrument) at 660 nm. The adsorbed amount (Qe, mg/g) was calculated using equation (3):
Qe=Co-Ce V mads(3)
where Co and Ce represent the MB initial and equilibrium concentrations (mg/L) respectively, mads is the mass of AC in grams, and V denotes the volume of MB solution (mL).
The amount of MB adsorbed at equilibrium (Qe) allows the estimation of the specific surface area (SSA) of the sample covered by the MB (SMB) molecule according to equation (4):
SMB=QeAmNAMMB(4)
where Am is the molecular surface area, (Am = 1.30 nm2), Avogadro constant, NA = 6.023.1023mol-1 and MMB is the molar mass of MB (g/mol).
The water content in the AC was determined as follows: a mass of 0.5 g of activated carbon was weighed and introduced into a ceramic crucible. The crucible and AC were weighed, then put in an oven at a temperature of 105°C for 3 hours. The crucible and its content were then allowed to cool, and then reweighed.
The pH of zero-point charge (pHZPC) was determined using the pH-drift method . 50 mL, 0.1 M NaCl solution was put into various conical flasks and the pH of each solution was adjusted using 0.1 M HCl or NaOH. Initial pH (pHi) values from 1 to 11 were utilized. 0.2 g of each carbon material (that is AC-2, AC-5, AC-10) was then added to the NaCl solutions, the flasks were each covered and stirred at room temperature for about 10 hours. Then, the pH of the final solution (pHf) was measured. The pHZPC is the pH at the point where the curve ∆pH = (pHf – pHi) = f(pHi) intercepts the x-axis (pHi).
2.5. Adsorption of Methyl Orange on the Synthesized AC Materials
The yield for the removal of methyl orange (MO) was determined by performing batch adsorption by adding 0.1g of the AC adsorbent to 30 mL of methyl orange solution of known concentration. The suspension was stirred using a magnetic stirrer at room temperature for a fixed time, then filtered using a filter paper and the analyte concentration in the filtrate was determined using UV-Visible spectrophotometer at a wavelength of 465 nm. The adsorption capacity (mg/g) and the removal yield (%) were calculated using equations (5) and (6) respectively .
Qe=C0-Cemx V(5)
Rd (%) =C0-CeC0x 100(6)
Where C0 (mg.L-1) and Ce (mg.L-1) are the Initial and Residual concentrations of MO respectively, m (g) is the mass of adsorbent and V (mL) the Volume of solution of MO.
The adsorption isotherms were obtained by fitting the experimental data to the Langmuir and Freundlich models. The linear form of Langmuir model is presented of equation (7).
1Qe=1KLQmaxCe+1Qmax(7)
where Qe is quantity of adsorbed solute (mg/g), Qmax is maximum theoretical adsorption capacity (mg/g) and KL is the Langmuir’s constant of adsorption at equilibrium (L/mg).
The parameter KL and Qmax are determined from the plot 1Qe = f (1Ce).
The viability of an adsorption can still be defined from the dimensionless separation factor RL (Equation (8)):
RL=11+KLCO(8)
In the linear form, Freundlich model is given by the expression (9):
Log(Qe) = log (KF) +1nflog (Ce)(9)
where nf is a constant indicating the intensity of adsorption, and KF is Freundlich’s Constant (mg1-(1n).L1/n.g-1).
The general forms of pseudo-first order , pseudo-second order and intraparticle diffusion kinetic models are defined respectively by equations (10), (11) and (12).
(10)
where 𝐾1 is the rate constant (min-1); q𝑒 is the quantity adsorbed at equilibrium (mg.g-1); q𝑡 is the quantity adsorbed at time t (mg.g-1).
tQt =1K2Qe2 +1Qe t (11)
𝐾2 is the rate constant (g.mg-1.min-1), q𝑒 is the quantity adsorbed at equilibrium (mg.g-1), q𝑡 is the quantity adsorbed at time t (mg.g-1).
(12)
where Kid is intraparticle diffusion rate constant (mg.g-1.min-1/2), 𝐶 is the ordinate from the origin and gives information about the thickness of the diffusion boundary layer, q𝑡 is the quantity adsorbed at time t (mg.g-1).
Chemisorption and physisorption can be differentiated by measuring the heat (enthalpy) of adsorption and it also provides information on the feasibility and spontaneity of the adsorption process. The three thermodynamic parameters namely the Gibbs free energy change (ΔG), the enthalpy change (ΔH) and the entropy change (ΔS), have been determined with the help of equations (13) at (16) .
G=-RTLnKc(13)
Kc=1000Kd(14)
Kd=qeCe(15)
LnKC=SR-HRT(16)
where Kc is the equilibrium constant, T is the temperature (K), and R is the Universal Molar gas constant (8.314 J.mol-1.K-1), Ce is the concentration of adsorbate at equilibrium solution (mg.L-1) and qe is the quantity adsorbed at equilibrium (mg.g-1), Kd is the distribution coefficient (L.g-1) and the density of water is 1000 g.L-1.
3. Results and Discussions
3.1. FTIR Spectra of NOC, AC-2, AC-5 and AC-10 Materials
The FTIR spectra of NOC, AC-2, AC-5 and AC-10 obtained are shown in the Figure 2.
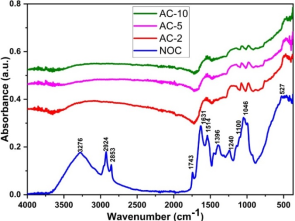
Figure 2. FTIR spectra of NOC, AC-2, AC-5 and AC-10.
From Figure 2, a broad band around 3276 cm-1 is observed for the FTIR spectrum of NOC which corresponds to –OH stretching vibration of surface hydroxyl groups and adsorbed water molecules . The band around 2924 cm-1 is ascribed to the –CH3 stretching vibration of alkyl groups . The bands at 1743, 1631, 1514, and 1240 cm-1 correspond to the C=O vibration of carbonyl groups, the C=C or C=N vibration of olefinic or aromatic groups, and the C=O vibration of alcohols, respectively . The peaks at 1046 and 527 cm-1 may be attributed to C–O bond bending and C–H stretching vibrations respectively of meta- and para-disubstituted benzene . Finally, the band around 1100 cm-1 may be attributed to the K-O or Ca-O bond stretching vibrations . The FTIR spectra of AC-2, AC-5 and AC-10 (Figure 2) show the disappearance and reduction of several absorption bands on the NOC precursor, respectively. The calcination of NOC induced the aromatization of the carbons in the raw material via the Diels-Alder reaction, with the disappearance of most oxygenated functional groups between 290 and 350°C . This is because certain surface functional groups present in the precursor are oxidized during the pyrolysis process or the increase in carbonization temperature . This may explain the structural changes observed in the raw material during the preparation process.
3.2. Determination of pH at the Zero-point Charge
Table 1 presents the pH at the zero-point charge (pHZPC) for the different ACs.
Table 1. pH at zero-point charge for AC-2, AC-5 and AC-10.

Activated carbon

AC-2

AC-5

AC-10

Phzpc

4.7

5.5

5.3

It is observed that the pH values at zero-point charge (pHZPC) of the synthesized activated carbons (Table I) were all less than 7. This confirms that the surface of these three materials is predominantly acidic. This could be explained by the fact that during chemical activation, oxidation introduces surface oxygen content. This could enhance the acidic functionalities of the materials . Furthermore, the determined pHZPC values of the adsorbents (Table 1) imply that in solutions with a pH > pHZPC, the surface of the materials has a negative charge, while for pH < pHZPC, the surface has a positive charge . The pHZPC values are consistent with the results of the FTIR analysis.
3.3. Surface Area Calculation by Iodine and Methylene Blue Numbers Method
The measured and calculated parameters of the methylene blue and iodine adsorption tests on activated carbons prepared from neem oil cake (NOC) are presented in Table 2.
Table 2. Methylene Blue and Iodine Numbers of AC-2, AC-5, and AC-10.

Activated carbon

AC-2

AC-5

AC-10

Methylene Blue Number (IMB, mg. g-1)

98.29

99.80

99.83

Specific Surface Area (SMB, m2. g-1)

60.60

61.15

62.15

Iodine Number (II2, mg. g-1)

430.45

684.50

686.24

Specific Surface Area (SI2, m2. g-1)

435.19

688.45

689.70

From Table 2, both methylene blue and iodine values increase with increasing H3PO4 concentration. The specific surface area of the prepared ACs also increases. The increase in porosity with increasing impregnation rate suggests that the porosity created by the activating agent is due to the free spaces left by H3PO4 after leaching. The final washing and drying steps remed any residual activating chemicals leaving a carbonized sample with accentuated porosity. The iodine values obtained in this work for ACs obtained from phosphoric acid-activated neem oil cakes are within the range of iodine values for commercial activated carbons (500–1500 mg/g), according to ASTM D4607, except for AC-2. These iodine values are higher than those of other commercial activated carbons . Therefore, the prepared activated carbons are of good quality and can be used as adsorbent for water and sugar dechlorination, taste and odor removal, and wastewater treatment. Consequently, neem oil cakes are suitable precursors to prepare high-quality porous activated carbons.
3.4. Moisture Content
The experimental results for the moisture content of the ACs obtained from neem oil cake are presented in Table 3.
Table 3. Moisture Content of AC-2, AC-5, and AC-10.

Activated carbon

AC-2

AC-5

AC-10

Moisture Content (%)

2.7

2.5

2.3

Table 3 shows that the prepared activated carbons have low water contents (less than 10%). These low values indicate that activated carbons prepared from neem oil cakes could have high carbon contents. Indeed, a low water content indicates good quality AC, and thus promotes contaminant adsorption. The values obtained, compared to those in the literature (9.94%), show that neem oil cakes is a suitable precursor for activated carbons .
3.5. Results of EDS Analysis
The elemental analysis of the samples AC-2, AC-5 and AC-10 are shown in Figure 3.
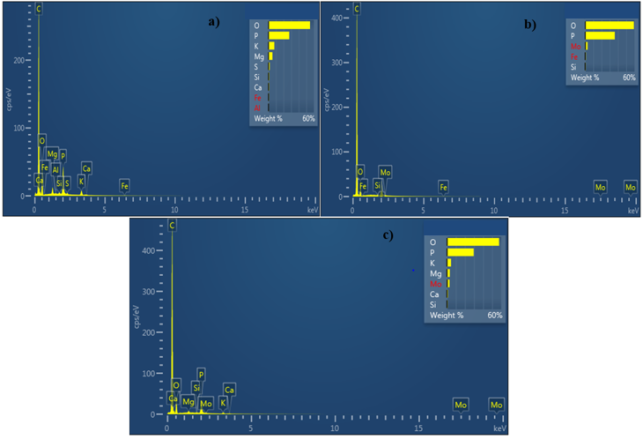
Figure 3. EDS analysis of AC-2, AC-5 and AC-10.
From Figure 3, the most abundant peaks observed for the three adsorbent materials (AC-2, AC-5 and AC-10) are from carbon, oxygen and phosphorus. The EDS spectra of the three activated carbons indicate an estimate of 60% by mass of the other elements apart from carbon. The mass percentage of carbon would therefore be 40% for each of these activated carbons. There is a high content of surface oxygen. However, according to these graphs, the oxygen percentages are ranked in the following order: AC-5> AC-10> AC-2. Such results confirm that these adsorbents are primarily composed of mainly carbon with some surface oxygen groups. Furthermore, the variation of the percentages by mass of oxygen for the samples AC-2, AC-5 and AC-10 shows that the use of phosphoric acid during the chemical activation of the plant material would have resulted in a more intense oxidation of surface functional groups of AC-5. The activation of 5% would therefore be the threshold percentage allowing the best chemical activation of the precursor under these synthesis conditions. These results confirm those obtained from IR analysis and pHzpc determination.
3.6. SEM/TEM Analyses
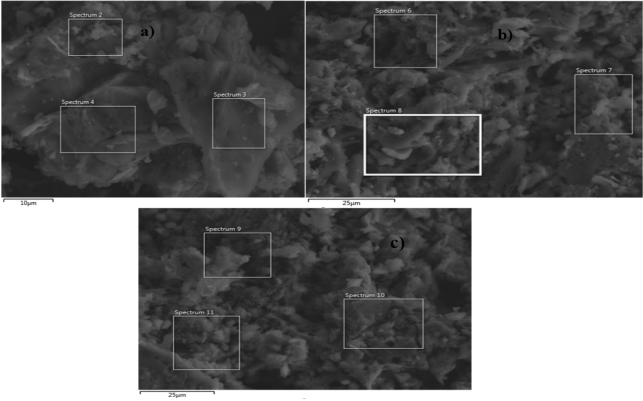
Figure 4. SEM analysis of AC-2, AC-5 and AC-10.
Figures 4 and 5 present the SEM and TEM micrographs respectively of activated carbons indicating the detail studies of the surface morphologies.
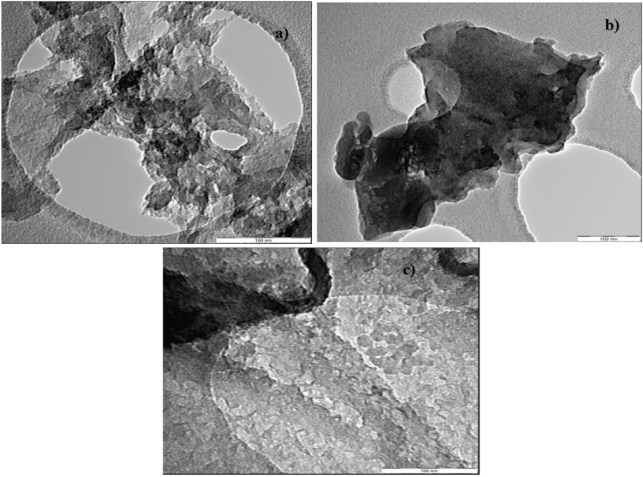
Figure 5. TEM analysis of AC-2, AC-5 and AC-10.
A heterogeneous surface is observed from the SEM for the three activated carbons, which could be explained by their amorphous nature. It can also noticed that the three adsorbents show porous microstructures with the porosity levels in the order: AC-2<AC-5<AC-10. However, activated carbons exhibit almost similar levels of porosity, with pores clogged by aggregates of activated carbon particles. The pore diameters in AC-10 are greater than those of AC-5. This observation is supported by TEM analysis, which shows that the three adsorbents have spherical pores blocked in a few places, with diameters ranked in the following order: AC-10>AC-2>AC-5. AC-5 exhibits a diverse porosity consisting of mesospores and macropores. This result is consistent with those provided by the porosity indices .
3.7. Results of MO Adsorption on the Synthesized Activated Carbons
The adsorption test of methyl orange, MO on the synthesized AC-2, AC-5, and AC-10 was evaluated based on several operational parameters, including contact time, initial MO concentration, pH of the MO solution, and temperature.
3.7.1. MO Adsorption Kinetics on Activated Carbon
Figure 6 illustrates the evolution of MO removal with time on AC-2, AC-5, and AC-10.
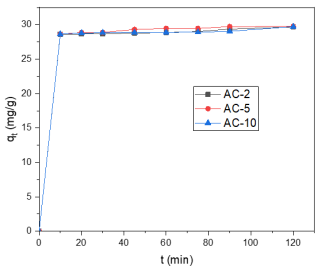
Figure 6. Influence of MO contact time on AC-2, AC-5, and AC-10.
The adsorption of MO onto AC-2, AC-5, and AC-10 is observed from Figure 6 to be rapid at the beginning of the process, from 0 to 20 min, then gradually slows down and finally reaches equilibrium after 60 min. The rapid adsorption observed during the initial phase is due to the large number of available vacant sites on the surface of AC-2, AC-5, and AC-10. The equilibrium state is due to repulsive forces between the MO dye adsorbed onto the surface of AC-2, AC-5, and AC-10 and the solution phase, as well as the continuous saturation of energetically favorable sites . Based on this, the optimal contact time for the other experiments was adopted to be 60 minutes.
The adsorption mechanism of MO on AC-2, AC-5, and AC-10 were described by fitting the data into classical pseudo-first-order, pseudo-second-order, and intraparticle diffusion kinetic models. The experimental results obtained are compiled in Table 4, and the graphs of the pseudo-first-order, pseudo-second-order, and intraparticle diffusion kinetic models are shown in Figures 7, 8, and 9, respectively.
Table 4. Kinetic parameters of MO adsorption on AC-2, AC-5, and AC-10.

Models

Parameters

AC-2

AC-5

AC-10

pseudo-first-order

R2

0.751

0.804

0.889

K1 (min-1)

0.013

0.039

0.045

Qe(th) (mg. g-1)

1.411

2.253

1.060

Qemax (exp) (mg. g-1)

29.675

29.756

29.729

q (mg. g-1)

20.694

27.503

28.669

t1/2 (min)

52.900

17.960

15.400

pseudo-second-order

R2

0.999

0.999

0.999

K2 (g. mg-1. min-1)

0.036

0.042

0.036

Qe (th) (mg. g-1)

29.670

29.940

29.586

Qemax (exp) (mg. g-1)

29.675

29.756

29.729

q (mg. g-1)

0.009

0.184

0.143

h (mg. g-1. min-1)

31.690

37.650

31.646

t1/2 (min)

0.920

0.800

0.935

intraparticle diffusion

R2

0.845

0.952

0.902

Kid ((mg. g-1).min-1/2)

0.114

0.153

0.050

I (mg. g-1)

28.233

28.182

28.538

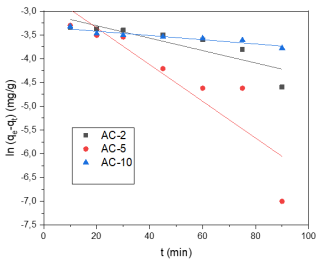
Figure 7. Pseudo-first-order kinetic model of MO adsorption on AC-2, AC-5 and AC-10.
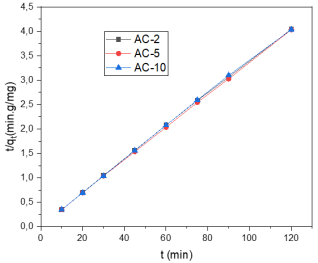
Figure 8. Pseudo-second-order kinetic model of MO adsorption on AC-2, AC-5 and AC-10.
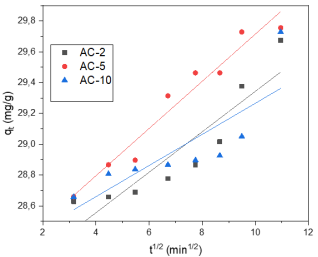
Figure 9. Intraparticle diffusion kinetic model of MO adsorption on AC-2, AC-5 and AC-10.
According to the pseudo-first-order kinetic model, Table 4 shows unsatisfactory correlation coefficients (R2 ≤ 0.889), indicating poor correlation (Figure 7), there is a large relative discrepancy (Δq ≥ 20) indicating non-conformity between experimental and theoretical values, a low kinetic rate constant (K1 ≤ 0.045 min-1), and long half-life (t1/2 ≥ 15.40 min). Therefore, the pseudo-first-order kinetic model does not adequately describe the adsorption of MO onto AC-2, AC-5, and AC-10. Regarding the pseudo-second-order kinetic model, the results obtained show good linear fit of the regression lines (Figure 8). Furthermore, Table 4 shows that the correlation coefficients are significantly better (R2 ≥ 0.999) for all three materials, and the relative differences are small (Δq ≥ 0.184), thus justifying the agreement between experimental and theoretical values. The values of (K2 ≤ 0.045 g.mg-1.min-1) are consistent with the increase in adsorption capacity, as well as the initial rate of adsorption (h ≥ 31.646 mg.g-1.min-1), as well as a short half-life (t¹/2 ≤ 0.935 min). The three activated carbons used are, in descending order of concentration, AC1/2 > AC1/1 > AC1/3. Considering the above, it can be concluded that the best description of the adsorption dynamics of organic matter (OM) on AC-2, AC-5, and AC-10 is by the pseudo-second-order kinetic model. Furthermore, the large I values (I ≤ 28.542) and low correlation coefficients (R2 ≤ 0.95) for the intra-particle diffusion kinetic model (Table 4) indicate that this model is not the sole control of the sorption rate. This is confirmed from the plotted curves that do not pass through the origin (Figure 9).
3.7.2. Adsorption Isotherms of MO on Synthesized Activated Carbon
Figure 10 presents the adsorption capacity (qe, (mg.g-1)) of MO on the samples AC-2, AC-5 and AC-10 at equilibrium.
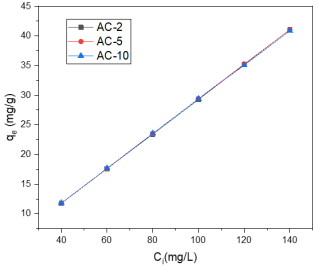
Figure 10. Effect of initial concentration of MO on the MO adsorption capacity on AC-2, AC-5, and AC-10.
It can be observed from Figure 10 that an increase in the initial concentration of the MO dye results in a gradually augmentation of the adsorption capacity (qe) without reaching equilibrium. This observation can be explained by the fact that the adsorption sites on the surface of AC-2, AC-5, and AC-10 are not yet saturated. These results demonstrate that the synthesized activated carbons, AC-2, AC-5, and AC-10 are good adsorbents for MO dyes and can therefore be employed for removal of dyes from polluted liquid effluents.
The adsorption isotherms were described using the Langmuir and Freundlich models. The results for the MO adsorption isotherm parameters on AC-2, AC-5, and AC-10 are summarized in Table 5, and the Langmuir and Freundlich plots are shown in Figures 11 and 12, respectively.
Table 5. Adsorption Isotherm Parameters of MO on AC-2, AC-5, and AC-10.

Models

Parameters

AC-2

AC-5

AC-10

Langmuir

R2

0.993

0.998

0.997

Qmax(mg/g)

81.301

207.270

232.558

KL (L.mg-1)

0.062

0.061

0.266

RL

0.151

0.154

0.040

Freundlich

R2

0.965

0.995

0.976

Kf (mg1-(1n).L1/n.g-1)

13.121

16.458

17.782

Nf

1.037

1.313

1.583

1/nf

0.964

0.762

0.632

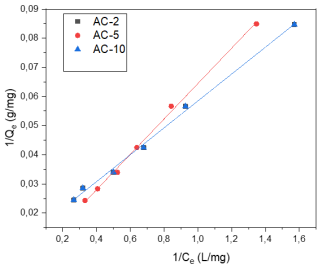
Figure 11. Adsorption Isotherm Parameters of MO on AC-2, AC-5 and AC-10 (Langmuir).
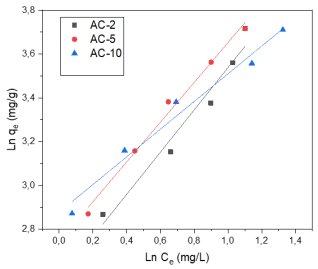
Figure 12. Adsorption Isotherm Parameters of MO on AC-2, AC-5 and AC-10 (Freundlich).
Table 5 shows acceptable correlation coefficient value (R2 ≤ 0.998) for the Langmuir model, and Figure 11 confirms good linear fit. Significant maximum capacities (Qmax ≤ 81 mg. g-1) are observed for MO adsorption on AC-2, AC-5 and AC-10. Thus, the RL values (≤ 0.154), being between 0 and 1, indicate that the MO adsorption process on all three activated carbons would be favorable. From Table 5, the Freundlich model shows less satisfactory values of the correlation coefficients (R2 ≤ 0.995) for MO adsorption on AC-2, AC-5, and AC-10. The Kf values (≥ 13 mg L2/n g) imply a high adsorption capacity and good affinity of MO for all adsorbents. It is worth noting that the closer the nf value is to 1, the more homogeneous the surface, meaning that all exchange sites have almost the same affinity for MO, and 1/nf < 0 indicates favorable adsorption. This could be explained by the formation of relatively stronger adsorbent-adsorbate bonds . These results are consistent with the pseudo-second-order kinetic model.
In light of the above, we can conclude that the Langmuir model better describes the adsorption of MO on AC-2, AC-5, and AC-10. This confirms that the adsorbent surface was more homogeneous. Therefore, this is a monolayer adsorption on active sites with similar affinities.
3.7.3. Influence of the pH of the Solution on Adsorption
The effect of the pH of the solution on the adsorption of MO on AC-2, AC-5 and AC-10 is shown in Figure 13.
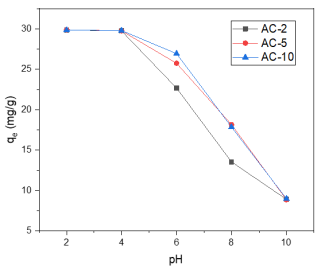
Figure 13. Influence of the pH of the MO solution on the adsorption on AC-2, AC-5, and AC-10.
As observed from Figure 13, the adsorption of MO onto AC-2, AC-5, and AC-10 strongly depends on pH of the solution. This could be due to the anionic nature of the MO molecules in the pH range (2-10). Optimal adsorption of the MO dye was achieved at pH 2. To better understand this dynamic, the pHPZC of AC-2, AC-5, and AC-10 was less than 7 (Table 1). When pH > pHPZC, the external surface of AC-2, AC-5, and AC-10 is negatively charged (AC)OH(s), and at pH < pHPZC, it is positively charged (AC)H+(s). The adsorption of the MO dye improved at pH < pHPZC. This condition may be due to the significant presnce of the force of gravity and the diminishing force of repulsion between the surface of AC-2, AC-5, and AC-10 and the MO dye . The low efficiency of the MO dye at pH > pHPZC may be due to the presence of excess OH ions competing with the dye anions (MO) for the occupation of adsorption sites .
3.7.4. Thermodynamic Studies of MO on Activated Carbon
Figure 14 shows a plot of the adsorption capacity qe (mg.g-1) of the MO dye on AC-2, AC-5 and AC-10 as a function of the temperature T (K).
Figure 14 shows a proportional increase in the adsorption capacity with increase in temperature with optimum adsorption capacity at 338 K, indicating an endothermic process. An increase in the temperature results to an increase in kinetic energy of the MO molecules. This increases the number of interactions with the adsorption sites as well as the mobility of the molecules . Furthermore, the solubility of the adsorbed molecules is affected, which ultimately has a significant effect on the removal process. These results corroborate with those reported in other studies for the removal of dyes from Cedrus deodara sawdust . The thermodynamic parameters (ΔG, ΔH, and ΔS) obtained are listed in Table 6.
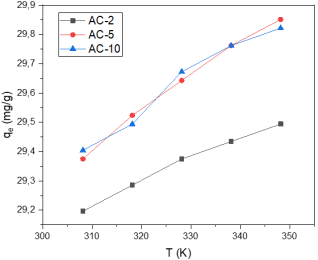
Figure 14. Adsorption capacity qe (mg.g-1) of AC-2, AC-5, and AC-10 vs temperature.
Table 6. Thermodynamic parameters ΔG, ΔH, and ΔS.

AC

Temperature (K)

G (kJ.mol-1)

H (kJ.mol-1)

S (kJ.mol-1)

AC-2

308.150

-8.010

0.253

0.027

318.150

-8.278

328.150

-8.546

338.150

-8.814

348.50

-9.082

AC-5

308.150

-12.191

0.744

0.042

318.150

-12.612

328.150

-13.031

338.150

-13.451

348.150

-13.871

AC-10

308.150

-11.765

0.680

0.040

318.150

-12.169

328.150

-12.573

338.150

-12.976

348.150

-13.380

From Table 6, negative ΔG values are observed which indicate a spontaneous process and favorable adsorption process . There is a reduction in ΔG values with increase in temperature, indicating an increase in the frequency and spontaneity of adsorption at higher temperatures. Positive ΔH values from Table 6 is an illustration of an endothermic adsorption process for MO. The values of ΔH indicate that chemisorption is the predominant mechanism for the elimination of MO on AC-2, AC-5 and AC-10. There is an increase in randomness at the solid/solution interface during the adsorption reaction of MO onto AC-2, AC-5, and AC-10 as observed by the positive ΔS values, as well as an increase in the adsorbent's affinity for the MO dye.
4. Conclusion
The main objective of this study was the thermodynamic and kinetic study of the adsorption of methyl orange onto activated carbon prepared from Neem oil cakes. Results obtained show that pHPZC was less than 7 which indicates that the three activated carbons AC-2, AC-5, and AC-10 have a predominantly acidic surface. Adsorbents AC-5 and AC-10 possess highly microporous and mesoporous structure, with the estimated specific surface area per iodine (Si2) adsorption being 688.45 and 689.70 m2/g respectively. Experimental results show that organic matter (MO) adsorption is dependent of the solution pH, with an optimal adsorption at pH of 2. The adsorption kinetics were found to follow a pseudo second order kinetic model with a determination coefficient (R2) of 0.999. The Langmuir isotherm provides the best fit for the experimental data, suggesting monolayer adsorption. Maximum adsorption capacity of 232.558 mg.g-1 was achieved for AC-10. The adsorption of MO onto ACs is a spontaneous and endothermic process. Chemisorption is the predominant mechanism for the elimination of MO from aqueous solutions by AC-2, AC-5 and AC-10.
Abbreviations

AC

Activated Carbon

NOC

Neem Oil Cakes

MO

Methyl Orange

MB

Methylene Blue

FTIR

Fourier Transform Infrared

SEM/EDS

Scanning Electronic Microscopy Coupled Energy Dispersive X Ray

∆ G

Free Enthalpy Variation

∆ H

Enthalpy Variation

∆S

Entropy Variation

Acknowledgments
The authors are grateful to Pr Xavier Siwe Noundou for availing some laboratory facilities to perform characterization.
Author Contributions
Jules Blaise Leuna Mabou: Conceptualization, Formal Analysis, Investigation, Writing – original draft
Edwin Akongnwi Nforna: Data curation, Formal Analysis, Methodology
Suzanne Makota: Conceptualization, Supervision
Harlette Zapenaha Poumve: Formal Analysis, Investigation
Simon Malama: Investigation, Writing – original draft
Jacques Bomiko Mbouombouo: Validation, Writing – review & editing
Lincold Nintedem Magapgie: Investigation, Writing – review & editing
Pierre Gerard Tchieta: Conceptualization, Formal Analysis, Supervision, Validation
Data Availability Statement
The data for this article, including datasets generated during and/or analyzed during the current study will be made available on request.
Conflicts of Interest
The authors declare no conflicts of interest.
References
[1] Hayat M., Shah A., Nisar J., Shah I., Haleem A., Ashiq M.N., “A novel electrochemical sensing platform for the sensitive detection and degradation monitoring of methylene blue“. Catalysts, vol. 12, pp. 306–319, 2022.
[2] Garg V.K., Amita M., Kumar R., Gupta R., “Basic dye (methyl ene blue) removal from simulated wastewater by adsorption using Indian Rosewood sawdust: a timber industry waste“. Dyes Pigm, vol. 63, pp. 243–250,
[3] Veisi H., Razeghi S., Mohammadi P., Hemmati S., “Silver nanoparticles decorated on thiol-modified magnetite nanoparticles (Fe3O4/SiO2-Pr-S-Ag) as a recyclable nanocatalyst for degradation of organic dyes“. Mater Sci Eng C Mater Biol Appl, vol. 97, pp. 624–631,
[4] Pacheco-Álvarez M.O., Picos A., Pérez-Segura T., Peralta-Hernán dez J.M., “Proposal for highly efficient electrochemical dis coloration and degradation of azo dyes with parallel arrangement electrodes“. J Electroanal Chem, vol. 838, pp. 195–203,
[5] Du J., Bao J., Lu C., Werner D., “Reductive sequestration of chromate by hierarchical FeS@Fe0 particles“. Water Res, vol. 102, pp. 73–81.
[6] Pathania D., Bhat V.S., Mannekote Shivanna J., Sriram G., Kurkuri M., Hegd G.,“Garlic peel based mesoporous carbon nano spheres for an effective removal of malachite green dye from aqueous solutions: detailed isotherms and kinetics”. Spectrochi Acta -A: Mol Biomol Spectrosc, vol. 276, pp. 121197,
[7] Samsami S., Mohamadizaniani M., Sarrafzadeh M.H., Rene E.R., Firoozbahr M.,“ Recent advances in the treatment of dye containing wastewater from textile industries: overview and per spectives“. Process Saf Environ Prot, vol. 143, pp. 138–163,
[8] Vendemiatti J.A.S., Camparotto N.G., Vidal C., Cristale J., Agapito E.V.M., Oliveira Á.C., Rodrigues E.A., Montagner C.C., Umbuzeiro G.A., Prediger P., “ New benzotriazoles generated during textile dyeing process: synthesis, hazard, water occurrence and aquatic risk assessment“. J Hazard Mater vol. 403, pp. 123732,
[9] Naziha L., Smail T., Hadi D., “High efficiency adsorption performance of basic dye (crystal violet) onto algerian montmorillonite“. Chem. Eng. Biotechnol. Food Ind, vol. 25, pp. 001– 018, 2024.
[10] Eman M., Abd El-Monaem H.M., Elshishini S.S., Bakr H.G., ElAqapa M.H., Gangadhar A., Gehan M., El-Subruiti A.M., Omer,Abdelazeem S., Eltaweil. “A comprehensive review on LDH-based catalysts to activate persulfates for the degradation of organic pollutants, NPJ Clean“. Water. vol. 6, pp. 34,
[11] Razali N. S., Abdulhameed A. S., Jawad A. H., Alothman Z. A., Yousef T. A., Al Duaij O. K., Alsaiari N. S., “ High-Surface-Area-Activated Carbon Derived from Mango Peels and Seeds Wastes via Microwave-Induced ZnCl2 Activation fo Adsorption of Methylene Blue Dye Molecules: Statistical Optimization and Mechanism“. Mol., vol. 27, pp. 6947.
[12] Mahmoodi N.M., Karimi B., Mazarji M., Moghtaderi H., “ Cadmium selenide quantum dot-zinc oxide composite: synthesis, characterization, dye removal ability with UV irradiation, and antibacterial activity as a safe and high-performance photocatalyst“. J Photochem Photobiol B Biol, vol. 188, pp. 19–27,
[13] Rabeie B., Mahmoodi N.M., “ Heterogeneous MIL-88A on MIL-88B hybrid: a promising eco-friendly hybrid from green syn thesis to dual application (adsorption and photocatalysis) in tetra cycline and dyes removal“. J Colloid Interface Sci, vol. 654, pp. 495–522,
[14] Dutta S., Gupta B., Srivastava S.K., Gupta A.K., “ Recent advances on the removal of dyes from wastewater using various adsorbents: a critical review“. Mater Adv, vol. 2 pp. 4497–4531,
[15] Patawat C., Silakate K., Chuan Udom S., Supanchaiyamat N., Hunt A.J., Ngernyen Y., “ Preparation of activated carbon from Diptero carpus alatus fruit and its application for methylene blue adsorption“. RSC Adv, vol. 10 pp. 21082–21091,
[16] Mahmoodi N.M., Maghsoodi A., “ Kinetics and isotherm of cationic dye removal from multicomponent system using the syn thesized silica nanoparticle“. Desalination Water Treat, vol. 54 pp. 562–571,
[17] Mahmoodi N.M., Mokhtari-Shourijeh Z., (2016) “Modified poly (vinyl alcohol)-triethylenetetramine nanofiber by glutaraldehyde: preparation and dye removal ability from wastewater“. Desalination Water Treat, vol. 57 pp. 20076–20083,
[18] Katheresan V., Kansedo J., Lau S.Y., “Efficiency of various recent wastewater dye removal methods: a review“. J Environ Chem Eng, vol. 6 pp. 4676–4697,
[19] Saepurahman., Singaravel G.P., Hashaikeh R., “Fabrication of electrospun LTL zeolite fibers and their application for dye removal“. J. Mater. Sci, vol. 51, pp. 1133–1141.
[20] Liu Z., Khan T. A., Islam M. D. A., Tabrez U., “A review on the treatment of dyes inprinting and dyeing wastewater by plant biomass carbon“. Bio. Tech, vol. 354, pp. 127168,
[21] Tabrez A.K.., Rumana R., Equbal A.K., “ Decolorization of bismarck brown R and crystal violet in liquid phase using modified pea peels: non-linear isotherm and kinetics modeling“, Model. Earth Syst. Environ, vol. 2, pp. 1-11.
[22] Sakin O.O., Hussein M.A., Hussein B. H. M., Mgaidi A., “Adsorption thermodynamics of cationic dyes (methylene blue and crystal violet) to a natural clay mineral from aqueous solution“. Arab. J. Chem, vol. 11, pp. 615-623.
[23] Indujalekshmi J., Arsha M.S., Biju V., “KOH-mediated structural modification of activated charcoal by heat treatment for the efficient adsorption of organic dyes“. Appl. Surf. Sci. Adv, vol. 19, pp. 100566.
[24] Tiotsop I.H.K., Donald R.T.T., Doungmo G., et al., “ Preparation and characterization of activated carbons from bitter kola (Garcinia kola) nut shells by chemical activation method using H3PO4; KOH and ZnCl2“. Chemical Sci. Inter. J, vol. 23, pp. 1-15,
[25] Sun S., Zhu Y., Gu Z., Chu H., Hu C., Gao L., Zhao X., “Adsorption of crystal violet on activated bamboo fiber powder from water: preparation, characterization, kinetics and isotherms“. Rsc. Adv, vol. 13, pp. 6108–6123.
[26] Sadoq M., Atlas H., Imame S., Kali A., Amar A., Loulidi I., Jabri M., Sadoq B. E., Ouchabi M., Abdullah P. S., Boukhlifi F., “Elimination of crystal violet from aqueous solution by adsorption on naturel polysaccharide: Kinetic, isotherm, thermodynamic studie and mechanism analysis“. Arab. J. Chem, vol. 17, pp. 105453.
[27] Hosseinabadi-Farahani Z., Mahmoodi N.M., Hosseini-Monfared H., “Preparation of surface functionalized graphene oxide nanosheet and its multicomponent dye removal ability from waste water“. Fibers Polymers, vol. 16, pp. 1035–1047,
[28] Hosseinabadi-Farahani Z, Hosseini-Monfared H., Mahmoodi N.M.,“ Graphene oxide nanosheet: preparation and dye removal from binary system colored wastewater“. Desalination Water Treat, vol. 56, pp. 2382–2394,
[29] Mokhtari-Shourijeh Z., SepidehLangari L.M., Mahmoodi N.M.,“Synthesis of porous aminated PAN/PVDF composite nanofibers by electrospinning: characterization and direct red 23 removal“. J Environ Chem Eng, vol. 8, pp. 103876,
[30] Mahmoodi N.M., Hosseinabadi-Farahani Z., Chamani H., Dye adsorption from single and binary systems using NiO-MnO2 nanocomposite and artificial neural network modeling“. Environ Prog Sustain, vol. 36 pp. 111–119,
[31] Ho Y.S., McKay.,G “Sorption of dye from aqueous solution by peat“. Chem Eng J,vol. 70 pp. 115–124,
[32] Aravind Kumar J., Krithiga T., Narendrakumar G., Prakash P., Bala sankar K., Sathish S., Prabu D., Purna Pushkala D., Marraiki N., Ramu A.G., Choi D., “ Effect of Ca2+ ions on naphthalene adsorption/desorption onto calcium oxide nanoparticle: adsorption isotherm, kinetics and regeneration studies“. Environ Res, vol. 204 pp. 112070,
[33] Ho Y., “Review of second-order models for adsorption systems“. J. Hazard. Mater, vol. 136, pp. 681–689,
[34] Mazaheri H., Ghaedi M., Hajati S., Dashtian K., Purkait M.K., “Simultaneous removal of methylene blue and Pb2+ ions using ruthenium nanoparticle-loaded activated carbon: response surface methodology“. RSC. Adv vol. 5, pp. 83427–83435,
[35] Luttah I., Onunga D.O., Shikuku V.O., Otieno B., Kowenje C.O., “Removal of endosulfan from water by municipal waste incineration flyash-based geopolymers: Adsorption kinetics, isotherms, and thermodynamics“. Front. Environ. Chem, vol. 4.
[36] Abdulkareem A.S., Hamzat W.A., Tijani J.O., Egbosiuba T.C., Mustapha S., Abubakre O.K., Okafor B.O., Babayemi A.K., “Isotherm, kinetics, thermodynamics and mechanism of metal ions adsorption from electroplating wastewater using treated and functional ized carbon nanotubes“. J Environ Chem Eng, vol. 11, pp. 109180,
[37] Mbachu C.A., Babayemi A.K., Egbosiuba T.C., Ike J.I., Ani I.J., Mustapha S., “Green synthesis of iron oxide nanoparticles by Tagu chi design of experiment method for effective adsorption of methylene blue and methyl orange from textile wastewater“. Res Eng Des, vol. 19 pp. 101198.
[38] Ndongo G.K., Ndi J.N., Ketcha J.M., “Ferromagnetic Activated Carbon from Cassava (Manihot dulcis) Peels Activated by Iron (III) Chloride: Synthesis and Characterization“. Bio. Res. vol. 15, pp. 2133-2146, 2020.
[39] Mbouombouo B.J., Ngassa P.G., Mabou L.J., Zapenaha P.H., Maffeu E.J., Mondahchouo S., Doungmo G., Victor O.S., Tchieta G.P., Kamdem W.F.,. “Removal of crystal violet by ­ TiO2 loaded alkali ‑ activated carbon hybrid material from Raphia farinifera fruit kernels: surface chemistry, parameters and mechanisms“. Biomass. Conv. Bioref., pp. 1-22.
[40] Haleema M., C., Iqra R. H., Adeel A., Ahmed, Al-Shoaibi, Srinivasakannan C., “Enhanced moisture adsorption of activated carbon through surface modification“. Results Surf. Interfaces, vol. 14, pp. 100170,
[41] Katarzyna J., Barbara C., “Adsorption properties of biochars obtained by KOH activation“.. Adsorption, vol. 30, pp. 167–183,
[42] Abdullah C.A., Ömer Ş., Orhan B., et al., “Surface and porous characterization of activated carbon prepared from pyrolysis of biomass by two-stage procedure at low activation temperature and it's the adsorption of iodine“. Journal of Analytical and Applied Pyrolysis, vol. 104, pp. 378-383,
[43] Chao D., Bo L., Jian H., et al., “ b c,dwnvbn,; n,n,; ,n n, n,,nn, Determination of iodine number of activated carbon by the method of ultraviolet–visible spectroscopy“. Materials Letters, vol. 285, pp. 129137,
[44] Ndi J.S., “Textural properties and adsorption characteristics of activated carbon prepared from cola (C. Acuminata) nut shells: Application for the elimination of methylene blue from aqueous solution". Thèse Doctorat Univ. Yaoundé I, Cameroun, pp. 200, 2014.
[45] Ouéda N, Igor W.O., Yvonne L.B., “Effets des paramètres physico-chimiques de charbons actifs de balle de riz sur la capacité d’adsorption du glycérol“, J. Soc. Ouest-Afr. Chim. vol. 047 pp. 61-72, 2019.
[46] To M., Sze C., Lin K., Mckay G., “Mechanistic study of atenolol, acebutolol and carbamazepine adsorption on waste biomass derived activated carbon“. J. Mol. Liq, vol. 241, pp. 386–398,
[47] Essekria A., Hsinia A., Naciri Y., Laabd M., Ajmal Z., El Ouardi M., Ait Addi A., Albourine A., “Novel citric acid-functionalized brown algae with a high removal efficiency of crystal violet dye from colored wastewaters: insights into equilibrium, adsorption mechanism, and reusability“. Int. J. Phytoremed,
[48] Batool M., Javed T., Wasim M., Zafar S., “Exploring the usability of Cedrus deodara sawdust for decontamination of wastewater containing crystal violet dye. Desalin“. Water Treat, vol. 224, pp. 433–448,
Cite This Article
  • APA Style

    Mabou, J. B. L., Nforna, E. A., Makota, S., Poumve, H. Z., Malama, S., et al. (2026). A Study on the Adsorption of Methyl Orange in Aqueous Solution by Activated Carbon Prepared from Neem Oil Cakes: Kinetic and Thermodynamic Analyses. Science Journal of Chemistry, 14(2), 60-74. https://doi.org/10.11648/j.sjc.20261402.13

    Copy | Download

    ACS Style

    Mabou, J. B. L.; Nforna, E. A.; Makota, S.; Poumve, H. Z.; Malama, S., et al. A Study on the Adsorption of Methyl Orange in Aqueous Solution by Activated Carbon Prepared from Neem Oil Cakes: Kinetic and Thermodynamic Analyses. Sci. J. Chem. 2026, 14(2), 60-74. doi: 10.11648/j.sjc.20261402.13

    Copy | Download

    AMA Style

    Mabou JBL, Nforna EA, Makota S, Poumve HZ, Malama S, et al. A Study on the Adsorption of Methyl Orange in Aqueous Solution by Activated Carbon Prepared from Neem Oil Cakes: Kinetic and Thermodynamic Analyses. Sci J Chem. 2026;14(2):60-74. doi: 10.11648/j.sjc.20261402.13

    Copy | Download

  • @article{10.11648/j.sjc.20261402.13,
      author = {Jules Blaise Leuna Mabou and Edwin Akongnwi Nforna and Suzanne Makota and Harlette Zapenaha Poumve and Simon Malama and Jacques Bomiko Mbouombouo and Lincold Nintedem Magapgie and Pierre Gerard Tchieta},
      title = {A Study on the Adsorption of Methyl Orange in Aqueous Solution by Activated Carbon Prepared from Neem Oil Cakes: Kinetic and Thermodynamic Analyses},
      journal = {Science Journal of Chemistry},
      volume = {14},
      number = {2},
      pages = {60-74},
      doi = {10.11648/j.sjc.20261402.13},
      url = {https://doi.org/10.11648/j.sjc.20261402.13},
      eprint = {https://article.sciencepublishinggroup.com/pdf/10.11648.j.sjc.20261402.13},
      abstract = {This worked is aimed at studying the thermodynamic and kinetic adsorption of methyl orange (MO) onto activated carbon (AC) obtained from Neem oil cakes (NOC). The ACs were synthesized by chemical activation of Neem oil cakes with H3PO4 of 2, 5 and 10 percent (respectively labeled AC-2, AC-5, and AC-10) followed by pyrolysis at 450°C for 1 hr. Various characterizations of the synthesized ACs include Fourier Transformed Infrared spectroscopy FTIR, microstructural and elemental analyses (SEM/TEM, EDS), pHPZC, moisture content, and iodine and methylene blue adsorption methods were used to determine the surface area. The ACs were employed to adsorb methyl orange (MO) from a synthetic aqueous solution. The results obtained show that: pHPZC was less than 7, indicating that the three activated carbons have predominantly acidic surface. The adsorbents AC-5 and AC-10 have microporous and mesoporous structures respectively, with respective specific surface area by iodine adsorption (SI2) method estimated to be around 688.45 and 689.70 m2/g. The adsorption of MO was pH dependent, with an optimal adsorption at pH =2. The EDS results confirm that these adsorbents are primarily composed of carbon. Results from kinetic studies showed that the adsorption process followed a pseudo second order kinetic model. The experimental data from the equilibrium adsorption of MO on the ACs showed the best fit with the Langmuir isotherm, suggesting monolayer adsorption. Maximum adsorption capacity of 232.558 mg.g-1 was obtained for AC-10. These results show that the adsorption of MO is spontaneous and endothermic. Chemisorption is the predominant mechanism for MO removal on AC-2, AC-5, and AC-10.},
     year = {2026}
    }
    

    Copy | Download

  • TY  - JOUR
    T1  - A Study on the Adsorption of Methyl Orange in Aqueous Solution by Activated Carbon Prepared from Neem Oil Cakes: Kinetic and Thermodynamic Analyses
    AU  - Jules Blaise Leuna Mabou
    AU  - Edwin Akongnwi Nforna
    AU  - Suzanne Makota
    AU  - Harlette Zapenaha Poumve
    AU  - Simon Malama
    AU  - Jacques Bomiko Mbouombouo
    AU  - Lincold Nintedem Magapgie
    AU  - Pierre Gerard Tchieta
    Y1  - 2026/04/30
    PY  - 2026
    N1  - https://doi.org/10.11648/j.sjc.20261402.13
    DO  - 10.11648/j.sjc.20261402.13
    T2  - Science Journal of Chemistry
    JF  - Science Journal of Chemistry
    JO  - Science Journal of Chemistry
    SP  - 60
    EP  - 74
    PB  - Science Publishing Group
    SN  - 2330-099X
    UR  - https://doi.org/10.11648/j.sjc.20261402.13
    AB  - This worked is aimed at studying the thermodynamic and kinetic adsorption of methyl orange (MO) onto activated carbon (AC) obtained from Neem oil cakes (NOC). The ACs were synthesized by chemical activation of Neem oil cakes with H3PO4 of 2, 5 and 10 percent (respectively labeled AC-2, AC-5, and AC-10) followed by pyrolysis at 450°C for 1 hr. Various characterizations of the synthesized ACs include Fourier Transformed Infrared spectroscopy FTIR, microstructural and elemental analyses (SEM/TEM, EDS), pHPZC, moisture content, and iodine and methylene blue adsorption methods were used to determine the surface area. The ACs were employed to adsorb methyl orange (MO) from a synthetic aqueous solution. The results obtained show that: pHPZC was less than 7, indicating that the three activated carbons have predominantly acidic surface. The adsorbents AC-5 and AC-10 have microporous and mesoporous structures respectively, with respective specific surface area by iodine adsorption (SI2) method estimated to be around 688.45 and 689.70 m2/g. The adsorption of MO was pH dependent, with an optimal adsorption at pH =2. The EDS results confirm that these adsorbents are primarily composed of carbon. Results from kinetic studies showed that the adsorption process followed a pseudo second order kinetic model. The experimental data from the equilibrium adsorption of MO on the ACs showed the best fit with the Langmuir isotherm, suggesting monolayer adsorption. Maximum adsorption capacity of 232.558 mg.g-1 was obtained for AC-10. These results show that the adsorption of MO is spontaneous and endothermic. Chemisorption is the predominant mechanism for MO removal on AC-2, AC-5, and AC-10.
    VL  - 14
    IS  - 2
    ER  - 

    Copy | Download

Author Information
  • Department of Chemistry, University of Douala, Douala, Cameroon

  • Department of Fundamental Science, University of Bamenda, Bamenda, Cameroon

  • Department of Chemistry, University of Douala, Douala, Cameroon

  • Department of Chemistry, University of Douala, Douala, Cameroon

  • Department of Chemistry, University of Douala, Douala, Cameroon

  • Department of Chemistry, University of Douala, Douala, Cameroon

  • Department of Chemistry, University of Douala, Douala, Cameroon

  • Department of Chemistry, University of Douala, Douala, Cameroon

  • Abstract
  • Keywords
  • Document Sections

    1. 1. Introduction
    2. 2. Experimental
    3. 3. Results and Discussions
    4. 4. Conclusion
    Show Full Outline
  • Abbreviations
  • Acknowledgments
  • Author Contributions
  • Data Availability Statement
  • Conflicts of Interest
  • References
  • Cite This Article
  • Author Information