Guinea, like many countries in sub-Saharan Africa, faces persistent challenges in terms of mobile network coverage and quality of service (QoS). Despite these difficulties, the penetration rate of mobile telephony and internet access continues to increase. This article aims to analyze the coverage and quality of service of 3G/4G networks in Guinea, as well as to assess user satisfaction in this context. To do this, an online survey was conducted among a sample of 384 users of the Guinean mobile network. The responses were analyzed automatically via Google Forms, while Excel and Atlas software allowed for an in-depth comparison of the results. The observations from the comparison survey also confirm the data published by the ARPT. The analysis of the main results reveals that, although the orange operator has rolled out 4G in the eight administrative regions, coverage remains insufficient in most regions of the country. The quality of voice calls remains average and frequent interruptions are reported. In addition, 67.2% of respondents say they have difficulty accessing online services. Overall, satisfaction with network coverage, internet connection and value for money for calls and packages appears to be low. Mobile network users therefore recommend significant improvements in all these aspects.
| Published in | Science Journal of Energy Engineering (Volume 13, Issue 3) |
| DOI | 10.11648/j.sjee.20251303.16 |
| Page(s) | 154-166 |
| Creative Commons |
This is an Open Access article, distributed under the terms of the Creative Commons Attribution 4.0 International License (http://creativecommons.org/licenses/by/4.0/), which permits unrestricted use, distribution and reproduction in any medium or format, provided the original work is properly cited. |
| Copyright |
Copyright © The Author(s), 2025. Published by Science Publishing Group |
Network Coverage, Quality of Service, User Satisfaction, 3G/4G Mobile Networks
Regions dministrative | Regional population Nx | Nx rate (%) | Sample size nx |
|---|---|---|---|
Conakry | 2 152 715 | 15.80% | 60 |
Boké | 1 403 758 | 10.30% | 40 |
Kindia | 2 022 428 | 14.85% | 57 |
Mamou | 947 236 | 6.95% | 27 |
Labé | 1 286 939 | 9.45% | 36 |
Faranah | 1 220 364 | 8.96% | 34 |
Kankan | 2 543 364 | 18.67% | 72 |
Nzérékoré | 2 045 595 | 15.02% | 58 |
Total | 13 622 399 | 100% | 384 |
ARPT | Regulatory Authority for Posts and Telecommunications |
ISP | Internet Service Providers |
N/A | Not Applicable |
QoS | Quality of Service |
SMS | Short Message Service |
ICT | Information and Communication Technologies |
3G | 3rd Generation |
4G | 4th Generation |
5G | 5th Generation |
| [1] | World of Conferences, «XX international scientific conference. Tallinn. Estonia. 26-27.06.2025», 27 juin 2025, World of Conferences. |
| [2] | Awa TRAORE (2019) pp. 87-105 «Imact-economique-et-technologique-de-la-telephonie-mobile-en-Economic-and-technological-impact-of-mobile-telephony-in-Sub-Saharan-Africa» Université Cheikh Anta DIOP de Dakar. |
| [3] |
Autorité de Régulation des Postes et Télécommunications. ARPT : Rapport Annuel 2023. Available from:
https://www.arpt.gov.gn/rapports-annuels/ (accessed July 21, 2025). |
| [4] |
International Télécommunication Union. IUT : Rapport, Etude sur la connectivité internationale d’Internet en Afrique subsaharienne. Available from:
https://www.itu.int/en/itu-d/regulatory-market/documents/iic_africa_final-fr.pdf (accessed July 19, 2025). |
| [5] |
International Télécommunication Union. IUT : Development Sector, Measuring digital development Facts and Figures 2022. Available from:
https://www.itu.int/hub/publication/d-ind-ict_mdd-2022/ (accessed July 19, 2025). |
| [6] | GSMA (2023) «Fiscalité-de-la-téléphonie-mobile-et-développement-numérique». |
| [7] | M. A. Bouslah et M. Djebbouri (2022) «Une étude appliquée pour la mesure de l’impact de la qualité du service du mobile (sur la satisfaction client par les équation structurelle (cas de l’Algérie)». |
| [8] |
Autorité de Régulation des Télécommunications de Côte d’Ivoire. ARTCI : mission, contrôle de la Qualité des Services de télécommunications. Available from:
https://www.artci.ci/images/stories/pdf/qualite_service/qos-2019/rapport_controle_inopine_qos2019_songassou_nzi.pdf (accessed July 20, 2025). |
| [9] | N. T. H. Francis (2023) «QUALITE PERÇUE ET SATISFACTION DES CLIENTS BUSINESS-TO-CONSUMER DE LA TELEPHONIE MOBILE EN CONTEXTE CAMEROUNAIS», vol. 6. |
| [10] |
Autorité de Régulation des Postes et Télécommunications. ARPT : Mission, Audit de la QoS des Opérateurs de Téléphonie Mobile et Fournisseurs d’Accès Internet. Available from:
https://www.arpt.gov.gn/mission-daudit-de-la-qos-des-operateurs-de-telephonie-mobile-et-fournisseurs-dacces-internet-en-republique-de-guinee/ (accessed July 25, 2025). |
| [11] | Mamadou Badian DIALLO (2005) «Enquête Démographique et de Santé». |
| [12] | Institut National de la Statistique INS : Annuaire Statistique 2022. vailable from: |
| [13] | S. K. Ahmed, «How to choose a sampling technique and determine sample size for research: A simplified guide for researchers», Oral Oncology Reports, vol. 12, p. 100662, déc. 2024, |
| [14] | Zineb Serhier, Karima Bendahhou, Ahmed Ben Abdelaziz, Mohammed Bennani Othmani, Réseau Maghrébin (2020) «La Tunisie Médicale». |
| [15] |
Atlas de couverture - Guinée. Available from:
https://atlas.arpt.gov.gn/ (accessed August 1, 2025). |
| [16] |
Autorité de Régulation des Postes et Télécommunications. ARPT : Rapport Annuel 2019. Available from:
https://www.arpt.gov.gn/rapport-annuel-2019/ (accessed July 18, 2025). |
APA Style
Barry, K. A., Soumah, S., Diallo, M. S., Camara, M. A., Diallo, A. Y., et al. (2025). Multi-Parametric Analysis of the Coverage and Quality of Service (QoS) of 3G/4G Networks in the Sub-Saharan Environment: The Case of the Republic of Guinea. Science Journal of Energy Engineering, 13(3), 154-166. https://doi.org/10.11648/j.sjee.20251303.16
ACS Style
Barry, K. A.; Soumah, S.; Diallo, M. S.; Camara, M. A.; Diallo, A. Y., et al. Multi-Parametric Analysis of the Coverage and Quality of Service (QoS) of 3G/4G Networks in the Sub-Saharan Environment: The Case of the Republic of Guinea. Sci. J. Energy Eng. 2025, 13(3), 154-166. doi: 10.11648/j.sjee.20251303.16
AMA Style
Barry KA, Soumah S, Diallo MS, Camara MA, Diallo AY, et al. Multi-Parametric Analysis of the Coverage and Quality of Service (QoS) of 3G/4G Networks in the Sub-Saharan Environment: The Case of the Republic of Guinea. Sci J Energy Eng. 2025;13(3):154-166. doi: 10.11648/j.sjee.20251303.16
@article{10.11648/j.sjee.20251303.16,
  author = {Kadiatou Aissatou Barry and Souleymane Soumah and Mamadou Sadigou Diallo and Mohamed Ansoumane Camara and Alpha Yaya Diallo and Mamadou Alpha Barry},
  title = {Multi-Parametric Analysis of the Coverage and Quality of Service (QoS) of 3G/4G Networks in the Sub-Saharan Environment: The Case of the Republic of Guinea
},
  journal = {Science Journal of Energy Engineering},
  volume = {13},
  number = {3},
  pages = {154-166},
  doi = {10.11648/j.sjee.20251303.16},
  url = {https://doi.org/10.11648/j.sjee.20251303.16},
  eprint = {https://article.sciencepublishinggroup.com/pdf/10.11648.j.sjee.20251303.16},
  abstract = {Guinea, like many countries in sub-Saharan Africa, faces persistent challenges in terms of mobile network coverage and quality of service (QoS). Despite these difficulties, the penetration rate of mobile telephony and internet access continues to increase. This article aims to analyze the coverage and quality of service of 3G/4G networks in Guinea, as well as to assess user satisfaction in this context. To do this, an online survey was conducted among a sample of 384 users of the Guinean mobile network. The responses were analyzed automatically via Google Forms, while Excel and Atlas software allowed for an in-depth comparison of the results. The observations from the comparison survey also confirm the data published by the ARPT. The analysis of the main results reveals that, although the orange operator has rolled out 4G in the eight administrative regions, coverage remains insufficient in most regions of the country. The quality of voice calls remains average and frequent interruptions are reported. In addition, 67.2% of respondents say they have difficulty accessing online services. Overall, satisfaction with network coverage, internet connection and value for money for calls and packages appears to be low. Mobile network users therefore recommend significant improvements in all these aspects.
},
 year = {2025}
}
TY  - JOUR
T1  - Multi-Parametric Analysis of the Coverage and Quality of Service (QoS) of 3G/4G Networks in the Sub-Saharan Environment: The Case of the Republic of Guinea

AU  - Kadiatou Aissatou Barry
AU  - Souleymane Soumah
AU  - Mamadou Sadigou Diallo
AU  - Mohamed Ansoumane Camara
AU  - Alpha Yaya Diallo
AU  - Mamadou Alpha Barry
Y1  - 2025/09/23
PY  - 2025
N1  - https://doi.org/10.11648/j.sjee.20251303.16
DO  - 10.11648/j.sjee.20251303.16
T2  - Science Journal of Energy Engineering
JF  - Science Journal of Energy Engineering
JO  - Science Journal of Energy Engineering
SP  - 154
EP  - 166
PB  - Science Publishing Group
SN  - 2376-8126
UR  - https://doi.org/10.11648/j.sjee.20251303.16
AB  - Guinea, like many countries in sub-Saharan Africa, faces persistent challenges in terms of mobile network coverage and quality of service (QoS). Despite these difficulties, the penetration rate of mobile telephony and internet access continues to increase. This article aims to analyze the coverage and quality of service of 3G/4G networks in Guinea, as well as to assess user satisfaction in this context. To do this, an online survey was conducted among a sample of 384 users of the Guinean mobile network. The responses were analyzed automatically via Google Forms, while Excel and Atlas software allowed for an in-depth comparison of the results. The observations from the comparison survey also confirm the data published by the ARPT. The analysis of the main results reveals that, although the orange operator has rolled out 4G in the eight administrative regions, coverage remains insufficient in most regions of the country. The quality of voice calls remains average and frequent interruptions are reported. In addition, 67.2% of respondents say they have difficulty accessing online services. Overall, satisfaction with network coverage, internet connection and value for money for calls and packages appears to be low. Mobile network users therefore recommend significant improvements in all these aspects.

VL  - 13
IS  - 3
ER  -
Department of Telecommunication, Gamal Abdel Nasser University of Conakry, Conakry, Guinea; Automatic and Energetic Lecturing and Research Laboratory (LENA), Gamal Abdel Nasser University of Conakry, Conakry, Guinea
Automatic and Energetic Lecturing and Research Laboratory (LENA), Gamal Abdel Nasser University of Conakry, Conakry, Guinea; Water, Energy, Environment and Industrial Processes Laboratory (LE3PI), Cheikh Anta Diop University, Dakar, Senegal
Department of Telecommunication, Gamal Abdel Nasser University of Conakry, Conakry, Guinea
Automatic and Energetic Lecturing and Research Laboratory (LENA), Gamal Abdel Nasser University of Conakry, Conakry, Guinea
Department of Telecommunication, Gamal Abdel Nasser University of Conakry, Conakry, Guinea
Telecommunications and Computer Science, Multination Higher School of Telecommunication (ESMT), Dakar, Senegal
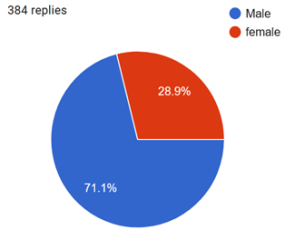
Figure 1. Gender.
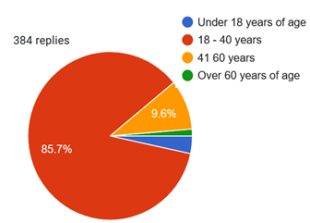
Figure 2. Age.
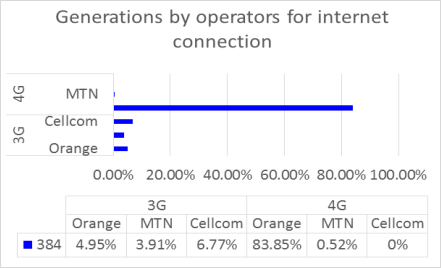
Figure 3. Mobile network operator and generation used.
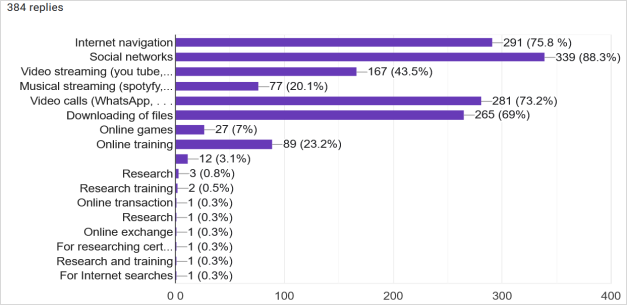
Figure 4. Services used for the 3G/4G network.
Figure 5. Area covered.
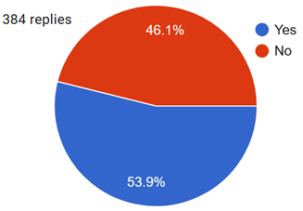
Figure 6. White area.
Figure 7. Voice Calls.
Figure 8. Voice calls when it rains.
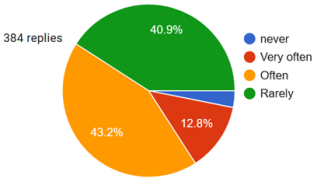
Figure 9. Call Drop Frequency.
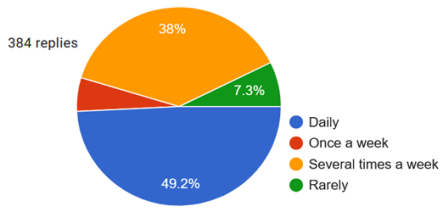
Figure 10. Frequency of Internet use.
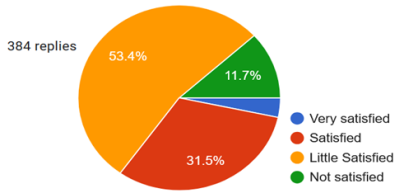
Figure 11. Satisfaction with coverage.
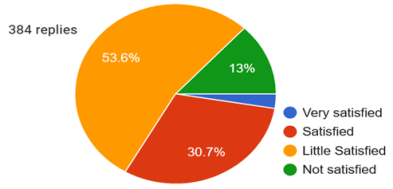
Figure 12. Internet connection satisfaction.
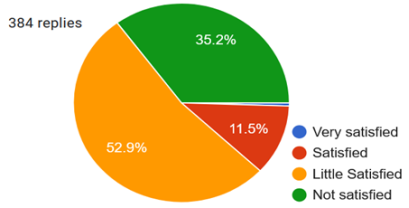
Figure 13. Satisfaction with quality and price.
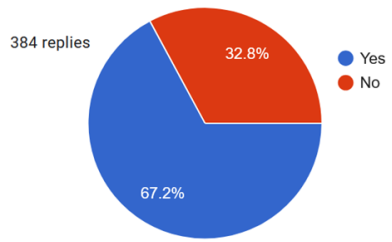
Figure 14. Difficulty accessing services.
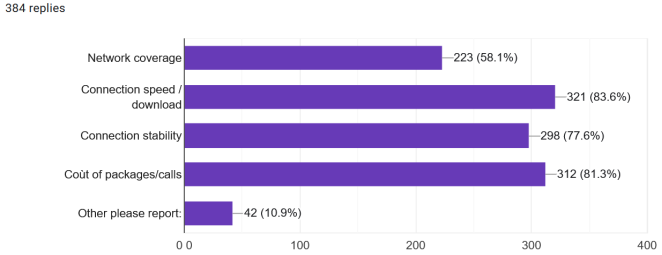
Figure 15. Aspects of the network to be improved.
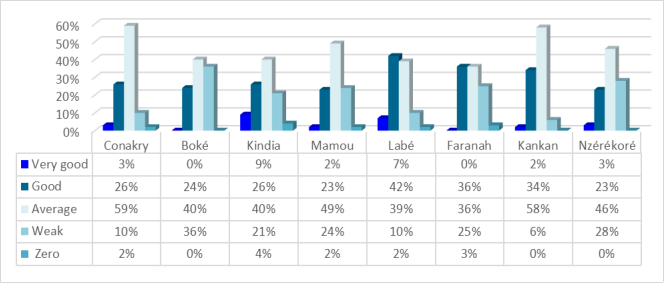
Figure 16. Quality of coverage by region.
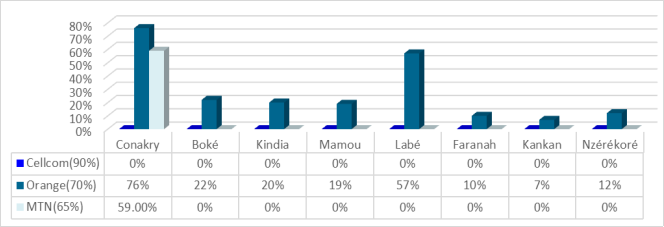
Figure 17. 4G coverage rate by region.
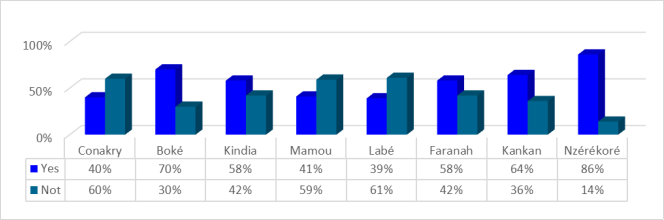
Figure 18. White area by region.
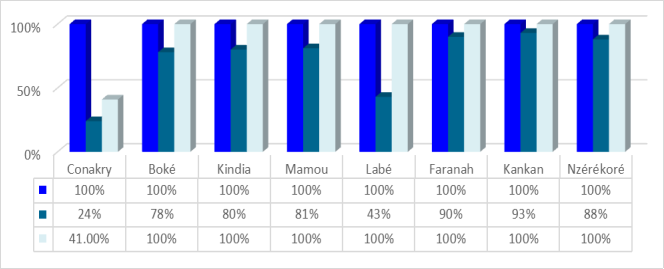
Figure 19. 4G white zone rate by region.
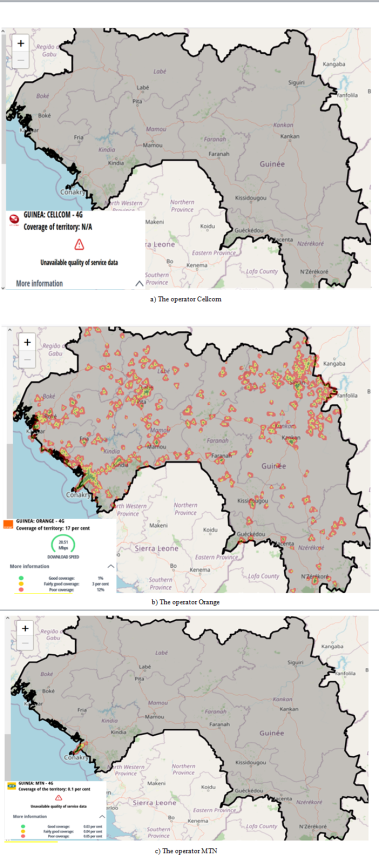
Figure 20. 4G network coverage map in Guinea [15].
Information

