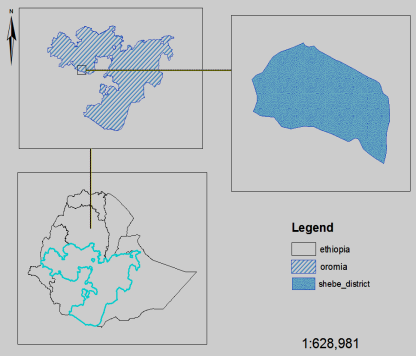
This research investigated the impact of contract farming on the livelihoods of smallholder coffee producers in the Shebe Sombo district of Ethiopia. Specifically, the study aimed to understand factors influencing farmer participation in contract coffee production, evaluate the impact of contract farming on household income, and analyze the structure of existing contract farming arrangements. Employing a two-stage sampling method, the study collected data from 71 contract farming participants and 63 non-participant households through structured interviews. Data analysis involved descriptive statistics, inferential statistics, and an econometric model utilizing propensity score matching to estimate the causal impact of contract farming on household income. The findings revealed a significant positive impact of contract farming on the annual income of participating households. Notably, frequent interaction with agricultural extension services and livestock ownership emerged as key factors positively influencing both farmer participation in contract farming and subsequent income from coffee production. Conversely, larger household sizes and reliance on credit were found to negatively influence both participation in contract farming and overall household income. The study's analysis, utilizing propensity score matching, demonstrated that, on average, involvement in contract farming led to an increase of 8252.21 Ethiopian Birr in household income. These findings strongly suggest that, compared to traditional marketing channels, contract farming offers a more profitable avenue for smallholder coffee farmers to enhance their livelihoods.
| Published in | World Journal of Agricultural Science and Technology (Volume 3, Issue 2) |
| DOI | 10.11648/j.wjast.20250302.13 |
| Page(s) | 32-43 |
| Creative Commons |
This is an Open Access article, distributed under the terms of the Creative Commons Attribution 4.0 International License (http://creativecommons.org/licenses/by/4.0/), which permits unrestricted use, distribution and reproduction in any medium or format, provided the original work is properly cited. |
| Copyright |
Copyright © The Author(s), 2025. Published by Science Publishing Group |
Coffee, Contract Farming, Impact, Propensity Score Matching, ATT
Variables | Total N=134 | Participants N=73 | Non-participants N=61 | t-test | |||
|---|---|---|---|---|---|---|---|
Mean | Std.dev. | Mean | Std.dev. | Mean | Std.dev | ||
Average income | 19585.37 | 6952.65 | 23375.55 | 6798.33 | 15313.91 | 4065.01 | 8.29*** |
Age | 35.96 | 7.71 | 37.21 | 8.20 | 34.54 | 6.92 | 2.02*** |
Education | 3.20 | 2.92 | 3.48 | 3.00 | 2.89 | 2.81 | 1.17 |
Family size | 6.10 | 2.47 | 5.81 | 2.18 | 6.41 | 2.74 | 1.43 |
Total livestock | 9.96 | 5.01 | 11.63 | 5.08 | 8.08 | 4.23 | 4.37*** |
Experience | 11.44 | 7.39 | 12.54 | 8.19 | 10.21 | 6.21 | 1.84** |
Distance to cooperative | 134.10 | 42.62 | 131.54 | 41.46 | 136.98 | 44.05 | 0.74 |
Extension contact | 2.22 | 1.76 | 2.85 | 1.90 | 1.52 | 1.27 | 4.67*** |
Variables | Total N=134 | Participants N=71 | Non-participants N=63 | χ2-Value | ||||
|---|---|---|---|---|---|---|---|---|
N | % | N | % | N | % | |||
Gender | Male | 122 | 91.04 | 65 | 48.51 | 57 | 42.54 | 0.05 |
Female | 12 | 8.96 | 6 | 4.48 | 6 | 4.48 | ||
Credit use | Yes | 58 | 43.28 | 27 | 20.15 | 31 | 23.13 | 1.79 |
No | 76 | 56.72 | 44 | 32.84 | 32 | 23.88 | ||
Cooperative membership | Member | 74 | 55.22 | 43 | 32.09 | 31 | 23.13 | 1.74 |
Non-member | 60 | 44.78 | 28 | 20.90 | 32 | 23.88 | ||
Variables | Coefficients | Std. Err. | P>Z | Marginal effects |
|---|---|---|---|---|
Gender | -0.246 | 0.471 | 0.602 | -0.095 |
Age | 0.081 | 0.051 | 0.116 | 0.032 |
Education | 0.042 | 0.047 | 0.374 | 0.017 |
Family size | -0.161*** | 0.055 | 0.004 | -0.064 |
Livestock | 0.136*** | 0.034 | 0.000 | 0.054 |
Experience | -0.060 | 0.055 | 0.273 | -0.024 |
Distance to cooperative | 0.001 | 0.004 | 0.752 | 0.0005 |
Extension contact | 0.330*** | 0.082 | 0.000 | 0.131 |
Credit use | -0.575*** | 0.271 | 0.034 | -0.225 |
Cooperative membership | -0.013 | 0.285 | 0.963 | -0.005 |
Matching estimators | Balancing test* | Pseudo-R2 after matching | Matched sample size |
|---|---|---|---|
Nearest Neighbor (NN) | |||
NN (1) | 10 | 0.054 | 116 |
NN (2) | 9 | 0.059 | 116 |
NN (3) | 10 | 0.037 | 116 |
NN (4) | 10 | 0.043 | 116 |
NN (5) | 10 | 0.041 | 116 |
Caliper Matching (CM) | |||
0.01 | 10 | 0.040 | 92 |
0.1 | 10 | 0.054 | 116 |
0.25 | 10 | 0.054 | 116 |
0.5 | 10 | 0.054 | 116 |
Kernel Matching (KM) | |||
With band width of (0.01) | 10 | 0.046 | 92 |
With band width of (0.1) | 10 | 0.027 | 116 |
With band width of (0.25) | 10 | 0.028 | 116 |
With band width of (0.5) | 10 | 0.089 | 116 |
Radius Matching | |||
With band width of (0.01) | 10 | 0.209 | 116 |
With band width of (0.1) | 10 | 0.209 | 116 |
With band width of (0.25) | 10 | 0.209 | 116 |
With band width of (0.5) | 10 | 0.209 | 116 |
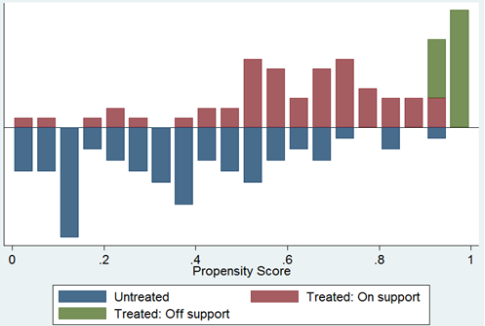
Group | Obs | Mean | Std.Dev | Minimum | Maximum |
|---|---|---|---|---|---|
Total household | 134 | 0.534 | 0.289 | 0.005 | 0.997 |
Treatment household | 71 | 0.697 | 0.237 | 0.028 | 0.997 |
Control household | 63 | 0.351 | 0.226 | 0.005 | 0.921 |
Variables | Sample | Mean | % reduct | t-test | |||
|---|---|---|---|---|---|---|---|
Treated | Control | %bias | Bias | t | p>t | ||
Age | U | 37.21 | 34.54 | 35.2 | 2.02 | 0.045 | |
M | 37.377 | 35.963 | 18.6 | 47.1 | 0.89 | 0.378 | |
Education | U | 3.4789 | 2.8889 | 20.3 | 1.17 | 0.244 | |
M | 3.283 | 2.9918 | 10.0 | 50.6 | 0.49 | 0.624 | |
Family size | U | 5.8028 | 6.4127 | -24.6 | -1.43 | 0.154 | |
M | 5.792 | 6.2736 | -19.4 | 21.1 | -0.95 | 0.344 | |
Livestock | U | 11.634 | 8.0794 | 76.0 | 4.37 | 0.000 | |
M | 10.208 | 9.3218 | 18.9 | 75.1 | 1.08 | 0.284 | |
Experience | U | 12.535 | 10.206 | 32.1 | 1.84 | 0.068 | |
M | 12.755 | 11.462 | 17.8 | 44.5 | 0.83 | 0.406 | |
Distance cooperative | U | 131.55 | 136.98 | -12.7 | -0.74 | 0.463 | |
M | 136.23 | 137.03 | -1.9 | 85.1 | -0.10 | 0.922 | |
Extension contact | U | 2.8451 | 1.5238 | 81.7 | 4.67 | 0.000 | |
M | 2.3208 | 1.9598 | 22.3 | 72.7 | 1.17 | 0.244 | |
Gender | U | .91549 | .90476 | 3.7 | 0.22 | 0.830 | |
M | .92453 | .89094 | 11.7 | -213.0 | 0.59 | 0.555 | |
Credit use | U | .38028 | .49206 | -22.5 | -1.30 | 0.195 | |
M | .39623 | .40484 | -1.7 | 92.3 | -0.09 | 0.929 | |
Sample | Ps R2 | LR chi2 | p>chi2 | MeanBias | MedBias | B | R | %Var |
|---|---|---|---|---|---|---|---|---|
Unmatched | 0.290 | 53.68 | 0.000 | 34.3 | 24.6 | 140.4* | 1.26 | 29 |
Matched | 0.058 | 8.56 | 0.479 | 13.6 | 17.8 | 57.9* | 1.25 | 14 |
Outcome variable | Sample | Treated | Controls | Difference | S.E. | T-stat |
|---|---|---|---|---|---|---|
Annual income (ETB) | Unmatched | 23375.55 | 15313.91 | 8061.65 | 983.23 | 8.20 |
ATT | 23452.15 | 15199.94 | 8252.21 | 1334.47 | 6.18*** |
ATT | Average Treatment Effect on the Treated |
ETB | Ethiopian Birr |
HHs | Households |
KM | Kernel Matching |
LC | Letter of Credit |
NN | Nearest Neighbor |
PSM | Propensity Score Matching |
TLU | Tropical Livestock Units |
| [1] | Ali, U., & Tufa, A. (2024). Current Status of Specialty Coffee Production and Market in Ethiopia: A Review. Journal of Agriculture, Food and Natural Resources, 2(1), 79-91. |
| [2] | Uribe, N. A. (2024). Biodiversity, Global Change, and Ecosystem Services in Agricultural Landscapes (Doctoral dissertation, The University of Vermont and State Agricultural College). |
| [3] | Mwiinga, M. (2017). An Analysis of the Policy Adequacy of the Farmer Input Support Programme (FISP) On Agricultural Development Pertaining To Small Scale Farmers. |
| [4] | Christodoulou, I., Rizomyliotis, I., Konstantoulaki, K., Nazarian, A., & Binh, D. (2024). Transforming the remittance industry: Harnessing the power of blockchain technology. Journal of Enterprise Information Management, 37(5), 1551-1577. |
| [5] | Ncube, D. (2020). The importance of contract farming to small-scale farmers in Africa and the implications for policy: A review scenario. The Open Agriculture Journal, 14(1). |
| [6] | Taro Yamane (1967): Elementry sampling theory. First Edition, Published by Prentice Hall, USA. |
| [7] | Cohen, T. H., Lowenkamp, C. T., Bechtel, K., & Flores, A. W. (2020). Risk assessment overrides: Shuffling the risk deck without any improvements in prediction. Criminal Justice and Behavior, 47(12), 1609-1629. |
| [8] | Azumah, S. B., Donkoh, S. A., & Ansah, I. G. K. (2017). Contract farming and the adoption of climate change coping and adaptation strategies in the northern region of Ghana. Environment, Development and Sustainability, 19(6), 2275-2295. |
| [9] | Selorm, A., Sarpong, D. B. S., Egyir, I. S., Mensah Bonsu, A., & An, H. (2023). Does contract farming affect technical efficiency? Evidence from soybean farmers in Northern Ghana. Agricultural and Food Economics, 11(1), 9. |
| [10] | Visconti, G., & Zubizarreta, J. R. (2018). Handling limited overlap in observational studies with cardinality matching. Observational Studies, 4(1), 217-249. |
| [11] | King, G., & Nielsen, R. (2019). Why propensity scores should not be used for matching. Political analysis, 27(4), 435-454. |
| [12] | Liu, Y., Li, H., Zhou, Y., & Matsouaka, R. A. (2024). Average treatment effect on the treated, under lack of positivity. Statistical Methods in Medical Research, 33(10), 1689-1717. |
| [13] | Wubie, D. A. (2024). The Status and Challenges of Contract Farming Engagement in Gimbo District, Kafa Zone, South West Ethiopia People’s Region, Ethiopia. World Journal of Agricultural Science and Technology, 2(3), 76-89. |
| [14] | Alemayehu Dagne, 2017. Impacts of Contract Farming on the Income and Output of Smallholder Coffee Farmers: The Case of Oromia Region, Jimma Zone, and Limmu Sekka Wereda. Ethiopian Journal of Business and Economics (The), 7(1), pp. 1-43. |
| [15] | Basri, M. H., & Fariyanti, A. (2024). The Impact of Contract Farming on The Production Risk of Coffee Farming in Lampung. Jurnal Manajemen & Agribisnis, 21(2), 237-237. |
| [16] | Hung Anh, N., Bokelmann, W., Thi Thuan, N., Thi Nga, D., & Van Minh, N. (2019). Smallholders’ preferences for different contract farming models: Empirical evidence from sustainable certified coffee production in Vietnam. Sustainability, 11(14), 3799. |
APA Style
Hordofa, M. D., Mohammed, J. H., Addis, E. M., Gejea, Y. M. (2025). Impact of Contract Farming Scheme on Smallholder Farmers’ Income: The Case of Coffee Farming System of Shebe Sombo, South West Ethiopia. World Journal of Agricultural Science and Technology, 3(2), 32-43. https://doi.org/10.11648/j.wjast.20250302.13
ACS Style
Hordofa, M. D.; Mohammed, J. H.; Addis, E. M.; Gejea, Y. M. Impact of Contract Farming Scheme on Smallholder Farmers’ Income: The Case of Coffee Farming System of Shebe Sombo, South West Ethiopia. World J. Agric. Sci. Technol. 2025, 3(2), 32-43. doi: 10.11648/j.wjast.20250302.13
@article{10.11648/j.wjast.20250302.13,
  author = {Meditu Debela Hordofa and Jema Haji Mohammed and Ermias Melaku Addis and Yonas Muleta Gejea},
  title = {Impact of Contract Farming Scheme on Smallholder Farmers’ Income: The Case of Coffee Farming System of Shebe Sombo, South West Ethiopia},
  journal = {World Journal of Agricultural Science and Technology},
  volume = {3},
  number = {2},
  pages = {32-43},
  doi = {10.11648/j.wjast.20250302.13},
  url = {https://doi.org/10.11648/j.wjast.20250302.13},
  eprint = {https://article.sciencepublishinggroup.com/pdf/10.11648.j.wjast.20250302.13},
  abstract = {This research investigated the impact of contract farming on the livelihoods of smallholder coffee producers in the Shebe Sombo district of Ethiopia. Specifically, the study aimed to understand factors influencing farmer participation in contract coffee production, evaluate the impact of contract farming on household income, and analyze the structure of existing contract farming arrangements. Employing a two-stage sampling method, the study collected data from 71 contract farming participants and 63 non-participant households through structured interviews. Data analysis involved descriptive statistics, inferential statistics, and an econometric model utilizing propensity score matching to estimate the causal impact of contract farming on household income. The findings revealed a significant positive impact of contract farming on the annual income of participating households. Notably, frequent interaction with agricultural extension services and livestock ownership emerged as key factors positively influencing both farmer participation in contract farming and subsequent income from coffee production. Conversely, larger household sizes and reliance on credit were found to negatively influence both participation in contract farming and overall household income. The study's analysis, utilizing propensity score matching, demonstrated that, on average, involvement in contract farming led to an increase of 8252.21 Ethiopian Birr in household income. These findings strongly suggest that, compared to traditional marketing channels, contract farming offers a more profitable avenue for smallholder coffee farmers to enhance their livelihoods.},
 year = {2025}
}
TY  - JOUR
T1  - Impact of Contract Farming Scheme on Smallholder Farmers’ Income: The Case of Coffee Farming System of Shebe Sombo, South West Ethiopia
AU  - Meditu Debela Hordofa
AU  - Jema Haji Mohammed
AU  - Ermias Melaku Addis
AU  - Yonas Muleta Gejea
Y1  - 2025/06/30
PY  - 2025
N1  - https://doi.org/10.11648/j.wjast.20250302.13
DO  - 10.11648/j.wjast.20250302.13
T2  - World Journal of Agricultural Science and Technology
JF  - World Journal of Agricultural Science and Technology
JO  - World Journal of Agricultural Science and Technology
SP  - 32
EP  - 43
PB  - Science Publishing Group
SN  - 2994-7332
UR  - https://doi.org/10.11648/j.wjast.20250302.13
AB  - This research investigated the impact of contract farming on the livelihoods of smallholder coffee producers in the Shebe Sombo district of Ethiopia. Specifically, the study aimed to understand factors influencing farmer participation in contract coffee production, evaluate the impact of contract farming on household income, and analyze the structure of existing contract farming arrangements. Employing a two-stage sampling method, the study collected data from 71 contract farming participants and 63 non-participant households through structured interviews. Data analysis involved descriptive statistics, inferential statistics, and an econometric model utilizing propensity score matching to estimate the causal impact of contract farming on household income. The findings revealed a significant positive impact of contract farming on the annual income of participating households. Notably, frequent interaction with agricultural extension services and livestock ownership emerged as key factors positively influencing both farmer participation in contract farming and subsequent income from coffee production. Conversely, larger household sizes and reliance on credit were found to negatively influence both participation in contract farming and overall household income. The study's analysis, utilizing propensity score matching, demonstrated that, on average, involvement in contract farming led to an increase of 8252.21 Ethiopian Birr in household income. These findings strongly suggest that, compared to traditional marketing channels, contract farming offers a more profitable avenue for smallholder coffee farmers to enhance their livelihoods.
VL  - 3
IS  - 2
ER  -
Agri and Cooperative Business Development, Cooperative Bank of Oromia, Addis Ababa, Ethiopia
Information