Research Article | | Peer-Reviewed

Modelling Carbon Emissions and Associated Factors Towards Environmental Sustainability in Bangladesh

Received: 6 July 2026     Accepted: 16 July 2026     Published: 18 August 2026
Views:       Downloads:
Abstract

Understanding the underlying drivers of carbon emissions is critical for designing effective climate mitigation policies in highly vulnerable emerging economies. This study investigates the long-run and dynamic impacts of economic growth, fossil fuel energy consumption, population dynamics, and forest area on carbon dioxide (CO2) emissions in Bangladesh from 1990 to 2022. Utilizing advanced time-series econometric techniques—including Autoregressive Distributed Lag (ARDL) bounds testing, Dynamic Ordinary Least Squares (DOLS), Fully Modified Ordinary Least Squares (FMOLS), Canonical Cointegration Regression (CCR), and pairwise Granger causality tests—the analysis confirms a stable long-run cointegrating relationship among the variables. The empirical findings reveal that economic expansion and fossil fuel energy consumption significantly increase CO2 emissions, yielding long-run elasticities of 0.58 and 1.58, respectively. Conversely, forest area exerts a substantial moderating effect; a 1% increase in forest cover reduces carbon emissions by approximately 8.65%, underscoring the critical role of forest ecosystems as vital carbon sinks. While population growth exhibits a statistically significant direct impact in the long-run model, it influences emissions indirectly by driving energy demand and economic activity. These results highlight the urgency of an integrated policy framework that simultaneously promotes sustainable growth paths, accelerates the clean energy transition, and strengthens forest conservation strategies.

Published in American Journal of Environmental and Resource Economics (Volume 11, Issue 3)
DOI 10.11648/j.ajere.20261103.12
Page(s) 60-75
Creative Commons

This is an Open Access article, distributed under the terms of the Creative Commons Attribution 4.0 International License (http://creativecommons.org/licenses/by/4.0/), which permits unrestricted use, distribution and reproduction in any medium or format, provided the original work is properly cited.

Copyright

Copyright © The Author(s), 2026. Published by Science Publishing Group

Keywords

Economic Growth, Fossil Fuel, Forest Area Cover, CO2 Emissions, Bangladesh

1. Introduction
Global climate change has been a growing concern for centuries due to its severe consequences. This is due to the rising atmospheric concentrations of greenhouse gases (GHGs), particularly carbon dioxide (CO2) from human activities like the burning of fossil fuels, deforestation, and changes in land use . Population growth accompanied by increasing economic activities and deforestation are the major drivers of CO2 emissions and thereby contribute to the dreadful consequences for the environment and human health . It is, thus, considered a daunting task for the global community to reduce CO2 emissions to ensure sustainability through mitigation policies. In emerging countries like Bangladesh, the problem becomes paramount as the country is resource-poor, leading to vulnerability due to extreme climatic events like drought and flood because of changing rainfall patterns, and frequent and intense heatwaves. The situation is worsening day-by-day as it has a huge population but low growth, rare sources of renewable energy, and the shrinkage of forest areas. It is found that Bangladesh is one of the most vulnerable countries of the world with a "very high risk" score of 27.73 in the Global Climate Risk Index 2024 . Bangladesh, having ratified the Paris Agreement in 2016, committed to reducing national emissions and adapting to climate change impacts, focusing on reducing GHG emissions by 15% by 2030 as part of the Paris Agreement . This contains a 10% unconditional basis, and a 5% conditional basis based on industrialized countries contributing climate finance, technology transfer, and capability building, but Bangladesh was unable to estimate the substantial reduction in CO2 emissions . Thus, Bangladesh needs to formulate policies and capacity building aiming at reducing climate vulnerabilities and ensuring sustainable development, along with maintaining the balance of climate sensitivity, pollution, and economic growth.
Bangladesh, as a developing country, has had commendable economic progress during the last two and a half decades. However, the question remains whether the growth is sustainable with comparatively low environmental vulnerability. Over the period, Bangladesh has demonstrated a consistent GDP growth exceeding 6% annually before recent domestic and international challenges. However, the economy has encountered challenges more recently; the World Bank reduced its growth prediction for FY2026 to 4.6% because of dwindling public and private investment, high inflation, and weaknesses in the financial sector, but forecasted a pickup to 6.1% in FY2027 . The driving factors for this substantial economic progress in Bangladesh are mainly the growing population and the potential labour force. Specifically, increasing women's participation in the labour market has been significant in rural areas, where it reached 50.89% in 2022, compared to 22.59% in urban areas, from only agricultural sectors to industrial and service sectors . Thus, the economic characteristics have been changing and shifting from the major agricultural sector to the industrial sector, resulting in increased energy consumption.
Although global concentration of economic activities is shifting to adopt renewable energy due to political turmoil, sudden energy shocks, climate change, and environmental quality , Bangladesh does not have many renewable energy sources and, on the contrary, uses fossil fuels, which emit CO2 and reduce environmental sustainability. Thus, a lot of fossil fuels (natural gas, oil, coal, etc.) have been used for different purpose that emits tons of carbon dioxide . Due to economic development and population growth, the energy demand in Bangladesh has expanded quickly. Between 1996 and 2016, Bangladesh's CO2 emissions rose by an average of 8.25%, from 0.20 metric tons per capita to 0.53 metric tons .
While global scholars are increasingly exploring the linkages between carbon emissions and macroeconomic aggregates, rigorous econometric research focusing on these dynamics within Bangladesh remains limited. There is a distinct shortage of integrated studies that evaluate economic growth, fossil fuel energy consumption, population dynamics, and forest cover within a single unified time-series framework. Consequently, the long-run elasticities and transmission channels remain inadequately mapped. Therefore, the primary objective of this study is to investigate the dynamic impacts of economic expansion, fossil fuel energy consumption, population growth, and forest area changes on CO2 emissions in Bangladesh.
This research makes several distinct contributions to the empirical literature on environmental economics and climate policy in developing, climate-vulnerable nations. First, by collectively modeling the long-term effects of economic growth, fossil fuel consumption, population dynamics, and forest area within a single framework, it offers one of the most comprehensive time-series analyses for Bangladesh to date. In contrast to existing country-specific studies that evaluate these variables in isolation, this paper implements multiple complementary long-run estimators while explicitly accounting for structural discontinuities in the data. Second, methodologically, the study utilizes a robust combination of DOLS, FMOLS, CCR, and ARDL bounds testing alongside structural break-based cointegration approaches. This multi-estimator strategy mitigates small-sample bias, non-stationarity, and endogeneity issues, thereby enhancing the reliability of the derived elasticities. Third, the findings supply fresh quantitative evidence regarding the disproportionate efficacy of forest conservation as an emissions-mitigation tool, demonstrating that forest expansion yields substantial carbon sequestration benefits that outweigh conventional energy-intensity improvements. Finally, the study clarifies policy discussions by isolating the indirect transmission channels of population pressure, paving the way for more integrated climate, energy, and land-use strategies.
The rest of the article is organized as follows. Following the introduction, Section 2 provides a brief overview of the existing research on the connections between CO2 emissions, population growth, economic expansion, energy use, and forest areas. The Methodology section, presented in the third section, describes the econometric methodologies used in this study and highlights the data and empirical model building. The Empirical Findings are presented in Section 4, and the Discussion is presented in Section 5. Section 6 provides the conclusion, implications, limitations, recommendations, and prospects for further research.
2. Literature Review
A wide range of previous studies, with varying methodological approaches, have been conducted worldwide to explore the association between carbon emissions, economic growth, and energy use. Previous studies suggest that not only economic growth and energy use but also other factors, such as economic complexity , urbanization , policy uncertainty , international trade, technological innovation , renewable energy globalization , and population density can impact environmental quality.
Despite all other significant factors and their interconnections, economic growth is considered the primary driver of CO2 emissions. GDP is a major driver of CO2 emissions, showing directional causality between them in Bangladesh . Using data from Nigeria, it showed that economic expansion in Nigeria is a contributing factor to environmental loss. Whereas a study demonstrated that economic expansion raises CO2 emissions by utilizing time series data for African nations . Moreover, a substantial relationship between CO2 emissions and economic growth found in ASEAN nations . Furthermore, using the DSUR approach on APEC nations, a study found that economic development raises CO2 emissions . Using ARDL, FMOLS, and DOLS estimators on annual data from 1971 to 2016, it is discovered that economic expansion has a favorable impact on CO2 emissions in Mexico . Another study used the ARDL approach and DOLS technique for Malaysia and demonstrated the beneficial effects of economic growth and energy use on CO2 emissions .
Due to a growing interest in the transitions away from fossil fuels, the link between renewable energy use and emissions has been fundamental and increasingly evident in global research focuses. For example, manufacturing solar panels involves some greenhouse gas emissions, but these are minimal compared to burning fossil fuels . It has been demonstrated that the reduction in China's first-quarter CO2 emissions in 2025 was due to a 5.8% drop in the power sector. While power demand grew by 2.5% overall, there was a 4.7% drop in thermal power generation, mainly coal and gas. Increases in solar, wind, and nuclear power generation, driven by investments in new generating capacity, more than covered the growth in demand . In advanced economies, energy-related CO2 emissions decreased by 1.1% (120 Mt CO2) in 2024, driven by a 5.7% decline in coal emissions and a 0.5% drop in oil emissions. The reduction reflects advanced economies' continued deployment of low-emission energy sources, with renewables and nuclear power accounting for over 50% of electricity generation, led by strong growth in wind and solar . It has been confirmed that a long run cointegration relationship exists between increased renewable energy use and decreased carbon emissions . Using panel fully modified least squares (FMOLS), panel dynamic least squares (DOLS), fixed effects (FE), and panel quantile regression, a negative correlation discovered between CO2 emissions and renewable energy use in the BRICS nations . Thus, renewable energy sources produce little to no waste products like CO2 and other pollutants; they have little impact on the environment. Moreover, it might provide a way to address both energy security and global warming .
Investigating the relationship between emissions and other contributing factors, it is said that the speedy growth of urbanization, industrialization, man-made construction, and the growing use of forest areas are very important. Due to the shrinking of forest areas, the overall ecosystem is being degraded, leading to comparatively high levels of emissions. The relationship between forest area and emissions has also been revealed in different earlier studies. A comprehensive study, emphasized that global forests consistently absorb a substantial amount of carbon (around 3.6 Pg C yr−1), offsetting nearly half of fossil-fuel emissions . Another study examined the impacts of forest cover change on carbon stock and emissions in a specific watershed . They found that a decline in forest land due to agricultural expansion led to a significant decrease in carbon stock and an increase in annual carbon emissions. Globally, changes in land-use, forestry, and agricultural activities are the second-largest contributor to CO2 emissions and a major contributor to climate change, accounting for nearly one-fifth of annual global CO2 emissions . While deforestation is estimated to release over three billion tons of CO2 into the atmosphere each year, global forest ecosystems are estimated to absorb over 300 billion tons of CO2 emissions annually . Researching how Bangladesh's forest cover may affect the country's efforts to reduce CO2 emissions.
Due to economic activity and energy consumption, many environmental analyses have concentrated on greenhouse gas emissions into the atmosphere, ignoring population expansion and the usage of forest areas as crucial components of environmental quality, especially in Bangladesh. It is found that the relationship between population growth and CO2 emissions is a well-studied area in environmental economics and demography. A large body of literature suggests a positive correlation, where increasing population size often leads to higher energy demand and subsequent carbon emissions. The IPCC's Sixth Assessment Report (2023) highlights that globally, gross domestic product (GDP) per capita and population growth remained the strongest drivers of CO2 emissions from fossil fuel combustion in the last decade (2010–2019) . These factors increased emissions by 2.3% and 1.2% per year, respectively, outpacing reductions from energy intensity improvements. There is a positive association found between CO2 emissions, population, and technology in Nigeria . While some studies in the past have indicated a marginal impact, recent analysis using data up to 2023 continues to show a positive long-run impact of population growth on carbon emissions, highlighting the need for increased renewable energy adoption. Even though it has become a popular issue among modern researchers globally, there is a dearth of research utilizing econometric methodologies to examine the relationship between CO2 emissions and population growth in Bangladesh.
Based on the above discussion, there are many studies around the world studied the connections between CO2 emissions and its vital drivers; however, there are no studies which investigated the combined impacts of economic expansion, population growth, renewable energy, and forest area on CO2 emissions in a single econometric framework. There are also studies that applied advanced econometric approaches, but few used structural break-based cointegration approaches. There are some studies that investigated the impact of economic growth and energy use on CO2 emissions in Bangladesh, but there is a lack of such studies that investigated the relationship by considering population growth and forest area cover as vital factors of CO2 emissions in Bangladesh.
3. Data and Methodology
3.1. Data Selection for the Study
The present study empirically examines the interrelated and varying influences of economic expansion, population, fossil fuel energy consumption, and forest area on CO2 emissions in Bangladesh by employing the dynamic ordinary least squares (DOLS) regression . Theoretically, rising economic expansion leads to increased energy consumption, primarily from fossil fuels, which increases CO2 emissions. The literature analysis suggested that the population, which is one of the primary drivers of CO2 emissions, has the potential to have a positive impact on emissions, along with the continuous shrinkage of forest area. This study used population, GDP (Constant Price), the utilization of fossil fuel energy consumption, and forest area as explanatory variables, and CO2 emissions as the dependent variable. Time series data from 1990 to 2022 for Bangladesh were obtained from the World Development Indicator (WDI) dataset of the World Bank (WB). The study uses kilotons (kt) to measure CO2 emissions, GDP (constant local currency unit) to measure economic growth, population refers to the total number of people, the percentage of energy usage that comes from fossil fuel energy consumption, and square kilometers (sq. km) to measure forested area. To ensure that the data are normally distributed, the variables are converted to logarithms. The variables with their logarithmic forms, measurement units, and data sources are presented in Table 1, which corresponds to each of the variables for the current study.
Table 1. Variables with their logarithmic forms, units, and data sources.

Variables

Description

Logarithmic forms

Units

Sources

CO2

CO2 emissions

LCO2

Kilotons (kt)

WB

GDP

Economic growth

LGDP

Constant Bangladeshi taka

WB

FFE

Fossil fuel energy consumption

LFFE

% of total

WB

PU

Population Total

LPU

Total Population

WB

FA

Forest area

LFA

Square kilometers (sq. km)

WB

Note: Data source link: https://data.worldbank.org/country/bangladesh
3.2. Model Development
There are extant empirical studies that have investigated the impact of fossil fuel energy use on CO2 emissions in Bangladesh ; however, they did not include population and forested area. The country has a significant share of the global population, which contributes to global CO2 emissions through unplanned urbanization and industrial production . Moreover, hypothesized a negative relationship between forested area cover and CO2 emissions due to the role of forests in carbon sequestration . Therefore, the present study uses the following functional model to explore the impacts of population, use of fossil fuel energy, and forest area on CO2 emissions in Bangladesh.
CO2t=f(GDPt;FFEt;PUt; FAt;)(1)
where CO2t is the CO2 emissions at time t, GDPt is the economic growth at time t, which is the most conventional factor of CO2 emissions, and PUt is the population at time t, FFEt is the fossil fuel energy consumption at time t, and FAt is the forested area at time t. The functional model can be translated into the following statistical model by taking the logarithmic argument to both sides of equation (1).
LCO2t=β0+β1LGDP1t+β2LFFE2t+β3LPU3t+β4LFA4t+εt(2)
Where β0 and εt stand for intercept and error term, respectively. In addition, β1, β2, β3, and β4 represent the coefficients. To evaluate Model 2, the current study uses DOLS, an extended equation of ordinary least squares estimation. The DOLS includes explanatory factors together with leads and lags of their initial difference terms to control endogeneity and compute standard deviations using a covariance matrix of errors that is resistant to serial correlation. The inclusion of the leads and lags of the different terms indicates that the error term is orthogonalized. The DOLS estimator's standard deviations offer a trustworthy test for the variables' statistical significance since they have a normal asymptotic distribution . Using the DOLS method, and if it remains a combined order of integration, it is possible to forecast the dependent variable using explanatory factors—level, lags, and leads. Adding up these explanatory factors, the DOLS evaluation may avoid tiny sample bias as well as endogeneity. The DOLS estimation’s main advantage is the presence of mixed-order integration of individual variables in the cointegrated space. The primary benefit of the DOLS estimation is the cointegrated outline's mixed order integration of individual variables . After ensuring the parameters are cointegrated, the study proceeds with equation (3) to estimate the long-run coefficient utilizing the DOLS method.
ΔLCO2t=β0+β1LCO2t+β2LGDP1t+β3LFFE2t+β4LPU3t+β5LFA4t+j=1py1ΔLCO21t+
j=1py2ΔLGDP2t+j=1py3ΔLFFE3t+j=1py4ΔLPU4t+j=1py5ΔLFA5t+εt(3)
where Δ and p are the first difference and the optimum lag length, respectively, in the above equation (3).
3.2.1. Data Stationarity Technique
To avoid erroneous regression, a unit root test is required. It tests the stationarity of the selected variables in regression by differentiating them and estimates the equation of interest using stationary processes . The empirical literature recognizes that before examining cointegration among variables, the sequence of integration must be identified. Several studies advise performing multiple unit root tests to assess the series integration order because the sample size affects how effective unit root tests are . To look for the autoregressive unit root, the current research employed the Augmented Dickey-Fuller (ADF) test , the Dickey-Fuller generalized least squares (DF-GLS) test , along with the Phillips-Perron (P-P) test . In this study, the unit root test justifies the adoption of the DOLS technique over conventional cointegration methods and verifies that no variable exceeded the order of integration.
3.2.2. ARDL Bounds Test for Cointegration
The Autoregressive Distributed Lag (ARDL) model is required to capture the cointegration among the series data . When evaluating cointegration, the ARDL bounds test offers numerous advantages over alternative one-time integer methods. The ARDL bounds test can be applied to series with a non-uniform order of integration because it does not require that variables be integrated in a specific order, and ARDL also offers a reliable long-term model projection. Regardless of whether the cointegration order occurs at I (0) or I(1) and the basic returning system is in sequence to a portion in the I(2), the ARDL limits testing approach can be applied. Thus, the ARDL bounds test can be depicted through the equation (3) with the optimal lag length. Pesaran and Timmermann presented the critical values for the ARDL bounds test, which follows the F-distribution . The estimating method begins with Eq. (3) and uses OLS to assess the combined significance of the coefficients of the lagged variables. This technique looks for any possibility of a long-term relationship between the variables. If the F-statistics are found within the lower and upper critical values, the test is considered inconclusive.
3.2.3. Pairwise Granger Causality Test
This study aims to find the relationships between the variables that lead to the observed effects. Thus, to determine whether there is a causative relationship between the variables, this study employed the pairwise Granger causality test, which was proposed by Granger . The statistical notion of Granger causality, which is based on prediction, is used in this work because it offers several benefits over alternative time-series evaluation techniques. The primary benefit of this test is its capacity to analyze many lags while discounting higher-order lags. It is said that one time series Y "Granger-causes" another time series X if it aids in forecasting the future of the latter. The time series of these two variables has a data length T, where Xt and Yt (t = 1, 2…, T) represent their respective values at time t. Models Xt and Yt can be subjected to a bivariate autoregressive model by applying the following equations (4) and (5), respectively.
Xt=i=1p(a11,1xt-1 +a12,1yt-1)+μt(4)
yt=i=1p(a21,1xt-1 +a22,1yt-1)+εt(5)
In this case, μt and εt stand for residuals, aij,1 (i,j=1, 2) are the model's coefficients, and p is the model order. Granger causality between X and Y can be detected using F tests, and the coefficients can be computed using simple least squares.
4. Results of the Study
4.1. Summary Statistics
The summary statistics of the chosen variables, including carbon dioxide emissions (LCO2), energy consumption from fossil fuels (LFFE), gross domestic product (LGDP), forest area (LFA), and population (PU), are shown in Table 1. Each variable was selected from 33 annual observations from Bangladesh. The statistical indicators- measures of central tendency (mean and median), dispersion (standard deviation), and distributional characteristics (skewness, kurtosis, and Jarque-Bera test with probability values ) were calculated. All variables have skewness values near zero; the distributions are approximately symmetric and show no significant departures from normality. All variable values for kurtosis are less than 3, indicating that the series are platykurtic. Additionally, all variables have Jarque-Bera test statistics and related p-values above the 0.05 cutoff, confirming the normality null hypothesis. The variables' applicability for additional correlation and econometric modeling is confirmed by these empirical findings to examine the variables' dynamic relationships. Efficient Tests for Normality, Homoscedasticity and Serial Independence of Regression Residuals.
Table 2. Summary Statistics of the Model Variables (1990–2022).

Statistic

LCO2

LFFE

LGDP

LFA

PU

Mean

10.68706

4.16850

30.10022

9.85314

18.77526

Median

10.68011

4.18875

30.05582

9.85279

18.80189

Maximum

11.72866

4.42041

31.04546

9.86284

18.94768

Minimum

9.55164

3.80042

29.28925

9.84342

18.53073

Std_Dev

0.67996

0.18532

0.53619

0.00850

0.12484

Skewness

-0.08166

-0.41966

0.17728

0.03018

-0.45109

Kurtosis

1.74843

2.11265

1.79736

1.23215

1.99899

Jarque_Bera

2.19052

2.05130

2.16156

4.30227

2.49691

Probability

0.33445

0.35856

0.33933

0.11635

0.28695

Observations

33

33

33

33

33

Note. LCO2 = Log of CO2 emissions; LFFE = Log of fossil fuel energy consumption; LGDP = Log of gross domestic product; LFA = Log of forest area; LPU = Log of total population.
4.2. Correlation Between the Variables
To determine whether there are linear correlations between the variables, Table 2 presents a correlation analysis. The results reveal that all the variables are correlated with one another. There is a substantial and positive link between CO2, FFE, GDP, and PU, meaning that as FFE, GDP, and PU rise, CO2 tends to rise as well, and vice versa. However, there is a negative link between CO2 and FA, and between GDP and PU, meaning that as CO2 and PU values increase, FA and PU values tend to decrease, and vice versa. Following the correlation analysis, we proceeded with the unit root tests to see whether the variables were stationary.
Table 3. Summary statistics of the Correlation diagnostic.

Correlation diagnostic

LCO2

LFFE

LGDP

LFA

PU

CO2

1.0000000

0.9907300

0.9932562

-0.9582640

0.9873026

FFE

0.9907300

1.0000000

0.9741927

-0.9319079

0.9942349

GDP

0.9932562

0.9741927

1.0000000

-0.9534144

0.9716338

FA

-0.9582640

-0.9319079

-0.9534144

1.0000000

-0.9331121

PU

0.9873026

0.9942349

0.9716338

-0.9331121

1.0000000

4.3. Results of Unit Root Tests
By verifying that no variable exceeded the order of integration, we used the unit root test to support the feasibility of using the DOLS estimator rather than cointegration. The results of unit root testing with ADF, DF-GLS, and P-P tests are shown in Table 4.
Table 4. The results of unit root tests.

Variables (Logarithmic form)

LCO2

LFFE

LGDP

LFA

PU

ADF

Log_Level

-1.3393

-3.6979***

3.4099

-1.641

-0.8704

First_Diff

-4.3223***

-4.1801***

-4.6011***

-1.3628

-0.2645**

DFGLS

Log Level

-2.2036

-1.1306

-1.2926

-3.2665**

-2.4895

First Diff

-2.7875

-4.0316***

-2.7518

-1.4459***

-0.912

PP

Log_Level

-0.5025

-2.3131

5.3754

-0.4503

-9.2056

First_Diff

-7.6195***

-5.706***

-3.8643***

-1.471

-1.2649***

All three tests show that the variable LCO2 is non-stationary at the level. The ADF and PP confirm the variable is stationary at first, I(1). ADF and DFGLS tests confirm the LFFE variable is stationary at the level, and three of the unit root tests confirm its stationarity at the first difference. ADF and PP tests confirm LGDP is stationary at the first difference. This strongly supports the conclusion that LGDP is I(1). LFA revealed stationarity at the level and first difference by the DFGLS test. Again, in the case of PU, ADF, and PP tests confirmed that it was not stationary at the level, but after the first difference, it was revealed to be stationary. This result means that the selected variables were mixed stationary or may be stationary with a stationarity break, which will confirm the Zivot and Andrews (Z&A) unit root test.
4.4. Zivot and Andrews (Z&A) Unit Root Test
Table 5 below presents the unit root test with 1%, 5%, and 10% significance levels, where we use both the level and first difference for this test. It is confirmed that 3 (LCO2, LFFE, PU) out of 5 variables were stationary at a level with a stationary break, but different variables showed different break points. LCO2 and LFFE were stationary at a 5% significance level, whereas PU was at a 1% significance level. All the variables showed first-difference stationarity at a 1% level of significance. These results support the traditional DOLS model, but after confirming that these variables have a long run cointegrated relationship.
Table 5. The results of the Zivot and Andrews (Z&A) unit root test.

Variable

t-Statistic (Level)

Break Year (Level)

t-Statistic (1st Diff)

Break Year (1st Diff)

LCO2

-5.5544 **

2019

-8.7974 ***

2018

LFFE

-5.2219 **

1994

-8.8583 ***

1995

LGDP

-4.2111

2001

-7.1409 ***

2018

LFA

-2.5894

2015

-7.2120 ***

1999

PU

-14.4573 ***

1999

-1.5777 ***

2010

Note: *** p < 0.01, ** p < 0.05, * p < 0.10
4.5. Cointegration Test Results
The traditional unit root test and the Zivot and Andrews test confirm that the variables used in this study were mixed stationarity at I (0) and I (1). Thus, we have used the ARDL bound test for the confirmation of cointegration among the variables. After verifying the stationarity properties of the series, we performed the ARDL bounds test for cointegration assessment. The F-statistic was computed with an appropriate lag period. Table 6 displays the results of the ARDL bounds test, which examined the cointegration between the variables. For this test, the probable p-value is calculated and compared with the F-statistic value , approximate critical values for k = 4.
Table 6. Findings from cointegration with bounds testing.

F-bounds test Test statistic

Value

Null hypothesis: No level relationship

Significance

I (0) Bound

I (1) Bound

Value of F-statistic

9.4667

10%

2.45

3.52

K

4

5%

2.86

4.01

p-value

0.00001***

1%

3.74

5.06

The results demonstrate the approximate F-statistic value (9.4667) and P-value (0.00001), so we reject the null hypothesis and confirm a long-run connection between the variables. Again, comparing the F-statistic value with the critical bound value, we found that the F-statistic value is greater than 10%, 5%, 2.5%, and 1% of the critical upper limit in order one. That confirms the P-value result and concludes a long-run relationship among the variables.
4.6. The Outcome of DOLS Estimation
The result of DOLS in Table 7 indicates a very high explanatory power of the model. The Multiple R-squared value of 0.9981 indicates that the set of independent variables accounts for about 99.81% of the variation in the dependent variable. The Adjusted R-squared score (0.9978) confirms this result by adjusting for the number of predictors in the model. Additionally, the F-statistic is 3705 with a p-value < 0.0001, indicating that the model is statistically significant overall. This demonstrates that at least one predictor has a non-zero coefficient and contributes considerably to explaining the dependent variable.
The intercept (70.29943) is statistically significant (p = 0.0074), implying that when all explanatory factors are set to zero, the predicted value of the LCO2 is 70.30. LFFE has a significant positive influence (β = 1.584, p < 0.001), resulting in a 1.58 unit increase in the dependent variable when other factors are held constant. LGDP significantly contributes to the model (β = 0.576, p < 0.001). LFA has a substantial negative effect (β = -8.647, p < 0.001), indicating that increasing LFA results in a drop in LCO2. This means that as forested area increases, CO2 emissions are decreasing through the carbon sequestration role of forests . PU is, however, not statistically significant (p = 0.837), implying that it has no major influence in the current model setting. The residual standard error is 0.0316, showing that the model has a low level of unaccounted variance. The median residual near 0 indicates that the residuals are symmetrically distributed around the mean, and there is no strong evidence of bias.
Table 7. Long-Run Coefficients from Dynamic Ordinary Least Squares (DOLS) Estimation.

Variable

Coefficient

Std. Error

t-value

p-value

Intercept

70.29943

24.32067

2.891

.0074**

LFFE

1.58441

0.29773

5.322

.0000***

LGDP

0.57553

0.05553

10.363

.0000***

LFA

-8.64658

2.19522

-3.939

.0005***

LPU

0.08817

0.42331

0.208

.8365

R-squared: 0.9981; Adjusted R-squared: 0.9978; F-statistic: 3705, (p < .0001)

Note. Dependent variable is LCO2.
**p < .01. ***p < .001
4.7. Robustness Check of DOLS
The above two tables show the FMOLS and CCR models' results. This investigation employed the FMOLS and CCR techniques to verify the robustness of DOLS long-term relationships. The FMOLS and CCR models support DOLS findings, with Fossil fuel energy consumption and Gross domestic product statistically significant (p < 0.01), and Forest area continuously negative and significant (p < 0.01). FMOLS found the intercept slightly lower than DOLS, whereas CCR is the same as DOLS.
Table 8. Robustness Checks: FMOLS and CCR Estimation Results.

Variables

FMOLS Model

CCR Model

Coefficient

p-value

Coefficient

p-value

Intercept

59.73177

.0335*

66.26620

0171*

LFFE

1.59289

.0000***

1.39273

.0003***

LGDP

0.58334

.0000***

0.58380

.0000***

LFA

-7.64541

.0034**

-8.61437

.0010**

LPU

0.11118

.8102

0.31593

.4901

Note. Dependent variable is LCO2.
*p < .05. **p < .01. ***p < .001.
The FMOLS estimates for Fossil fuel energy consumption (1.59%) and Gross domestic product (0.58%) are nearly identical to the DOLS results, indicating their dependability. Similarly, the CCR model estimates (Fossil fuel energy consumption = 1.39%, Gross domestic product = 0.58%, and Forest area = -8.61%) support the directional consistency amongst techniques. Population is statistically insignificant in all models (p > 0.1), supporting its minor role. These findings highlight the major roles of Fossil fuel energy consumption and Gross domestic product in increasing the dependent variable, CO2 emission, with Forest area emerging as an important mitigating factor. According to the model's goodness of fit, the independent variables can explain 99% of the variation in the change of the dependent variable, as shown by the R-squared and adjusted R-squared values obtained by FMOLS and CCR estimates.
Table 9. DOLS Diagnostic.

Test

Statistic

p_value

Decision

X-squared Jarque-Bera

0.06867

0.96625

Do not reject H0 (Normal)

LM test Breusch-Godfrey

4.66328

0.09714

Do not reject H0 (No Autocorrelation)

BP Breusch-Pagan

3.46455

0.48329

Do not reject H0 (Homoskedasticity)

The DOLS model's robustness and reliability were assessed using multiple post-estimation diagnostic tests. The Jarque-Bera test for normality returned a statistic of 0.0687 with a p-value of 0.9662, showing that the residuals are normally distributed at the 5% level of significance. Additionally, the results of the Breusch-Godfrey LM test for serial correlation showed no autocorrelation in the residuals, with a p-value of 0.0971 and a test statistic of 4.6633. The Breusch-Pagan test, which was used to evaluate homoskedasticity, produced a test statistic of 3.4645 and a p-value of 0.4833, suggesting that the variance of the residuals is constant. Overall, these diagnostic findings support the assumptions of the model and validate the reliability and statistical adequacy of the DOLS specification in comprehending the underlying economic associations. The model's dependability for policy inferences is further supported by the absence of autocorrelation and heteroscedasticity. As a result, the results can be used with confidence for environmental and economic research.
4.8. Results of Pairwise Granger Causality Test
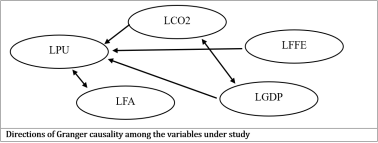
The current study aims to document the causal relationships among the variables. The F-statistic provides evidence that Granger causality exists in the relationship between the variables. The result has been presented in Table 8, which shows the pairwise Granger causality and includes the causality direction between the variables using the right arrow (→) with 1%, 5%, and 10% significance levels. Due to the statistical significance of their F-values, the paired Granger causality test results show that Carbon dioxide emissions and Fossil fuel energy consumption, and Carbon dioxide emissions and Population demonstrate unidirectional causality, hence rejecting the null hypothesis. Carbon dioxide emissions Granger-cause both Gross Domestic Product and Population, suggesting that historical Carbon dioxide emissions values provide predictive information about both variables. Additionally, there is a bidirectional causal relationship between Carbon dioxide emissions and Gross Domestic Product, as Gross Domestic Product Granger-causes Carbon dioxide emissions as well.
Table 10. Pairwise Granger Causality Test Results.

Null Hypothesis

F-Statistic

P-Value

Direction

LCO2 does not Granger Cause LFFE

0.24856

0.78175

LCO2 → LFFE

LCO2 does not Granger Cause LGDP

3.67955

0.03916 **

LCO2 → LGDP

LCO2 does not Granger Cause LFA

0.67939

0.5157

LCO2 → LFA

LCO2 does not Granger Cause PU

10.93963

0.00036 ***

LCO2 → PU

LFFE does not Granger Cause LCO2

0.73399

0.48967

LFFE → LCO2

LFFE does not Granger-cause LGDP

0.23288

0.79388

LFFE → LGDP

LFFE does not Granger Cause LFA

2.05783

0.14803

LFFE → LFA

LFFE does not Granger Cause PU

7.19757

0.00325 ***

LFFE → PU

LGDP does not Granger Cause LCO2

13.7784

8e-05 ***

LGDP → LCO2

LGDP does not Granger Cause LFFE

0.30836

0.7373

LGDP → LFFE

LGDP does not Granger Cause LFA

0.52128

0.59984

LGDP → LFA

LGDP does not Granger Cause PU

8.75454

0.00124 ***

LGDP → PU

LFA does not Granger Cause LCO2

1.02638

0.37237

LFA → LCO2

LFA does not Granger Cause LFFE

2.19306

0.13179

LFA → LFFE

LFA does not Granger Cause LGDP

0.44977

0.64264

LFA → LGDP

LFA does not Granger Cause PU

7.75965

0.00228 ***

LFA → PU

PU does not Granger Cause LCO2

0.89752

0.41983

PU → LCO2

PU does not Granger Cause LFFE

1.95988

0.16114

PU → LFFE

PU does not Granger-cause LGDP

0.38967

0.68117

PU → LGDP

PU does not Granger Cause LFA

3.37562

0.04974 **

PU → LFA

Signif. codes: 0.01 '***' 0.05 '**' 0.10 '*'

The findings also show that there are further unidirectional and bidirectional relations between the explanatory variables, with Fossil fuel energy consumption, Gross domestic product, and Forest area causing Population growth, and Population causes Forest area. These causal relationships draw attention to how the regressors are interdependent and how Population is a dynamically impacted variable. The results also suggested that the other variables showed no Granger causality, which means the null hypothesis of no causality cannot be rejected in those situations.
Figure 1. Directions of Granger causality among the variables.
5. Discussion
The current study investigates how Bangladesh's CO2 emissions are impacted by growing population, economic expansion, fossil fuel energy consumption, and forest area. The findings highlight the major roles of fossil fuel energy consumption and economic expansion in increasing the dependent variable of CO2 emissions, with forest area emerging as an important mitigating factor. The result is supported by and , who found a positive connection between GDP and CO2 emissions in Peru. Our findings are also supported by several studies that have been conducted to ascertain the relationship between CO2 emissions and economic growth for different nations.
Environmental contamination is assumed to increase in tandem with economic growth. More pollution, waste, and environmental degradation occur from increased consumption and development activities, but those development activities are necessary for social improvement . As a result, economic activity seems to be appropriate for environmental development and protection rather than endangering the long-term quality of the environment . An increasingly energy-intensive manufacturing sector has been taking over Bangladesh's economy for a long time, and rising economic growth is related to increased environmental pollution. Thus, the challenging task that Bangladesh is facing is to promote economic development while reducing CO2 emissions to a certain extent. Unless it uses low-carbon technology and renewable energy in industrial manufacturing sectors, it would be difficult for Bangladesh to reduce emissions intensity. Solid policies, methods, and implementation strategies are required in this regard.
In the current study, the potential of fossil fuel energy consumption and emissions nexus has also been explored. According to the study, fossil fuel energy consumption appears to have a negative impact on lowering CO2 emissions in Bangladesh. This finding demonstrates that if there is an increased use of renewable energy, then there is a reduction in CO2 emissions. This finding is consistent with the other studies, i.e., , and in different country cases, which suggests renewable energy leads to environmental sustainability. Lower levels of fossil fuel energy utilization, however, were unable to support both economic expansion and the decrease in emissions in Bangladesh. As a recently developed nation, the energy demand is increasing in Bangladesh with the pace of population growth and industrialization, and it still depends on fossil fuels like coal, oil, and natural gas to produce power and meet the energy demand. Thus, the use of fossil fuels to generate energy in Bangladesh does not advance environmental sustainability, which has been addressed in different studies where everyone has pointed out that various countries rely on non-renewable energy sources, i.e., coal, natural gas, and oil. Thus, enhancing renewable energy production could be the best option for Bangladesh to reduce energy emissions generated by industrialization and population growth and improve environmental quality in the long run.
Population expansion has undoubtedly had a significant impact on CO2 emissions worldwide, and this is also true in Bangladesh, which is the world's most densely populated country. Population growth is intimately correlated with CO2 emissions and other GHGs caused by human activity. In this study, we have found that population growth has a positive impact on CO2 emissions at an exponential growth rate. Our findings have been aligned with another paper, where environmental degradation is said to result from several factors brought on by population expansion . In several other studies in Pakistan, Nepal, and China, it has also been found that the expanding population and CO2 emissions have a strong and positive correlation . Thus, the findings of the current study are consistent with other studies conducted in different regions.
With the expansion of the population, the possibility of deforestation is on the rise due to new settlements for the growing population. This is because deforestation causes a rise in CO2 emissions and deteriorates the global climate. In our study, we have found that intensifying forest areas is one of the most effective ways to reduce GHG emissions and maintain ecological balance. It demonstrates that deforestation, which reduces the amount of forest area, raises CO2 emissions and causes climate change. However, several other studies conducted by , and looked at a negative correlation between CO2 emissions and wooded areas in several nations, which supports our finding. Therefore, limiting deforestation might be the straightforward strategy to lower CO2. Moreover, a key goal of climate change mitigation is to reverse forest losses through conservation, restoration, and improvement.
By using GHG emissions as a stand-in for environmental quality, the current study's findings add to the body of literature by demonstrating the real environmental effects of energy consumption, economic growth, population size, and forest areas in a developing nation like Bangladesh. The study's findings indicate that economic growth should be sustainable and that, to mitigate the effects of burning fossil fuels and consider the industrial operations that harm the environment, we must move toward more renewable energy to meet the growing energy demand in Bangladesh. Furthermore, forest areas should be extended through afforestation and natural regeneration that would help reduce carbon emissions, conserve biodiversity, revitalize ecosystems, and improve environmental quality.
6. Conclusion and Policy Directions
6.1. Conclusion
This study examines the potential effects of population size, energy consumption, economic development, and forest areas on CO2 emissions in Bangladesh. Time series data over the period 1990 to 2022 obtained from the World Development Indicator (WDI) have been used to examine the dynamic impacts of the variables. The study uses kilotons (kt) to measure CO2 emissions, GDP (constant local currency unit) to measure economic growth, population growth per year, the percentage of energy usage that comes from renewable energy, and square kilometers (sq. km) to measure forested area. In this research, the integration order of the dataset was established using the Zivot and Andrews (Z&A) unit root test. There was also long-term cointegration evidenced by the ARDL bound test. Moreover, the DOLS model was used to analyze the consequences of environmental factors over time. The empirical findings indicate that an increase in economic activity within Bangladesh contributes to a rise in CO2 emissions, thereby intensifying environmental degradation within the nation. The findings reveal that Bangladesh's CO2 emissions are projected to rise by 0.58% for each 1% increase in GDP. There is a 1.58% increase in CO2 emissions for every 1% increase in energy use from fossil fuels. This is to be expected, as fossil fuels are the primary source for the transportation sector, which is increasing gradually, and a significant part (21%) of electricity generation. Moreover, a 1% increase in forest area cover results in an 8.65% decrease in emissions. Additionally, the intercept (70.29943) indicates that the expected value of the CO2 is 70.30 units when all explanatory factors are set to zero. This suggests that this emission may occur due to additional causes, such as land use changes, CO2 emissions from waste, or others that were not considered in this study. Based on the FMOLS and CCR models, the expected results are reliable. Furthermore, while population size has not demonstrated a significant direct association, it is indirectly related to CO2 emissions as per our paired Granger causality analysis. In conclusion, by lowering Bangladesh's CO2 emissions, forest area helps to improve the quality of the environment. Our research suggests that limiting carbon emissions by using less energy from fossil fuels and increasing or at least sustainably managing forest cover could help to mitigate the effects of climate change. To reduce environmental degradation and achieve sustainable development in Bangladesh, this article offers guidance for significant regulatory policy frameworks.
6.2. Policy Implications
The study's empirical results have several significant policy ramifications for Bangladesh's plan for sustainable development and climate mitigation. First, the importance of quickening the nation's energy transition is highlighted by the considerable positive elasticity of CO2 emissions with respect to fossil fuel energy use. Targeted incentives for renewable energy investment, grid modernization, and energy efficiency improvements should be prioritized to reduce dependency on coal, oil, and natural gas, especially in the industrial and power production sectors.
Second, the findings show that expanding and conserving forests is a very efficient and reasonably priced mitigation strategy. Policies that avoid deforestation, encourage afforestation, and restore degraded forest land can result in significant emissions reductions because of the huge negative elasticity associated with forest acreage. Therefore, it is crucial to improve institutional coordination between local governments, environmental authorities, and community-based forest management programs.
Third, the necessity to separate growth from carbon intensity is highlighted by the positive correlation between emissions and economic growth. Encouraging greener manufacturing technology, establishing emissions guidelines for energy-intensive industries, and progressively incorporating market-based tools like carbon pricing or emissions trading mechanisms are some ways to do this. By taking these steps, Bangladesh will be able to maintain economic growth while reducing environmental deterioration.
Fourth, although population expansion has no statistically significant direct impact on emissions, its indirect effects through economic activity and energy demand indicate the importance of energy-efficient housing regulations, public transportation development, and urban design. Future emissions rise can be moderated by managing population pressures through better infrastructure and service delivery.
Finally, the findings encourage the creation of a comprehensive framework for climate policy that integrates economic planning, forest management, and energy transition. In addition to improving long-term environmental sustainability and economic resilience, such a coordinated approach will increase Bangladesh's capacity to fulfill its nationally defined responsibilities under the Paris Agreement.
7. Limitations and Future Research Opportunities
Even if the current study provides insightful empirical information on Bangladesh, it has certain limitations that could be addressed in future research. The efficacy of the econometric methodologies employed in our analysis is limited by the absence of data on the use of renewable energy sources. The present study used CO2 emissions total excluding LULUCF as a dependent variable, which is basically the total of CO2 emissions from Agriculture, Building (Energy), Fugitive Emissions (Energy), Industrial Combustion (Energy), Industrial Processes, Power Industry (Energy), Transport (Energy), and Waste. However, in the case of Bangladesh, no data were available on CO2 emissions from waste. Again, further research is needed to analyze each category separately and determine the significance of each category's relationship with economic development. Additionally, because it is an overpopulated country, Bangladesh has a declining amount of arable land. Changes in land use may influence environmental quality and the carbon intensity of GDP. According to the most recent World Trade Organization (WTO) data, Bangladesh is currently the world's second-largest exporter of ready-made garments (RMG) . So, there was an opportunity for further research on water pollution, as well as soil pollution. To improve Bangladesh’s overall environmental quality, more research could be done using other indicators of environmental emissions.
Author Contributions
Arifur Rahman: Conceptualization, Investigation, Resources, Methodology, Writing – original draft, Visualization, Project administration
Asadujjaman Razu: Data curation, Formal Analysis, Software
Mahbubar Rahman: Supervision, Writing – review & editing, Validation, Funding acquisition
Conflicts of Interest
The authors declare no conflicts of interest.
References
[1] H. Lee and J. Romero, “Climate Change 2023 Synthesis Report IPCC, 2023: Sections. In: Climate Change 2023: Synthesis Report. Contribution of Working Groups I, II and III to the Sixth Assessment Report of the Intergovernmental Panel on Climate Change [Core Writing Team],” pp. 35–115,
[2] S. Tauseef Hassan, P. Wang, I. Khan, and B. Zhu, “The impact of economic complexity, technology advancements, and nuclear energy consumption on the ecological footprint of the USA: Towards circular economy initiatives,” Gondwana Research, vol. 113, pp. 237–246, Jan. 2023,
[3] M. Isfat and A. Raihan, “Current practices, challenges, and future directions of climate change adaptation in Bangladesh,” Journal homepage:
[4] A. Raihan, R. A. Begum, M. N. M. Said, and J. J. Pereira, “Assessment of Carbon Stock in Forest Biomass and Emission Reduction Potential in Malaysia,” Forests 2021, Vol. 12, Page 1294, vol. 12, no. 10, p. 1294, Sep. 2021,
[5] A. Raihan and A. Tuspekova, “Role of economic growth, renewable energy, and technological innovation to achieve environmental sustainability in Kazakhstan,” Current Research in Environmental Sustainability, vol. 4, p. 100165, Jan. 2022,
[6] Bündnis Entwicklung Hilft and Institute for International Law of Peace and Armed Conflict, “World Risk Report 2024,” pp. 52–70, 2024.
[7] A. Raihan et al., “Nexus between economic growth, energy use, urbanization, agricultural productivity, and carbon dioxide emissions: New insights from Bangladesh,” Energy Nexus, vol. 8, Dec. 2022,
[8] M. M. Hasan and W. Chongbo, “Estimating energy-related CO2 emission growth in Bangladesh: The LMDI decomposition method approach,” Energy Strategy Reviews, vol. 32, Nov. 2020,
[9] “World Bank cuts Bangladesh growth forecast for FY26 | The Daily Star.” Accessed: Jul. 14, 2026. Available:
[10] “Annual Report 2025 | International Labour Organization.” Accessed: Feb. 14, 2026. Available:
[11] C. C. Lee, Z. W. He, and F. Xiao, “How does information and communication technology affect renewable energy technology innovation? International evidence,” Renew. Energy, vol. 200, pp. 546–557, Nov. 2022,
[12] K. Y. Oh and M. I. Bhuyan, “Trade openness and CO2 emissions: Evidence of Bangladesh,” Asian Journal of Atmospheric Environment, vol. 12, no. 1, pp. 30–36, Mar. 2018,
[13] A. Raihan, R. A. Begum, M. N. M. Said, and J. J. Pereira, “Relationship between economic growth, renewable energy use, technological innovation, and carbon emission toward achieving Malaysia’s Paris agreement,” Environ. Syst. Decis., vol. 42, no. 4, pp. 586–607, Dec. 2022,
[14] A. M. Khan, A. Basit, U. Khan, and M. K. Khan, “The Progressive Correlation Between Carbon Emission, Economic Growth, Energy Use, and Oil Consumption by the Most Prominent Contributors to Travel and Tourism GDPs,” Front. Environ. Sci., vol. 10, p. 945648, Jul. 2022,
[15] A. Raihan, D. A. Muhtasim, M. I. Pavel, O. Faruk, and M. Rahman, “Dynamic Impacts of Economic Growth, Renewable Energy Use, Urbanization, and Tourism on Carbon Dioxide Emissions in Argentina,” Environmental Processes, vol. 9, no. 2, Jun. 2022,
[16] K. C. Pradhan, B. Mishra, and S. M. Mohapatra, “Investigating the relationship between economic growth, energy consumption, and carbon dioxide (CO2) emissions: a comparative analysis of South Asian nations and G-7 countries,” Clean Technol. Environ. Policy, vol. 26, no. 10, pp. 3349–3367, Oct. 2024,
[17] M. M. Rahman and K. Alam, “Effects of corruption, technological innovation, globalisation, and renewable energy on carbon emissions in Asian countries,” Util. Policy, vol. 79, p. 101448, Dec. 2022,
[18] M. M. Rahman, K. Saidi, and M. Ben Mbarek, “Economic growth in South Asia: the role of CO2 emissions, population density and trade openness,” Heliyon, vol. 6, no. 5, May 2020,
[19] T. S. Adebayo and H. Rjoub, “A new perspective into the impact of renewable and nonrenewable energy consumption on environmental degradation in Argentina: a time–frequency analysis,” Environmental Science and Pollution Research, vol. 29, no. 11, pp. 16028–16044, Mar. 2022,
[20] A. Raihan and L. C. Voumik, “Carbon Emission Dynamics in India Due to Financial Development, Renewable Energy Utilization, Technological Innovation, Economic Growth, and Urbanization,” Journal of Environmental Science and Economics, vol. 1, no. 4, pp. 36–50, Dec. 2022,
[21] M. Sadiq et al., “The role of environmental social and governance in achieving sustainable development goals: evidence from ASEAN countries,” ASEAN countries, Economic Research-Ekonomska Istraživanja, vol. 36, no. 1, pp. 170–190, 2022,
[22] Z. Fareed, S. Salem, T. S. Adebayo, U. K. Pata, and F. Shahzad, “Role of Export Diversification and Renewable Energy on the Load Capacity Factor in Indonesia: A Fourier Quantile Causality Approach,” Front. Environ. Sci., vol. 9, Oct. 2021,
[23] B. Aslam et al., “Applying environmental Kuznets curve framework to assess the nexus of industry, globalization, and CO2 emission,” Environ. Technol. Innov., vol. 21, Feb. 2021,
[24] M. Rahman, “Do population density, economic growth, energy use and exports adversely affect environmental quality in Asian populous countries?,” Renewable & Sustainable Energy Reviews, vol. 77, pp. 506–514, 2017,
[25] M. A. Kashem and M. M. Rahman, “CO2 Emissions and Development Indicators: a Causality Analysis for Bangladesh,” Environmental Processes 2019 6: 2, vol. 6, no. 2, pp. 433–455, May 2019,
[26] A. A. Ayobamiji and D. B. Kalmaz, “Reinvestigating the determinants of environmental degradation in Nigeria,” International Journal of Economic Policy in Emerging Economies, vol. 13, no. 1, p. 52, 2020,
[27] I. D. Raheem and J. O. Ogebe, “CO2 emissions, urbanization and industrialization: Evidence from a direct and indirect heterogeneous panel analysis,” Management of Environmental Quality: An International Journal, vol. 28, no. 6, pp. 851–867, 2017,
[28] A. T. Vo, D. H. Vo, and Q. T. T. Le, “CO2 Emissions, Energy Consumption, and Economic Growth: New Evidence in the ASEAN Countries,” Journal of Risk and Financial Management, vol. 12, no. 3, Sep. 2019,
[29] L. Wang, X. V. Vo, M. Shahbaz, and A. Ak, “Globalization and carbon emissions: Is there any role of agriculture value-added, financial development, and natural resource rent in the aftermath of COP21?,” J. Environ. Manage., vol. 268, Aug. 2020,
[30] T. S. Adebayo, “Revisiting the EKC hypothesis in an emerging market: an application of ARDL-based bounds and wavelet coherence approaches,” SN Appl. Sci., vol. 2, no. 12, Dec. 2020,
[31] R. A. Begum, K. Sohag, S. M. S. Abdullah, and M. Jaafar, “CO2 emissions, energy consumption, economic and population growth in Malaysia,” Renewable and Sustainable Energy Reviews, vol. 41, pp. 594–601, 2015,
[32] Newell Pro, “Renewable energy and climate change. How do our choices affect the planet?” Accessed: Jul. 23, 2025. Available:
[33] “Analysis: Clean energy just put China’s CO2 emissions into reverse for first time - Carbon Brief.” Accessed: Jul. 15, 2026. Available:
[34] IEA, “CO2 Emissions – Global Energy Review 2025 – Analysis. International Energy Agency.”
[35] H. Altın, “The impact of energy efficiency and renewable energy consumption on carbon emissions in G7 countries,” International Journal of Sustainable Engineering, vol. 17, no. 1, pp. 1–9, Dec. 2024,
[36] N. C. Leitão, D. Balsalobre-Lorente, and J. M. Cantos-Cantos, “The impact of renewable energy and economic complexity on carbon emissions in BRICS countries under the EKC scheme,” NC Leitão, D Balsalobre-Lorente, JM Cantos-CantosEnergies, 2021, vol. 14, no. 16, Aug. 2021,
[37] B. Sebri, O. Salha, M. Sebri, and O. Ben Salha, “On the causal dynamics between economic growth, renewable energy consumption, CO2 emissions and trade openness: Fresh evidence from BRICS countries,” ElsevierM Sebri, O Ben-SalhaRenewable and Sustainable Energy Reviews, 2014•Elsevier, vol. 39, pp. 14–23, 2014,
[38] C. S. R. Neigh et al., “Russian forests show strong potential for young forest growth,” Commun. Earth Environ., vol. 6, no. 1, Dec. 2025,
[39] M. B. Melesse, A. N. Tirra, S. Homann-Kee Tui, A. F. Van Rooyen, and M. Hauser, “Production decisions and food security outcomes of smallholder’s livestock market participation: empirical evidence from Zimbabwe,” Front. Sustain. Food Syst., vol. 7, 2023,
[40] “IPCC Assessment Report 2024: Climate, Impacts & Solutions.” Accessed: Jul. 15, 2026. Available:
[41] U. Eze and C. C. Ugwuoke, “Analysis of population growth, carbon emission, and renewable energy nexus in nigeria,” Journal of economics and allied research, vol. 9, no. 3, pp. 112–125, 2024, Accessed: Jul. 23, 2025. Available:
[42] M. H. Pesaran, Y. Shin, and R. J. Smith, “Bounds testing approaches to the analysis of level relationships,” Journal of Applied Econometrics, vol. 16, no. 3, pp. 289–326, May 2001,
[43] S. H. Mondal and S. Mondal, “The implications of population growth and climate change on sustainable development in Bangladesh,” Jàmbá: Journal of Disaster Risk Studies, vol. 11, no. 1, p. 10, Jan. 2019,
[44] Y. M. Upadhyaya, K. R. Kharel, O. Poudel, and P. Nepal, “Carbon dioxide emissions, forest area, and economic growth of SAARC countries: Evidence from FMOLS approach,” Environmental Economics, vol. 16, no. 1, pp. 13–25, 2025,
[45] D. A. Dickey and W. A. Fuller, “Distribution of the Estimators for Autoregressive Time Series With a Unit Root,” J. Am. Stat. Assoc., vol. 74, no. 366, pp. 427–431, 1979,
[46] G. Elliott, T. J. Rothenberg, and J. H. Stock, “Efficient Tests for an Autoregressive Unit Root,” Dec. 1992,
[47] P. C. B. Phillips and P. Perron, “Testing for a unit root in time series regression,” Biometrika, vol. 75, no. 2, pp. 335–346, Jun. 1988,
[48] M. H. Pesaran and A. Timmermann, “Small sample properties of forecasts from autoregressive models under structural breaks,” J. Econom., vol. 129, no. 1–2, pp. 183–217, Nov. 2005,
[49] C. W. J. Granger, “Investigating Causal Relations by Econometric Models and Cross-spectral Methods,” Econometrica, vol. 37, no. 3, p. 424, Aug. 1969,
[50] C. M. Jarque and A. K. Bera, “Efficient Tests for Normality, Homoscedasticity and Serial Independence of Regression Residuals,” 1980.
[51] M. A. Zambrano-Monserrate, C. A. Silva-Zambrano, J. L. Davalos-Penafiel, A. Zambrano-Monserrate, and M. A. Ruano, “Testing environmental Kuznets curve hypothesis in Peru: The role of renewable electricity, petroleum and dry natural gas,” Renewable and Sustainable Energy Reviews, vol. 82, pp. 4170–4178, Feb. 2018,
[52] D. H. Vo, A. T. Vo, C. M. Ho, and H. M. Nguyen, “The role of renewable energy, alternative and nuclear energy in mitigating carbon emissions in the CPTPP countries,” Renew. Energy, vol. 161, pp. 278–292, Dec. 2020,
[53] M. M. Islam, M. A. M. Chowdhury, R. A. Begum, and A. A. Amir, “A bibliometric analysis on the research trends of climate change effects on economic vulnerability,” Environmental Science and Pollution Research, vol. 29, no. 39, pp. 59300–59315, Aug. 2022,
[54] M. Taheruzzaman and P. Janik, “Electric Energy Access in Bangladesh,” Transactions on Environment and Electrical Engineering, vol. 1, no. 2, Apr. 2016,
[55] T. S. Adebayo and G. D. Akinsola, “Investigating the causal linkage among economic growth, energy consumption and co2 emissions in Thailand: An application of the wavelet coherence approach,” International Journal of Renewable Energy Development, vol. 10, no. 1, pp. 17–26, Feb. 2021,
[56] R. Waheed, D. Chang, S. Sarwar, and W. Chen, “Forest, agriculture, renewable energy, and CO2 emission,” J. Clean. Prod., vol. 172, pp. 4231–4238, Jan. 2018,
[57] X. Liu and J. Bae, “Urbanization and industrialization impact of CO2 emissions in China,” J. Clean. Prod., vol. 172, pp. 178–186, Jan. 2018,
[58] M. Sehrawat, “Modelling the nexus between human capital, income inequality, and energy demand in India: new evidences from asymmetric and non-linear analysis,” Environmental Science and Pollution Research 2020 28: 3, vol. 28, no. 3, pp. 3632–3643, Sep. 2020,
[59] J. A. Odugbesan and H. Rjoub, “Relationship Among Economic Growth, Energy Consumption, CO2 Emission, and Urbanization: Evidence From MINT Countries,” Sage Open, vol. 10, no. 2, Apr. 2020,
[60] H. Guo, J. Jiang, Y. Li, X. Long, and J. Han, “An aging giant at the center of global warming: Population dynamics and its effect on CO2 emissions in China,” J. Environ. Manage., vol. 327, Feb. 2023,
[61] I. Hussain and A. Rehman, “Exploring the dynamic interaction of CO2 emission on population growth, foreign investment, and renewable energy by employing ARDL bounds testing approach,” Environmental Science and Pollution Research, vol. 28, no. 29, pp. 39387–39397, Aug. 2021,
[62] K. Regmi and A. Rehman, “Do carbon emissions impact Nepal’s population growth, energy utilization, and economic progress? Evidence from long- and short-run analyses,” Environmental Science and Pollution Research, vol. 28, no. 39, pp. 55465–55475, Oct. 2021,
[63] R. Parajuli, O. Joshi, and T. Maraseni, “Incorporating Forests, Agriculture, and Energy Consumption in the Framework of the Environmental Kuznets Curve: A Dynamic Panel Data Approach,” Sustainability 2019, Vol. 11, Page 2688, vol. 11, no. 9, p. 2688, May 2019,
[64] WTO, “World trade statistical review 2023,” 2023. Accessed: May 20, 2025. Available:
Cite This Article
  • APA Style

    Rahman, A., Razu, A., Rahman, M. (2026). Modelling Carbon Emissions and Associated Factors Towards Environmental Sustainability in Bangladesh. American Journal of Environmental and Resource Economics, 11(3), 60-75. https://doi.org/10.11648/j.ajere.20261103.12

    Copy | Download

    ACS Style

    Rahman, A.; Razu, A.; Rahman, M. Modelling Carbon Emissions and Associated Factors Towards Environmental Sustainability in Bangladesh. Am. J. Environ. Resour. Econ. 2026, 11(3), 60-75. doi: 10.11648/j.ajere.20261103.12

    Copy | Download

    AMA Style

    Rahman A, Razu A, Rahman M. Modelling Carbon Emissions and Associated Factors Towards Environmental Sustainability in Bangladesh. Am J Environ Resour Econ. 2026;11(3):60-75. doi: 10.11648/j.ajere.20261103.12

    Copy | Download

  • @article{10.11648/j.ajere.20261103.12,
      author = {Arifur Rahman and Asadujjaman Razu and Mahbubar Rahman},
      title = {Modelling Carbon Emissions and Associated Factors Towards Environmental Sustainability in Bangladesh},
      journal = {American Journal of Environmental and Resource Economics},
      volume = {11},
      number = {3},
      pages = {60-75},
      doi = {10.11648/j.ajere.20261103.12},
      url = {https://doi.org/10.11648/j.ajere.20261103.12},
      eprint = {https://article.sciencepublishinggroup.com/pdf/10.11648.j.ajere.20261103.12},
      abstract = {Understanding the underlying drivers of carbon emissions is critical for designing effective climate mitigation policies in highly vulnerable emerging economies. This study investigates the long-run and dynamic impacts of economic growth, fossil fuel energy consumption, population dynamics, and forest area on carbon dioxide (CO2) emissions in Bangladesh from 1990 to 2022. Utilizing advanced time-series econometric techniques—including Autoregressive Distributed Lag (ARDL) bounds testing, Dynamic Ordinary Least Squares (DOLS), Fully Modified Ordinary Least Squares (FMOLS), Canonical Cointegration Regression (CCR), and pairwise Granger causality tests—the analysis confirms a stable long-run cointegrating relationship among the variables. The empirical findings reveal that economic expansion and fossil fuel energy consumption significantly increase CO2 emissions, yielding long-run elasticities of 0.58 and 1.58, respectively. Conversely, forest area exerts a substantial moderating effect; a 1% increase in forest cover reduces carbon emissions by approximately 8.65%, underscoring the critical role of forest ecosystems as vital carbon sinks. While population growth exhibits a statistically significant direct impact in the long-run model, it influences emissions indirectly by driving energy demand and economic activity. These results highlight the urgency of an integrated policy framework that simultaneously promotes sustainable growth paths, accelerates the clean energy transition, and strengthens forest conservation strategies.},
     year = {2026}
    }
    

    Copy | Download

  • TY  - JOUR
    T1  - Modelling Carbon Emissions and Associated Factors Towards Environmental Sustainability in Bangladesh
    AU  - Arifur Rahman
    AU  - Asadujjaman Razu
    AU  - Mahbubar Rahman
    Y1  - 2026/08/18
    PY  - 2026
    N1  - https://doi.org/10.11648/j.ajere.20261103.12
    DO  - 10.11648/j.ajere.20261103.12
    T2  - American Journal of Environmental and Resource Economics
    JF  - American Journal of Environmental and Resource Economics
    JO  - American Journal of Environmental and Resource Economics
    SP  - 60
    EP  - 75
    PB  - Science Publishing Group
    SN  - 2578-787X
    UR  - https://doi.org/10.11648/j.ajere.20261103.12
    AB  - Understanding the underlying drivers of carbon emissions is critical for designing effective climate mitigation policies in highly vulnerable emerging economies. This study investigates the long-run and dynamic impacts of economic growth, fossil fuel energy consumption, population dynamics, and forest area on carbon dioxide (CO2) emissions in Bangladesh from 1990 to 2022. Utilizing advanced time-series econometric techniques—including Autoregressive Distributed Lag (ARDL) bounds testing, Dynamic Ordinary Least Squares (DOLS), Fully Modified Ordinary Least Squares (FMOLS), Canonical Cointegration Regression (CCR), and pairwise Granger causality tests—the analysis confirms a stable long-run cointegrating relationship among the variables. The empirical findings reveal that economic expansion and fossil fuel energy consumption significantly increase CO2 emissions, yielding long-run elasticities of 0.58 and 1.58, respectively. Conversely, forest area exerts a substantial moderating effect; a 1% increase in forest cover reduces carbon emissions by approximately 8.65%, underscoring the critical role of forest ecosystems as vital carbon sinks. While population growth exhibits a statistically significant direct impact in the long-run model, it influences emissions indirectly by driving energy demand and economic activity. These results highlight the urgency of an integrated policy framework that simultaneously promotes sustainable growth paths, accelerates the clean energy transition, and strengthens forest conservation strategies.
    VL  - 11
    IS  - 3
    ER  - 

    Copy | Download

Author Information
  • Institute of Bangladesh Studies (IBS), University of Rajshahi, Rajshahi, Bangladesh

  • Institute of Bangladesh Studies (IBS), University of Rajshahi, Rajshahi, Bangladesh

  • Department of Economics, University of Rajshahi, Rajshahi, Bangladesh

  • Abstract
  • Keywords
  • Document Sections

    1. 1. Introduction
    2. 2. Literature Review
    3. 3. Data and Methodology
    4. 4. Results of the Study
    5. 5. Discussion
    6. 6. Conclusion and Policy Directions
    7. 7. Limitations and Future Research Opportunities
    Show Full Outline
  • Author Contributions
  • Conflicts of Interest
  • References
  • Cite This Article
  • Author Information