Research Article | | Peer-Reviewed

Design and Experimental Evaluation of an IOT-Enabled Multi-Parameter Water Quality Monitoring System

Received: 24 July 2026     Accepted: 10 August 2026     Published: 11 November 2026
Views:       Downloads:
Abstract

In recent times access to safe drinking water remains a critical health priority at the global scale with several illness being linked primarily to the source of water we consume. Unlike conventional approaches of evaluating the quality of water which often involves collecting sample and taking it to laboratories. The emergence of Internet of Things (IOT) now makes it possible for a low-cost, real-time and on-site water quality test. This paper presents the design and experimental evaluation of a multi-parameter water quality monitoring system built utilizing the ESP32 microcontroller. The system integrates four primary sensors; a temperature sensor probe, pH sensor, Total Dissolved Solids (TDS)/electrical conductivity sensor and a turbidity sensor to evaluate water quality in real-time. Sensor readings are then displayed on a 0.96-inch OLED display and streamed over Wi-Fi to an Arduino Cloud dashboard where various widgets provide real-time visualization of data. An on-board classification algorithm compares each reading against the World Health Organization (WHO) and Nigerian Standard for Drinking Water Quality (NSDWQ) acceptable parameter readings and reports a SAFE/UNSAFE verdict. The system was evaluated using two water sources: commercially packed water (Sachet water) and untreated borehole water which most people living in this part of the world primarily consume daily. Results showed a slight variation in the pH and TDS of water across different water packaging company while they both still consistently maintain the NSDWQ threshold for all four parameters, while the borehole water exhibited significantly higher TDS and turbidity values which might be due to soil content, with pH occasionally falling below the recommended range. Correlation analysis between the temperature and the borehole readings were found to be a weak to moderate strength indicating the need for a multi-parameter setup as one parameter is not sufficient enough to make timely and informed decisions regarding safe drinking water.

Published in American Journal of Embedded Systems and Applications (Volume 12, Issue 1)
DOI 10.11648/j.ajesa.20261201.11
Page(s) 1-11
Creative Commons

This is an Open Access article, distributed under the terms of the Creative Commons Attribution 4.0 International License (http://creativecommons.org/licenses/by/4.0/), which permits unrestricted use, distribution and reproduction in any medium or format, provided the original work is properly cited.

Copyright

Copyright © The Author(s), 2026. Published by Science Publishing Group

Keywords

Water Quality Monitoring System, Multi-parameter System, Cloud, Arduino, Internet of Things, Microcontroller

1. Introduction
Safe drinking water is essential for life, safety, survival and health. Yet, the World Health Organization has linked the death of over 485,000 confirmed diarrheal affected patients to consumption of contaminated water with over 2 billion people globally who lack access to safe drinking water. In many developing countries, the common households primarily rely on two dominant sources of water for survival: commercially packaged sachet water and untreated boreholes supply. (Lal, Menon, Noble, & Arif, 2024). While sachet water might seem safe, quality can vary by producer. Borehole water though might seem cheap and affordable is frequently compromised by organic contaminants, surface infiltration and inadequate treatment .
In conventional practice, water quality assessment often relied on collecting water samples and taking it to the laboratory to run analysis with the aim of ascertaining if its safe for drinking, this has proven to be a time-consuming, resource-intensive and not viable enough for real-time continuous monitoring . In modern times, the emergence of Internet of Things (IOT) has revolutionized water quality monitoring process by enabling autonomous, real-time processing and transmission through interconnected networks via various cloud platform such as e.g. Blynk, Thingspeak and Arduino etc. .
Water quality is commonly characterized using various parameters such as temperature, turbidity, pH and Total Dissolved Salts/Electrical Conductivity (TDS/EC). pH measures the acidity or alkalinity of water. Temperature influences water palatability, chemical reaction rates and the rate of bacterial growth, TDS represents the total concentration of dissolved substances in water including minerals, salts and metals. Turbidity measures the haziness of water caused by suspended particles such as dust and organic matter etc. .
Freshwater scarcity and water contamination represent a pressing global challenge. Pollution from agricultural runoff, industrial waste, and urban development can severely impact water quality. Agricultural runoff adds fertilizers, pesticides and nitrates which have a strong relationship with TDS which is a key parameter for measuring water quality and can lead to nutrient pollution, Residuals from these pollutants can go deep into groundwater or swept over to the surface as a result of rainfall, escalating the problem. Also the scarcity of fresh water remains a pressing global issue with only 6% of the world’s water classified as fresh and 85% of this already utilized by agriculture .
The growing decline in freshwater and death toll associated to contaminated water underscore the need for a real-time monitoring system to ensure the sustainable availability and safety of water for all. To address these challenges this paper, depict an IOT-enabled multi-parameter water quality monitoring system with the following key objectives;
1) To design and develop an ESP32-based water quality monitoring system integrating temperature, pH, TDS/EC, and turbidity sensors.
2) To develop an on-board decision algorithm that classifies water samples as safe or unsafe by comparing sensor readings against WHO and NSDWQ drinking-water standards.
3) To visualize real-time water quality data locally (OLED display) and remotely (Arduino Cloud dashboard).
4) To evaluate the system using two dominant sources of water: packaged sachet water and borehole water, and to compare the results against WHO/NSDWQ water quality standards.
The remainder of this report is organized as follows. Section 2 briefly reviews related water quality monitoring approaches. Section 3 describes the materials and methods used to carry out the research, algorithms used. Section 4 presents the experimental result and discussions obtained from the sachet water and borehole water tests. Lastly, Section 5 concludes the report.
2. Related Work
2.1. IoT-based Water Quality Monitoring
In His work developed an IoT system integrating an Arduino UNO microcontroller and sensors (pH, temperature, turbidity, conductivity, and TDS) to provide real-time notifications to residents about water conditions . While effective, the system relied on an external ESP8266 module for Wi-Fi connectivity and noted that it lacked microbiological testing capabilities. Our proposed system improves upon this design by utilizing the more modern ESP32 board, which integrates powerful processing and Wi-Fi/Bluetooth capabilities onto a single chip, reducing the hardware footprint and complexity while still maintaining the four critical parameters (temperature, TDS, turbidity, and pH) necessary for determining water quality.
2.2. Integrating Water Quality Model and Aeration with IoT Technology
Mahdzira in his work proposed a conceptual framework to combat eutrophication by integrating live IoT monitoring, aeration control, and mathematical water quality models. The framework focuses on large-scale ecosystems like lakes and reservoirs, utilizing NodeMCU (ESP8266) to monitor pH and control aerators. This research addresses the limitations of this conceptual framework by moving beyond a theoretical model to a specific hardware implementation tailored for drinking water safety, including turbidity and TDS sensors which are essential for domestic use but often omitted in large-scale aeration/eutrophication studies
2.3. IoT Water Quality Monitoring and Control System in Moving Bed Biofilm Reactor
In their study focused on a specialized laboratory-scale recirculating aquaculture system (RAS) using an Arduino Mega 2560 to monitor DO, pH, temperature, and TDS to optimize biofilm growth and ammonia removal . The authors noted that the system is complex and requires specialized training and devices. The proposed system solves these deficiencies by simplifying the hardware architecture through the ESP32, which is more efficient for data acquisition than the Mega/ESP8266 combo, and by including a turbidity sensor, which is vital for general water safety but was absent in this aquaculture-focused setup.
Table 1. Summary of related works.

Author(s)

Topic

Devices and Sensors used

Strengths

Weaknesses

Sung, Fadillah, & Hsiao (2021)

IoT-based monitoring for residential suitability.

Arduino UNO, ESP8266; Turbidity, Temp, pH, Conductivity, TDS.

Provides real-time notifications to residents and utilizes cloud data storage.

Reliance on multiple hardware modules (external Wi-Fi); lacks advanced monitoring for domestic storage tanks

Mahdzira et al. (2025)

Conceptual framework for eutrophication management.

NodeMCU (ESP8266); pH, Temp, and Dissolved Oxygen (DO).

Integrates live monitoring with mathematical modeling to control aeration.

Primarily a conceptual framework focused on large-scale ecosystems and aquatic life survival

Suriasni et al. (2024)

Monitoring and control in Biofilm Reactors (MBBR).

Arduino Mega 2560, ESP8266; DO, pH, Temp, and TDS.

Successfully optimizes biofilm performance and ammonia removal efficiency.

Complex architecture requiring advanced devices and specialized training for operation; lacks turbidity

3. Materials and Methods
3.1. Materials
The study employed an experimental and IOT-based design to evaluate the performance and reliability of a Water quality monitoring system (WQMS) integrating all four sensors: pH sensor, Turbidity sensor, Temperature probe sensor and the TDS sensor. The system was built around an ESP32 microcontroller which is a low-cost but high-performance System-on-chip (SoC) board . The system was deployed in a real-world environment and monitored continuously to capture water temperature, conductivity, turbidity level and dissolved solids over time. The methodological framework aligns with the research objectives and ensures a reproducible, data-driven evaluation of the proposed system.
3.1.1. Detail of Cloud Storage
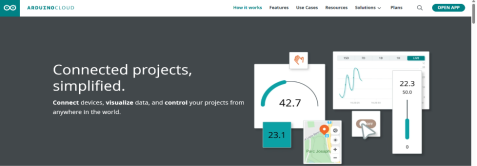
As shown in the Figure 1, Arduino IOT cloud is a cloud-based platform that allows users to collect, store and visualize sensor data from connected devices in real time. It offers native integration and compatibility with Arduino boards, ESP32 boards etc., provides dashboard widgets for live visualization of data making it well suited for remote water quality monitoring applications. This platform was selected because it enables real-time acquisition, storage, and visualization of sensor data directly from the ESP32 with minimal setup effort .
Figure 1. Detail of Arduino IOT Cloud.
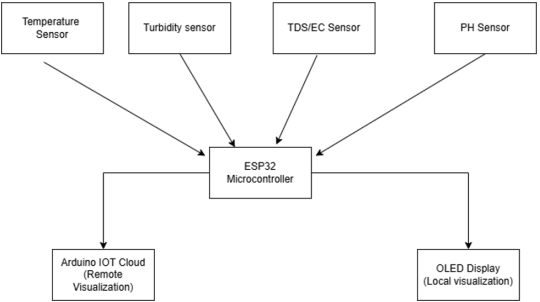
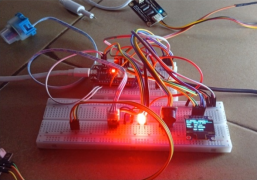
The data flow of this system as seen in Figure 2 begins with the temperature sensor, pH, TDS/EC, and turbidity sensors capturing water-quality parameters, which are processed by the microcontroller, including averaging and threshold-based classification. The processed values are transmitted over Wi-Fi to Arduino IoT Cloud, where they are stored and visualized on gauge widgets and also displayed on the 0.96-inch display for local visualization. End users can access the dashboard remotely and view the current SAFE/UNSAFE classification for informed water-quality decision-making.
Figure 2. System Block Diagram.
In addition, the cloud-based nature of the platform supports continuous monitoring of all four parameters, integrates directly with the ESP32's Wi-Fi connectivity without requiring an external cellular module, and provides a dashboard for at-a-glance status checks — making it a cost-effective and scalable solution well suited to continuous water-quality monitoring in diverse environments.
3.1.2. Temperature Sensor
Figure 3. DS18B20 Temperature sensor.
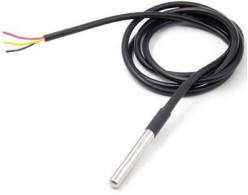
The DS18B20 Waterproof Temperature Sensor in Figure 3 is a versatile and durable temperature sensing device designed for use in harsh environments. Encased in a stainless-steel probe, this sensor is ideal for applications requiring reliable temperature measurement in liquids, gases, or other challenging conditions. It utilizes the 1-Wire digital communication protocol, making it easy to interface with microcontrollers and other digital systems
Key Features include; Waterproof design with a stainless-steel probe for durability, Accurate temperature measurement over a wide range, Utilizes 1-Wire digital communication protocol for easy interfacing, High resolution with programmable temperature resolution, Low power consumption for battery-operated application and Wide operating temperature range.
3.1.3. Total Dissolved Salts/Electrical Conductivity Sensor
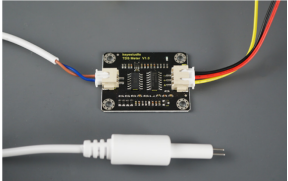
A TDS meter as seen in Figure 4 measures the number of total dissolved solids like salts, minerals, and metals in the water. As the number of dissolved solids in the water increases, the conductivity of the water increases, and that allow us to calculate the total dissolved solids in ppm (mg/L).
Figure 4. TDS/EC Sensor.
Key features include: Uses corrosion-resistant gold-coated stainless-steel EC sensor. Measurement range 0 - 100,000 mg/L. Resolution 2 auto ranging scales (0 - 9999 mg/L, 10.00 - 100.00 mg/L). Accuracy of 1% of reading. Requires no calibration. This is taken care of when you calibrate the EC sensor.
3.1.4. Turbidity Sensor
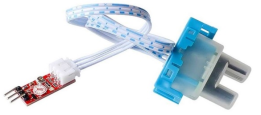
Turbidity sensor (TSD-10) as seen in Figure 5 measures the turbidity (amount of suspended particles) of a liquid. This optical sensor measures a turbid water density or an extraneous matter concentration using the refraction of wavelength between photo transistor and diode. Using an optical transistor and diodes, an optical sensor measures the amount of light coming from the light source to the light receiver to calculate water turbidity. The amount of light transmitted through the sample is dependent on the amount of soil in the water. As the soil level increases, the amount of transmitted light decreases .
Figure 5. Turbidity Sensor.
Along with temperature, dissolved oxygen (DO), pH, and conductivity, turbidity is one of the most commonly measured water quality parameters.
3.1.5. pH Sensor Module
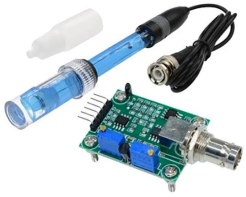
A pH sensor module as seen in Figure 6 is an electronic device that measures the acidity or alkalinity (0 to 14 pH) of a liquid. It consists of a glass probe connected to a signal conversion board—typically using a BNC connector—that amplifies the tiny voltage generated by hydrogen ions to a readable analog signal .
Figure 6. Liquid pH sensor probe.
The usual way for determining the quality or pH of water is to use pH indicators. Although they cannot offer exact pH readings, they can be used to determine if a chemical is acidic or basic. Litmus, phenolphthalein, and methyl orange are the three primary pH indicators frequently used in laboratories. To estimate pH, these indicators rely on visible color changes. However, it is now standard procedure to measure pH with a pH meter or sensor .
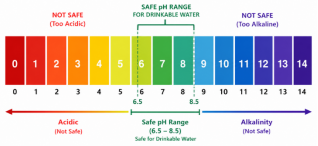
Inline with the World Health Organization (WHO) standard for acceptable pH value of 6.5 - 8.5 Figure 7 illustrates this as pH values of 6.5-8.5 were considered safe for drinking and pH value below or above this acceptable range were either termed as being too acidic or alkaline.
Figure 7. pH colour coding scale.
3.1.6. ESP32 Microcontroller
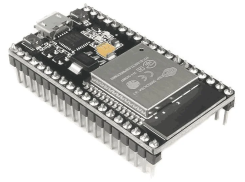
The ESP32 microcontroller in Figure 8 is a versatile, low-cost, robust, and low-power-based System On a Chip general-purpose microcontroller featuring a dual-core processor, set of peripherals, large memory capacity, and integrated Wi-Fi & Bluetooth connectivity. This device provides a wide range of features like; a large memory capacity, a dual-core processor & a rich set of peripherals. As compared to other types of microcontrollers, these devices offer different features, a superior power balance, and flexibility .
Figure 8. ESP32 Dev Module Microcontroller.
3.2. Methods
3.2.1. Water Quality Standards Used for Classification
Table 2 summarizes the drinking-water threshold values for pH, TDS, Turbidity and temperature used by the system's classification algorithm, drawn from both World Health Organization (WHO) and the Nigerian Standard for Drinking Water Quality (NSDWQ) guidelines .
Table 2. Summary of Water quality Standards.

Parameter

WHO Guideline

NSDWQ Guideline

Health Risk

pH

6.5 - 8.5

6.5 - 8.5

Palatability; corrosivity/scaling risk

TDS

≤ 500 mg/L (600-1000 mg/L acceptable upper range)

≤ 500 mg/L

Taste; indicator of dissolved contaminants

Turbidity

≤ 5 NTU (≤ 1 NTU ideal for disinfection efficacy)

≤ 5 NTU

Proxy for pathogens/sediment; disinfection efficiency

Temperature

No strict health-based limit; ambient/palatability guidance only

Ambient temperature range

Palatability; influences other parameter

The system classifies a water sample as SAFE only if all four parameters fall within their respective acceptable ranges; if any single parameter falls outside its threshold, the sample is classified as UNSAFE. This conservative, multi-parameter rule reduces the risk of a contaminated sample being reported as safe due to one favourable bias from one reading.
3.2.2. Algorithms
Algorithm I: Sensor Initialization
Input: Pin assignments for temperature, pH, TDS, and turbidity sensors; OLED I2C address; Wi-Fi/Arduino Cloud credentials.
Output: Initialized sensors, display, and cloud connection.
#include "thingProperties.h"
#include <Wire.h>
#include <Adafruit_GFX.h>
#include <Adafruit_SSD1306.h>
#include <OneWire.h>
#include <DallasTemperature.h>
#include "esp_task_wdt.h"
#define PIN_TURBIDITY 35
#define PIN_TDS 32
#define PIN_TEMP 4
#define PIN_LED_BLUE 26
#define PIN_LED_RED 27
#define PIN_BUZZER 25
//For the display
#define I2C_SDA 21
#define I2C_SCL 22
void setup() { Wire.begin();
display.begin(SSD1306_I2C_ADDRESS); oneWireTemp.begin(); pinMode(pH_SENSOR_PIN, INPUT); pinMode(TDS_SENSOR_PIN, INPUT);
pinMode(TURBIDITY_SENSOR_PIN, INPUT); ArduinoCloud.begin(ArduinoIoTPreferredConnection); setDebugMessageLevel(2); }
Explanation: The ardafruit libraies makes it possible for the I2C bus to be initialized for the OLED display, configures the one-wire bus for the temperature probe, Pin assignment for the pH, TDS, and turbidity sensors initializes all four sensors, and a things.properties file establishes the Arduino Cloud connection over Wi-Fi containing the Thing ID and also the Wifi SSID and password.
Algorithm II: Water Safety Classification
bool isSafe = (phValue >= pH_MIN && phValue <= pH_MAX) && (tdsValue <= TDS_MAX) && (turbidityNTU <= TURBIDITY_MAX) && (temperature >= TEMP_MIN && temperature <= TEMP_MAX); status = isSafe "SAFE": "UNSAFE";
Explanation: Each averaged reading is compared against the thresholds listed in Table 2. The sample is classified as SAFE only if all four conditions are simultaneously satisfied; otherwise, it is classified UNSAFE.
Algorithm III: Local Display and Cloud Data Transmission
display. clearDisplay(); display. printf("T:%.1fC pH:%.1f\nTDS:%.0f TURB:%.1f\nSTATUS:%s", temperature, phValue, tdsValue, turbidityNTU, status); display. display(); cloudTemperature = temperature; cloudpH = phValue; cloudTDS = tdsValue; cloudTurbidity = turbidityNTU; cloudStatus = status; ArduinoCloud. update();
Explanation: The processed readings and classification result are displayed on the OLED display for local alerts, offline readout, and simultaneously assigned to the Arduino Cloud variables, which the ArduinoCloud. update() call synchronizes with the cloud dashboard over Wi-Fi.
Figure 9. Results of the WQMS.
4. Evaluation Results and Discussion
The results, in Figure 9 above, represent the outcome of our IOT-Enabled multi-parameter water quality monitoring system, consisting of the four sensors used as said in the materials and methods section: the DS18B20 temperature sensor, the pH sensor, the TDS/EC sensor, and the turbidity sensor. The DS18B20 sensor is used to measure water temperature within recognized range as set out by regulator bodies like WHO and NSDWQ, while the pH, TDS/EC, and turbidity sensors are used to assess the water's acidity, dissolved solids content, and clarity, respectively. The OLED display serves as a visual dashboard to view the current readings and safety status of the system. The system, once active, continuously acquires and averages readings from all four sensors before applying the classifying as SAFE/UNSAFE. When all parameters fall within the WHO/NSDWQ thresholds, the system reports a SAFE status locally on the OLED and remotely on the Arduino Cloud dashboard. If any single parameter, or a combination of parameters, falls outside the acceptable range, the system reports an UNSAFE status and reflects this both locally and remotely, alerting the user to a potential water-quality concern.
Two water sources were considered to evaluate the performance of the system: (i) commercially packaged sachet water, representing treated drinking water, and (ii) untreated borehole water, representing a common domestic water source in the study area. Sensors were cleaned properly after subsequent test between sample changes to minimize cross-contamination, and the pH probe was calibrated using standard KCN buffer solutions.
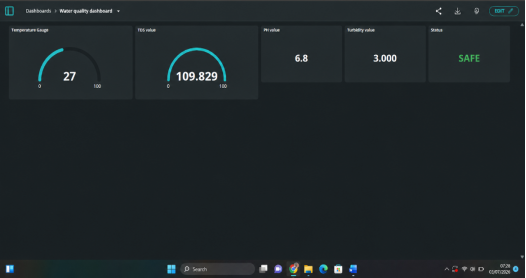
In Figure 10 below is the Arduino Cloud dashboard, which provides a remote monitoring interface for the water quality monitoring system, accessible from any internet-connected device. At the top of the dashboard, a status indicator shows the current SAFE/UNSAFE classification at a glance, giving the user an immediate summary of overall water safety without needing to interpret individual readings. Below this, four circular gauges, Temperature, pH, TDS, and Turbidity, display live readings on their respective scales, matching the values shown locally on the OLED, giving the user an immediate sense of how each parameter compares against its WHO/NSDWQ threshold. At the time of testing, the sachet water readings remained comfortably within the safe range.
Figure 10. Arduino Iot dashboard for the WQMS.
The Arduino Cloud dashboard reading for sachet water in Figure 10 recorded a temperature of 27°C, a pH reading of 6.8, a TDS value of 109.829 mg/L, and a turbidity of 3.000 NTU. All four parameters fall comfortably within the WHO/NAFDAC acceptable ranges: the pH sits within the 6.5-8.5 window, the TDS value is well below the 500 mg/L limit, and the turbidity reading is under the 5 NTU threshold. Consistent with this, the system's classification logic correctly reported an overall status of SAFE, confirming that sachet water meets recommended drinking-water standards.
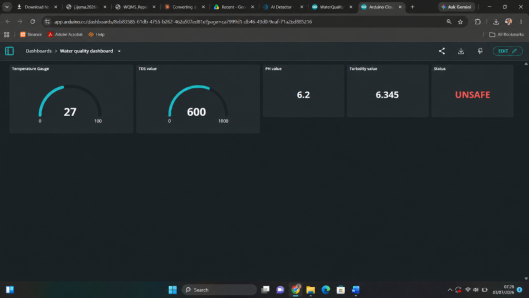
Figure 11. Dashboard analysis for Borehole water readings.
The borehole water reading in Figure 11 recorded similar temperature reading of 27°C, but a pH of 6.2, a markedly higher TDS value of 600 mg/L, and a turbidity of 6.345 NTU which surpasses the 5.0 NTU threshold set out by WHO/NSDWQ. Here, three of the four parameters breach recommended limits: the pH falls slightly below the 6.5 lower bound, the TDS value exceeds the 500 mg/L threshold by 100 mg/L, and the turbidity exceeds the 5 NTU limit. As a result, the system correctly reported the overall status as UNSAFE, reflecting the elevated dissolved-solids content and higher turbidity typical of untreated groundwater sources and further elevating the need for a multi-parameter sensor system.
Temperature Results
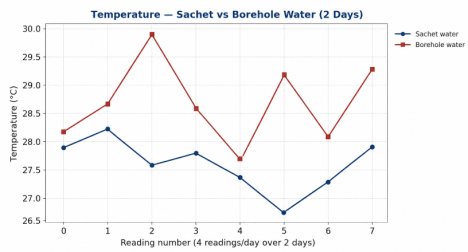
Figure 12. Temperature readings recorded from sachet water and borehole water over the Two-day monitoring period.
After analysis for a period of 2 days and four test per day both water sources as seen in Figure 12 showed relatively stable temperatures, mostly between 27°C and 30°C, consistent under a room condition of the study location. Temperature has no strict WHO/NSDWQ numerical health limit but is monitored because it can influence the solubility of gases and the biological/chemical behaviour of the other three parameters.
pH Results
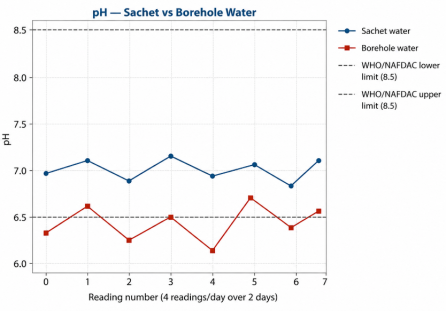
Figure 13. pH readings recorded from sachet water and borehole water, with the 6.5-8.5 WHO/NSDWQ limit shown.
Sachet water pH as seen in Figure 13 remained consistent within the 6.5-8.5 acceptable range throughout the monitoring period, the values mostly stayed stable under the 6.8-7.1 range but never once dropped below the “6.5” range. Borehole water pH was more variable and dropped below the 6.5 lower limit on several occasions, indicating a mildly acidic tendency that could reflect local soil or groundwater mineral characteristics which could be as a result of the agricultural runoff as discussed earlier .
TDS Results
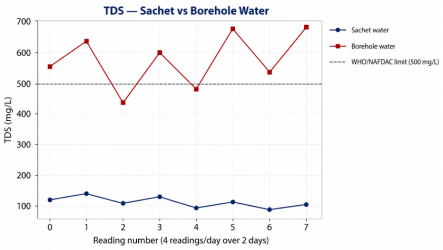
Sachet water TDS values as seen in Figure 14 below remained well below the 500 mg/L threshold throughout testing. Borehole water TDS values exceeded this threshold on almost every reading, indicating a substantially higher concentration of dissolved minerals and solids and reinforcing the need for treatment before this source is considered safe for direct consumption.
Figure 14. TDS readings recorded from sachet water and borehole water, with the 500 mg/L WHO/NSDWQ limit shown.

5. Conclusion
This report presents a well-documented design and experimental evaluation of an ESP32-based multi-parameter water quality monitoring system intended to be accessible and practical for a broad range of users, including households, small water vendors, and community water-point operators who may lack access to laboratory testing facilities. The system addresses a notable gap in already existing solutions used in conventional systems, namely reliance on a single water-quality parameter by offering an affordable design that integrates and combines all major parameter metrics for evaluating the quality of water while still delivering both local and remote water-safety information on the Arduino cloud and OLED display, this combined classification is reinforced by colour-coded status indicators on the Arduino cloud dashboard, SAFE shown in green and UNSAFE shown in red, both and status message also shown on the local OLED display, so that discrepancies between individual parameters and the overall verdict can be identified at a glance, and users are given clear, actionable information rather than raw numeric values alone.
For on-site users, it provides a 0.96-inch OLED display that shows live sensor readings and the current SAFE/UNSAFE classification, offering clear, at-a-glance confirmation of water status without requiring a smartphone or internet connection. For users who need to monitor conditions remotely, it incorporates an Arduino Cloud dashboard with gauge widgets, enabling continuous visualization of temperature, pH, TDS, and turbidity from any internet-connected device.
Abbreviations

ADC

Analog-to-Digital Converter

EC

Electrical Conductivity

IoT

Internet of Things

NSDWQ

Nigerian Standard for Drinking Water Quality

NTU

Nephelometric Turbidity Unit

OLED

Organic Light-Emitting Diode

TDS

Total Dissolved Solids

WHO

World Health Organization

WQMS

Water Quality Monitoring System

Author Contributions
Nnanna Ekedebe: Conceptualization, Methodology, Project administration, Resources, Supervision, Validation, Writing – original draft, Writing – review & editing
Ezeh Franklin Chidubem: Investigation, Software, Visualization
Ajere Ikenna Uzoma: Software, Validation
Reginald Ekene Ogu: Methodology, Validation
Gloria Ngozi Ezeh: Formal Analysis
Nwachukwu Victor Chisom: Resources, Software
Chukwukere Okpani: Validation
Mbamala Chinyere Vivian: Formal Analysis
Joe-Uzuegbu Chijioke Kenechukwu: Investigation, Methodology
Okonkwo Thaddeus Ogadinma: Formal Analysis, Validation
Obi Chukwuemeka Nwokonkwo: Supervision, Validation, Writing – review & editing
Conflicts of Interest
The authors declare no conflicts of interests.
References
[1] Arduino. (2022). Arduino IoT Cloud documentation. Retrieved from
[2] Chandra Asri. (2026). 3 water quality parameters: Chemical, biological, & physical. Retrieved from
[3] D'Souza, D. (2026). pH sensor working principle, types and applications. Robocraze. Retrieved from
[4] Espressif Systems. (2023). ESP32 technical reference manual (Version 5.1).
[5] Lal, K., Menon, S., Noble, F., & Arif, K. M. (2024). Low-cost IoT based system for lake water quality monitoring. PLoS One, 19(3), e0299089.
[6] Lakshmikantha, V., Hiriyannagowda, A., Manjunath, A., Patted, A., Basavaiah, J., & Anthony, A. A. (2021). IoT based smart water quality monitoring system. Global Transitions Proceedings, 2(2), 181-186.
[7] Mahdzira, M. M., Yahaya, S. H., Fauadia, M. H. F. M., & Yeow, T. T. (2025). Integrating water quality model and aeration with IoT technology in water quality management: A conceptual framework. Multidisciplinary Science Journal, 7, e2025139.
[8] Maxim Integrated. (2019). DS18B20 programmable resolution 1-Wire digital thermometer [Datasheet].
[9] National Agency for Food and Drug Administration and Control (NAFDAC) / Standards Organisation of Nigeria. (2015). Nigerian standard for drinking water quality (NSDWQ) (NIS 554: 2015)
[10] Perveen, S., & Amar-Ul-Haque. (2023). Drinking water quality monitoring, assessment and management in Pakistan: A review. Heliyon, 9(2), e13872.
[11] S. Pasika and S. T. Gandla, “Smart water quality monitoring system with cost-effective using IoT,” Heliyon, vol. 6, no. 7, Jul. 2020,
[12] Singh, S., Kumar, A., Prasad, A., & Bharadwaj, N. (2018). IoT based water quality monitoring system. International Journal on Recent & Innovative Trends in Technology.
[13] Sung, W. T., Fadillah, F. N., & Hsiao, S. J. (2021). IoT-based water quality monitoring. Sensors and Materials, 33(8), 2971-2983.
[14] Suriasni, P. A., Faizal, F., Hermawan, W., Subhan, U., Panatarani, C., & Joni, I. M. (2024). IoT water quality monitoring and control system in moving bed biofilm reactor to reduce total ammonia nitrogen. Sensors, 24(2), 494.
[15] World Health Organization. (2017). Guidelines for drinking-water quality (4th ed. incorporating the 1st addendum). WHO.
Cite This Article
  • APA Style

    Ekedebe, N., Chidubem, E. F., Uzoma, A. I., Ogu, R. E., Ezeh, G. N., et al. (2026). Design and Experimental Evaluation of an IOT-Enabled Multi-Parameter Water Quality Monitoring System. American Journal of Embedded Systems and Applications, 12(1), 1-11. https://doi.org/10.11648/j.ajesa.20261201.11

    Copy | Download

    ACS Style

    Ekedebe, N.; Chidubem, E. F.; Uzoma, A. I.; Ogu, R. E.; Ezeh, G. N., et al. Design and Experimental Evaluation of an IOT-Enabled Multi-Parameter Water Quality Monitoring System. Am. J. Embed. Syst. Appl. 2026, 12(1), 1-11. doi: 10.11648/j.ajesa.20261201.11

    Copy | Download

    AMA Style

    Ekedebe N, Chidubem EF, Uzoma AI, Ogu RE, Ezeh GN, et al. Design and Experimental Evaluation of an IOT-Enabled Multi-Parameter Water Quality Monitoring System. Am J Embed Syst Appl. 2026;12(1):1-11. doi: 10.11648/j.ajesa.20261201.11

    Copy | Download

  • @article{10.11648/j.ajesa.20261201.11,
      author = {Nnanna Ekedebe and Ezeh Franklin Chidubem and Ajere Ikenna Uzoma and Reginald Ekene Ogu and Gloria Ngozi Ezeh and Nwachukwu Victor Chisom and Chukwukere Okpani and Mbamala Chinyere Vivian and Joe-Uzuegbu Chijioke Kenechukwu and Okonkwo Thaddeus Ogadinma and Obi Chukwuemeka Nwokonkwo},
      title = {Design and Experimental Evaluation of an IOT-Enabled Multi-Parameter Water Quality Monitoring System},
      journal = {American Journal of Embedded Systems and Applications},
      volume = {12},
      number = {1},
      pages = {1-11},
      doi = {10.11648/j.ajesa.20261201.11},
      url = {https://doi.org/10.11648/j.ajesa.20261201.11},
      eprint = {https://article.sciencepublishinggroup.com/pdf/10.11648.j.ajesa.20261201.11},
      abstract = {In recent times access to safe drinking water remains a critical health priority at the global scale with several illness being linked primarily to the source of water we consume. Unlike conventional approaches of evaluating the quality of water which often involves collecting sample and taking it to laboratories. The emergence of Internet of Things (IOT) now makes it possible for a low-cost, real-time and on-site water quality test. This paper presents the design and experimental evaluation of a multi-parameter water quality monitoring system built utilizing the ESP32 microcontroller. The system integrates four primary sensors; a temperature sensor probe, pH sensor, Total Dissolved Solids (TDS)/electrical conductivity sensor and a turbidity sensor to evaluate water quality in real-time. Sensor readings are then displayed on a 0.96-inch OLED display and streamed over Wi-Fi to an Arduino Cloud dashboard where various widgets provide real-time visualization of data. An on-board classification algorithm compares each reading against the World Health Organization (WHO) and Nigerian Standard for Drinking Water Quality (NSDWQ) acceptable parameter readings and reports a SAFE/UNSAFE verdict. The system was evaluated using two water sources: commercially packed water (Sachet water) and untreated borehole water which most people living in this part of the world primarily consume daily. Results showed a slight variation in the pH and TDS of water across different water packaging company while they both still consistently maintain the NSDWQ threshold for all four parameters, while the borehole water exhibited significantly higher TDS and turbidity values which might be due to soil content, with pH occasionally falling below the recommended range. Correlation analysis between the temperature and the borehole readings were found to be a weak to moderate strength indicating the need for a multi-parameter setup as one parameter is not sufficient enough to make timely and informed decisions regarding safe drinking water.},
     year = {2026}
    }
    

    Copy | Download

  • TY  - JOUR
    T1  - Design and Experimental Evaluation of an IOT-Enabled Multi-Parameter Water Quality Monitoring System
    AU  - Nnanna Ekedebe
    AU  - Ezeh Franklin Chidubem
    AU  - Ajere Ikenna Uzoma
    AU  - Reginald Ekene Ogu
    AU  - Gloria Ngozi Ezeh
    AU  - Nwachukwu Victor Chisom
    AU  - Chukwukere Okpani
    AU  - Mbamala Chinyere Vivian
    AU  - Joe-Uzuegbu Chijioke Kenechukwu
    AU  - Okonkwo Thaddeus Ogadinma
    AU  - Obi Chukwuemeka Nwokonkwo
    Y1  - 2026/11/11
    PY  - 2026
    N1  - https://doi.org/10.11648/j.ajesa.20261201.11
    DO  - 10.11648/j.ajesa.20261201.11
    T2  - American Journal of Embedded Systems and Applications
    JF  - American Journal of Embedded Systems and Applications
    JO  - American Journal of Embedded Systems and Applications
    SP  - 1
    EP  - 11
    PB  - Science Publishing Group
    SN  - 2376-6085
    UR  - https://doi.org/10.11648/j.ajesa.20261201.11
    AB  - In recent times access to safe drinking water remains a critical health priority at the global scale with several illness being linked primarily to the source of water we consume. Unlike conventional approaches of evaluating the quality of water which often involves collecting sample and taking it to laboratories. The emergence of Internet of Things (IOT) now makes it possible for a low-cost, real-time and on-site water quality test. This paper presents the design and experimental evaluation of a multi-parameter water quality monitoring system built utilizing the ESP32 microcontroller. The system integrates four primary sensors; a temperature sensor probe, pH sensor, Total Dissolved Solids (TDS)/electrical conductivity sensor and a turbidity sensor to evaluate water quality in real-time. Sensor readings are then displayed on a 0.96-inch OLED display and streamed over Wi-Fi to an Arduino Cloud dashboard where various widgets provide real-time visualization of data. An on-board classification algorithm compares each reading against the World Health Organization (WHO) and Nigerian Standard for Drinking Water Quality (NSDWQ) acceptable parameter readings and reports a SAFE/UNSAFE verdict. The system was evaluated using two water sources: commercially packed water (Sachet water) and untreated borehole water which most people living in this part of the world primarily consume daily. Results showed a slight variation in the pH and TDS of water across different water packaging company while they both still consistently maintain the NSDWQ threshold for all four parameters, while the borehole water exhibited significantly higher TDS and turbidity values which might be due to soil content, with pH occasionally falling below the recommended range. Correlation analysis between the temperature and the borehole readings were found to be a weak to moderate strength indicating the need for a multi-parameter setup as one parameter is not sufficient enough to make timely and informed decisions regarding safe drinking water.
    VL  - 12
    IS  - 1
    ER  - 

    Copy | Download

Author Information