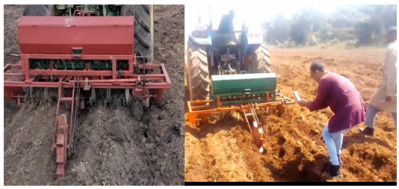
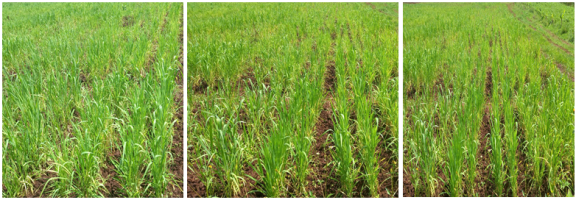
An integrated tractor-drawn wheat and fertilizer planter was fabricated in Jimma Agricultural Engineering Research Center workshop and evaluated at Omo Nadda district of Oromia region at a farmer’s field. The experiment was conducted to develop and evaluate the performance of a planter capable of sowing seeds and applying fertilizer at predetermined row spacing and depths. The developed planter consisted of a frame, seed hopper, seed metering devices, seed tube, and adjustable furrow opener. The performances were evaluated in terms of seed and fertilizer rate, row spacing, depth, field capacity, field efficiency, labor cost, and economics of owning and operating. Randomized complete block design with each of three levels speeds (3, 4, and 5 km/hr) hopper fill (H0.5, H0.75, and H1) was used. There were no mechanical seeds damaged by the planter at all speed and it indicated that there was no reduction in percent germination of the seeds when compared with the recommended germination percentage. The seed and fertilizer rate was calibrated at 125 kg/ha and 150 kg/ha respectively for 20 cm row spacing and 5 cm depth as per wheat agronomic requirement. The planter was evaluated at speeds of 3, 4, and 5 km/hr and hopper filling levels of H0.5, H0.75, and H1. Both forward speed and hopper filling had a significant effect on seed and fertilizer rate at p < 0.05. The mean effective field capacity, field efficiency, and fuel consumption were 0.45 ha/hr, 91.84%, and 2.95 l/hr at a speed of 3 km/hr. Based on the performance evaluation results, it is concluded that the developed planter can be efficiently, effectively, and economically used by the farmers.
| Published in | American Journal of Mechanical and Industrial Engineering (Volume 10, Issue 3) |
| DOI | 10.11648/j.ajmie.20251003.11 |
| Page(s) | 52-61 |
| Creative Commons |
This is an Open Access article, distributed under the terms of the Creative Commons Attribution 4.0 International License (http://creativecommons.org/licenses/by/4.0/), which permits unrestricted use, distribution and reproduction in any medium or format, provided the original work is properly cited. |
| Copyright |
Copyright © The Author(s), 2025. Published by Science Publishing Group |
Capacity, Efficiency, Fertilizer, Filling, Seed
S/N | Soil Type | Specific Resistance, kg/cm2 |
|---|---|---|
1. | Light | 0.12 |
2. | Medium | 0.15 |
3. | Heavy | 0.20 |
4. | Very heavy | 0.25 |
Weight of seed dropped per seed tube (gm) | ||||||||||
|---|---|---|---|---|---|---|---|---|---|---|
F1 | F2 | F3 | F4 | F5 | F6 | Total seed (gm) | Mean | SD | CV | Seed rate (kg/ha) |
54.86 | 54.74 | 55.48 | 55.30 | 55.60 | 55.26 | 331.24 | 55.21 | 0.34 | 0.62 | 125.57 |
55.53 | 55.65 | 56.29 | 55.54 | 54.46 | 54.48 | 331.95 | 55.33 | 0.34 | 0.62 | 125.86 |
55.37 | 54.92 | 55.54 | 55.28 | 55.36 | 54.62 | 331.09 | 55.18 | 0.34 | 0.62 | 125.52 |
55.81 | 55.38 | 55.74 | 55.37 | 55.95 | 55.57 | 333.82 | 55.64 | 0.24 | 0.43 | 126.57 |
55.47 | 55.50 | 56.39 | 55.73 | 55.42 | 55.66 | 334.17 | 55.70 | 0.36 | 0.64 | 126.71 |
Average | 332.45 | 55.41 | 0.32 | 0.59 | 126.05 | |||||
Weight of fertilizer dropped per seed tube (gm) | ||||||||||
|---|---|---|---|---|---|---|---|---|---|---|
F1 | F2 | F3 | F4 | F5 | F6 | Total seed (gm) | Mean | SD | CV | Seed rate (kg/ha) |
67.67 | 67.74 | 66.72 | 66.85 | 67.38 | 67.43 | 403.79 | 67.30 | 0.42 | 0.62 | 153.09 |
67.63 | 67.68 | 67.48 | 68.36 | 67.42 | 67.44 | 406.01 | 67.67 | 0.35 | 0.52 | 153.94 |
67.37 | 66.82 | 66.86 | 67.74 | 67.28 | 67.34 | 403.41 | 67.24 | 0.34 | 0.51 | 152.96 |
67.19 | 67.48 | 66.92 | 67.44 | 67.38 | 66.76 | 403.17 | 67.20 | 0.30 | 0.45 | 152.87 |
67.28 | 67.78 | 67.47 | 67.48 | 66.80 | 67.68 | 404.49 | 67.42 | 0.35 | 0.52 | 153.37 |
Average | 404.17 | 67.37 | 0.35 | 0.52 | 153.25 | |||||
Observations | Speed (km/hr) | Seed rate obtained (kg/ha) | Mechanical Damage (%) | Germination (%) |
|---|---|---|---|---|
1 | 3 | 126.80 | 0.00 | 97.00 |
2 | 4 | 123.86 | 0.00 | 95.00 |
3 | 5 | 121.74 | 0.00 | 95.00 |
Average | 124.13 | 0.00 | 95.67 |
Operating Speed (km/hr) | Seed rate (kg/ha) | Fertilizer rate (kg/ha) |
|---|---|---|
V3 | 126.35a | 152.75a |
V4 | 123.24b | 148.90b |
V5 | 120.52c | 146.93c |
Hopper filling | ||
H0.5 | 123.78a | 149.90a |
H0.75 | 121.23b | 148.70b |
H1 | 120.84c | 146.12c |
LSD (5%) | 0.16 | 0.17 |
CV (%) | 0.12 | 0.11 |
Operating speed (km/hr) | Hopper filling | Seed rate (kg/ha) | Fertilizer rate (kg/ha) |
|---|---|---|---|
V3 | H0.5 | 125.81a | 150.71a |
V3 | H0.75 | 125.47b | 150.30b |
V3 | H1 | 125.37bc | 149.96bc |
V4 | H0.5 | 122.58d | 146.79d |
V4 | H0.75 | 122.42de | 146.50de |
V4 | H1 | 122.29ef | 145.76f |
V5 | H0.5 | 119.88g | 144.74g |
V5 | H0.75 | 119.66gh | 144.50gh |
V5 | H1 | 118.86i | 144.20hi |
LSD (5%) | 0.22 | 0.31 | |
CV (%) | 0.10 | 0.10 |
Operating Speed, km/hr | Draft, N | Wheel slippage, % | Fuel Consumption, L/hr | TFC, ha/hr | EFC, ha/hr | FE,% |
|---|---|---|---|---|---|---|
3.00 | 243.20 | 2.37 | 2.95 | 0.49 | 0.45 | 91.84 |
4.00 | 277.86 | 4.18 | 3.83 | 0.66 | 0.57 | 86.36 |
5.00 | 298.00 | 5.47 | 4.65 | 0.82 | 0.65 | 79.27 |
ANOVA | Analysis of Variance |
BD | Bulk Density |
CV | Coefficient of Variance |
DB | Dry Basis |
EFC | Effective Field Capacity |
LSD | Least Significant Difference |
MC | Moisture Content |
OARI | Oromia Agricultural Research Institute |
RCBD | Randomized Complete Block Design |
SR | Seed Rate |
TFC | Theoretical Field Capacity |
| [1] | Al-Shamiry. (2020). Performance Evaluation Of Row Planter. International Journal Of Engineering Sciences And Research Technology, 1-20. |
| [2] | Asabe. (2003). Agricultural Machinery Management. American Society Of Agricultural And Biological Engineering, 1-12. |
| [3] | Behera. (1995). Comparison Of Two-Row Planting Machine Performance As Affected By Forward Speed Under Two Soil Conditions. Thesis University Of Khartoum, 1-13. |
| [4] | Cherinet. (2011). Investigation Into Technical And Economical Tractor And Implement Matching The Case Of Wonji Shoa Sugar Factory. Ethiopia: Thesis Submitted To Adama Science And Technology University. |
| [5] | Khurmi And Gupta. (2007). Theory Of Machines. Eurasia: Eurasia Publishing House Ltd. |
| [6] | Kumar And Mohan. (2017). Design And Development Of Groundnut Planter For Power Weeder. Agricultural Mechanization In Asia, Africa, And Latin America, 25-30. |
| [7] | Mehta. (2011). A Decision Support System For The Selection Of Tractor Implement System Used On Indian Farms. Journal Of Terramechanics, 48. |
| [8] | Okoko. (2018). Tillage, Seasonal, And Depth Effects On Soil Microbial Properties In The Black Soil Of Northeast China. International Journal Of Engineering Sciences, 16. |
| [9] | Rangapara. (2014). Performance Evaluation Of Manually Operated Single Row Cotton Planter. International Journal Of Engineering Sciences And Research Technology, 40-44. |
| [10] | Salokhe And Oida. (2003). Field Performance Evaluation Of Tractor Drawn Tillage Implement Used In Hilly Regions Of Arunachal Pradesh. Indian Journal Of Hill Farming, 87-94. |
| [11] | Sharma And Mukesh. (2010). Farm Machinery Design: Principal And Problems. International Journal Of Engineering Sciences And Research Technology, 1-15. |
| [12] | Singh. (2018). Field Performance Evaluation Of Tractor Drawn Tillage Implement Used In Hilly Regions Of Arunachal Pradesh. Indian Journal Of Hill Farming,, 87-94. |
| [13] | Tigist And Samuel. (2022). Review Of Wheat Value Chain In Ethiopia., (Pp. 1-10). Ethiopia. |
| [14] | Wamicwe Et Al. (2023). Development Of A Climate Smart Financing Bundle For Wheat In Ethiopia. |
| [15] | Parmar And Gupta. (2016). Theory Of Machines. Eurasia Publishing House Ltd. |
APA Style
Bona, H., Tibesso, A., Wirtu, R. (2025). Adaptation and Performance Evaluation of Tractor Drawn Raised Bed Wheat Row Planter. American Journal of Mechanical and Industrial Engineering, 10(3), 52-61. https://doi.org/10.11648/j.ajmie.20251003.11
ACS Style
Bona, H.; Tibesso, A.; Wirtu, R. Adaptation and Performance Evaluation of Tractor Drawn Raised Bed Wheat Row Planter. Am. J. Mech. Ind. Eng. 2025, 10(3), 52-61. doi: 10.11648/j.ajmie.20251003.11
@article{10.11648/j.ajmie.20251003.11,
  author = {Husen Bona and Adem Tibesso and Rebira Wirtu},
  title = {Adaptation and Performance Evaluation of Tractor Drawn Raised Bed Wheat Row Planter
},
  journal = {American Journal of Mechanical and Industrial Engineering},
  volume = {10},
  number = {3},
  pages = {52-61},
  doi = {10.11648/j.ajmie.20251003.11},
  url = {https://doi.org/10.11648/j.ajmie.20251003.11},
  eprint = {https://article.sciencepublishinggroup.com/pdf/10.11648.j.ajmie.20251003.11},
  abstract = {An integrated tractor-drawn wheat and fertilizer planter was fabricated in Jimma Agricultural Engineering Research Center workshop and evaluated at Omo Nadda district of Oromia region at a farmer’s field. The experiment was conducted to develop and evaluate the performance of a planter capable of sowing seeds and applying fertilizer at predetermined row spacing and depths. The developed planter consisted of a frame, seed hopper, seed metering devices, seed tube, and adjustable furrow opener. The performances were evaluated in terms of seed and fertilizer rate, row spacing, depth, field capacity, field efficiency, labor cost, and economics of owning and operating. Randomized complete block design with each of three levels speeds (3, 4, and 5 km/hr) hopper fill (H0.5, H0.75, and H1) was used. There were no mechanical seeds damaged by the planter at all speed and it indicated that there was no reduction in percent germination of the seeds when compared with the recommended germination percentage. The seed and fertilizer rate was calibrated at 125 kg/ha and 150 kg/ha respectively for 20 cm row spacing and 5 cm depth as per wheat agronomic requirement. The planter was evaluated at speeds of 3, 4, and 5 km/hr and hopper filling levels of H0.5, H0.75, and H1. Both forward speed and hopper filling had a significant effect on seed and fertilizer rate at p < 0.05. The mean effective field capacity, field efficiency, and fuel consumption were 0.45 ha/hr, 91.84%, and 2.95 l/hr at a speed of 3 km/hr. Based on the performance evaluation results, it is concluded that the developed planter can be efficiently, effectively, and economically used by the farmers.
},
 year = {2025}
}
TY  - JOUR
T1  - Adaptation and Performance Evaluation of Tractor Drawn Raised Bed Wheat Row Planter

AU  - Husen Bona
AU  - Adem Tibesso
AU  - Rebira Wirtu
Y1  - 2025/06/30
PY  - 2025
N1  - https://doi.org/10.11648/j.ajmie.20251003.11
DO  - 10.11648/j.ajmie.20251003.11
T2  - American Journal of Mechanical and Industrial Engineering
JF  - American Journal of Mechanical and Industrial Engineering
JO  - American Journal of Mechanical and Industrial Engineering
SP  - 52
EP  - 61
PB  - Science Publishing Group
SN  - 2575-6060
UR  - https://doi.org/10.11648/j.ajmie.20251003.11
AB  - An integrated tractor-drawn wheat and fertilizer planter was fabricated in Jimma Agricultural Engineering Research Center workshop and evaluated at Omo Nadda district of Oromia region at a farmer’s field. The experiment was conducted to develop and evaluate the performance of a planter capable of sowing seeds and applying fertilizer at predetermined row spacing and depths. The developed planter consisted of a frame, seed hopper, seed metering devices, seed tube, and adjustable furrow opener. The performances were evaluated in terms of seed and fertilizer rate, row spacing, depth, field capacity, field efficiency, labor cost, and economics of owning and operating. Randomized complete block design with each of three levels speeds (3, 4, and 5 km/hr) hopper fill (H0.5, H0.75, and H1) was used. There were no mechanical seeds damaged by the planter at all speed and it indicated that there was no reduction in percent germination of the seeds when compared with the recommended germination percentage. The seed and fertilizer rate was calibrated at 125 kg/ha and 150 kg/ha respectively for 20 cm row spacing and 5 cm depth as per wheat agronomic requirement. The planter was evaluated at speeds of 3, 4, and 5 km/hr and hopper filling levels of H0.5, H0.75, and H1. Both forward speed and hopper filling had a significant effect on seed and fertilizer rate at p < 0.05. The mean effective field capacity, field efficiency, and fuel consumption were 0.45 ha/hr, 91.84%, and 2.95 l/hr at a speed of 3 km/hr. Based on the performance evaluation results, it is concluded that the developed planter can be efficiently, effectively, and economically used by the farmers.

VL  - 10
IS  - 3
ER  -
Oromia Agricultural Research Institute, Jimma Agricultural Engineering Research Center, Jimma, Ethiopia
Information