Metal Inert Gas (MIG) welding is a widely utilized welding process due to its efficiency and versatility. The weld droplet diameter is a critical parameter that significantly influences weld quality, including bead geometry, penetration, and mechanical properties. This study investigates the effects of welding current, voltage, and wire feed rate on the weld droplet diameter using locally sourced materials. A design of experiments (DOE) approach was employed, with parent samples measuring 40mm × 40mm × 10mm. Twenty experimental runs were conducted, and the results were analyzed using ANOVA. The findings reveal that voltage and current have a significant impact on the droplet diameter, while the wire feed rate exhibits negligible influence. A mathematical model was developed to predict the droplet diameter, and optimization was performed to identify the optimal process parameters. The model demonstrated a high R² value of 0.9008, indicating a strong correlation between the predicted and experimental results. The optimal parameters for achieving a droplet diameter of 1.024mm were identified as a current of 240A, a voltage of 24.168V, and a wire feed rate of 3.0mm/s. This study provides valuable insights into the relationship between process parameters and droplet diameter, offering a framework for optimizing MIG welding to enhance weld quality.
| Published in | American Journal of Materials Synthesis and Processing (Volume 10, Issue 2) |
| DOI | 10.11648/j.ajmsp.20251002.11 |
| Page(s) | 27-35 |
| Creative Commons |
This is an Open Access article, distributed under the terms of the Creative Commons Attribution 4.0 International License (http://creativecommons.org/licenses/by/4.0/), which permits unrestricted use, distribution and reproduction in any medium or format, provided the original work is properly cited. |
| Copyright |
Copyright © The Author(s), 2025. Published by Science Publishing Group |
MIG, Shielding Gas, Wire Feed Rate, Droplet Diameter
Range | Factor 1: Current (A) | Factor 2: Voltage (V) | Factor 3: Wire Feed Rate (mm/s) |
|---|---|---|---|
Min | 240 | 23 | 2.4 |
Max | 270 | 26 | 3.0 |
Std | Run | Factor 1 | Factor 2 | Factor 3 | Response 1 |
|---|---|---|---|---|---|
A: Current | B: Voltage | C: Wire feed rate | Droplet diameter | ||
A | V | mm/s | mm | ||
17 | 1 | 250 | 24 | 2.6 | 1.16 |
9 | 2 | 260 | 23 | 2.8 | 0.96 |
10 | 3 | 240 | 25 | 2.8 | 1.13 |
12 | 4 | 250 | 24 | 2.6 | 1 |
20 | 5 | 250 | 24 | 2.6 | 1.16 |
18 | 6 | 250 | 26 | 2.6 | 0.71 |
16 | 7 | 260 | 25 | 2.8 | 0.92 |
3 | 8 | 250 | 24 | 2.6 | 1.17 |
14 | 9 | 240 | 25 | 2.4 | 1.01 |
8 | 10 | 250 | 24 | 2.6 | 1.23 |
4 | 11 | 260 | 23 | 2.4 | 1.26 |
5 | 12 | 240 | 24 | 2.6 | 1.3 |
2 | 13 | 260 | 25 | 2.4 | 0.72 |
7 | 14 | 250 | 23 | 2.6 | 1.07 |
19 | 15 | 270 | 24 | 2.6 | 1.1 |
11 | 16 | 250 | 24 | 2.4 | 1.13 |
6 | 17 | 250 | 24 | 3 | 0.95 |
15 | 18 | 240 | 23 | 2.4 | 1.33 |
1 | 19 | 240 | 23 | 2.8 | 0.98 |
13 | 20 | 250 | 24 | 2.6 | 1.26 |
Source | Sum of Squares | df | Mean Square | F-value | p-value | |
|---|---|---|---|---|---|---|
Model | 0.5127 | 9 | 0.0570 | 10.09 | 0.0006 | Significant |
A-Current | 0.0328 | 1 | 0.0328 | 5.80 | 0.0367 | |
B-Voltage | 0.0957 | 1 | 0.0957 | 16.94 | 0.0021 | |
C-Wire feed rate | 0.0002 | 1 | 0.0002 | 0.0316 | 0.8624 | |
AB | 0.0210 | 1 | 0.0210 | 3.72 | 0.0826 | |
AC | 0.0021 | 1 | 0.0021 | 0.3741 | 0.5544 | |
BC | 0.1176 | 1 | 0.1176 | 20.83 | 0.0010 | |
A² | 0.0065 | 1 | 0.0065 | 1.15 | 0.3096 | |
B² | 0.0953 | 1 | 0.0953 | 16.87 | 0.0021 | |
C² | 0.0230 | 1 | 0.0230 | 4.08 | 0.0711 | |
Residual | 0.0565 | 10 | 0.0056 | |||
Lack of Fit | 0.0159 | 5 | 0.0032 | 0.3932 | 0.8357 | not significant |
Pure Error | 0.0405 | 5 | 0.0081 | |||
Cor Total | 0.5692 | 19 |
Std. Dev. | Mean | C.V.% | R² | Adjusted R² | Predicted R² |
|---|---|---|---|---|---|
0.0751 | 1.08 | 6.97 | 0.9008 | 0.8115 | 0.6249 |
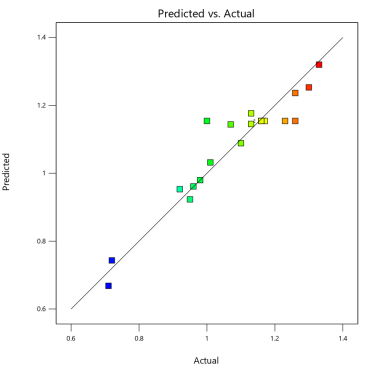
Run Order | Actual Value | Predicted Value | Residual | Leverage | Internally Studentized Residuals | Externally Studentized Residuals | Cook's Distance | Influence on Fitted Value DFFITS | Standard Order |
|---|---|---|---|---|---|---|---|---|---|
1 | 1.16 | 1.15 | 0.0058 | 0.138 | 0.083 | 0.079 | 0.000 | 0.032 | 17 |
2 | 0.9600 | 0.9613 | -0.0013 | 0.720 | -0.032 | -0.031 | 0.000 | -0.049 | 9 |
3 | 1.13 | 1.18 | -0.0466 | 0.720 | -1.173 | -1.198 | 0.353 | -1.920 | 10 |
4 | 1.0000 | 1.15 | -0.1542 | 0.138 | -2.210 | -2.931 | 0.078 | -1.172 | 12 |
5 | 1.16 | 1.15 | 0.0058 | 0.138 | 0.083 | 0.079 | 0.000 | 0.032 | 20 |
6 | 0.7100 | 0.6684 | 0.0416 | 0.817 | 1.295 | 1.346 | 0.749 | 2.846⁽¹⁾ | 18 |
7 | 0.9200 | 0.9531 | -0.0331 | 0.636 | -0.729 | -0.711 | 0.093 | -0.940 | 16 |
8 | 1.17 | 1.15 | 0.0158 | 0.138 | 0.226 | 0.215 | 0.001 | 0.086 | 3 |
9 | 1.01 | 1.03 | -0.0218 | 0.778 | -0.617 | -0.596 | 0.133 | -1.116 | 14 |
10 | 1.23 | 1.15 | 0.0758 | 0.138 | 1.086 | 1.097 | 0.019 | 0.439 | 8 |
11 | 1.26 | 1.24 | 0.0235 | 0.778 | 0.664 | 0.644 | 0.154 | 1.206 | 4 |
12 | 1.30 | 1.25 | 0.0470 | 0.261 | 0.728 | 0.709 | 0.019 | 0.422 | 5 |
13 | 0.7200 | 0.7433 | -0.0233 | 0.720 | -0.585 | -0.565 | 0.088 | -0.905 | 2 |
14 | 1.07 | 1.14 | -0.0739 | 0.261 | -1.144 | -1.164 | 0.046 | -0.692 | 7 |
15 | 1.10 | 1.09 | 0.0114 | 0.817 | 0.354 | 0.338 | 0.056 | 0.714 | 19 |
16 | 1.13 | 1.15 | -0.0153 | 0.261 | -0.237 | -0.225 | 0.002 | -0.134 | 11 |
17 | 0.9500 | 0.9230 | 0.0270 | 0.817 | 0.839 | 0.825 | 0.314 | 1.745 | 6 |
18 | 1.33 | 1.32 | 0.0099 | 0.810 | 0.304 | 0.289 | 0.039 | 0.598 | 15 |
19 | 0.9800 | 0.9799 | 0.0001 | 0.778 | 0.004 | 0.004 | 0.000 | 0.007 | 1 |
20 | 1.26 | 1.15 | 0.1058 | 0.138 | 1.516 | 1.639 | 0.037 | 0.655 | 13 |
Number | Current (A) | Voltage (V) | Wire Feed Rate (mm/s) | Droplet Diameter (mm) | Desirability |
|---|---|---|---|---|---|
1 | 240.000 | 24.168 | 3.000 | 1.024 | 0.801 |
MIG | Metal Inert Gas |
GMAW | Gas Metal Arc Welding |
DOE | Design of Experiments |
ANOVA | Analysis of Variance |
R² | Coefficient of Determination (R-squared) |
A | Current (in the Mathematical Model) |
V | Voltage (in the Mathematical Model) |
mm/s | Millimeters per Second (Wire Feed Rate Unit) |
DD | Droplet Diameter |
df | Degrees of Freedom (in ANOVA Table) |
Std | Standard (in Experimental Results Table) |
Run | Experimental Run (in Tables) |
Min | Minimum |
Max | Maximum |
C.V. | Coefficient of Variation |
Std. Dev. | Standard Deviation |
DFFITS | Influence on Fitted Value (Diagnostic Metric) |
| [1] | Achebo, J. and Odinikuku, W. E. (2015): Optimization of Gas Metal Arc Welding Process Parameters Using Standard Deviation (SDV) and Multi-Objective Optimization on the Basis of Ratio Analysis (MOORA). Journal of Minerals and Materials Characterization and Engineering (JMMCE), 3, pp. 298-308. |
| [2] | Anowa, H. D., Achebo, J. I., Ozigagun, A., and Etin-Osa, E. C. (2018): Analysis of weld molten metal kinematic viscosity of TIG mild steel weld. International Journal of Advanced Engineering and Management Research, 3, ISSN: 2456-3676. |
| [3] | Achebo, J. I., Ezeliora, C. D. and Umeh, M. N., 2024. Statistical Evaluation of the Impact Strength on Mild Steel Cladding Weld Metal Geometry. |
| [4] | Choi, J. W., Li, W., Ushioda, K., Yamamoto, M., and Fujii, H. (2022): Strengthening mechanism of high-pressure linear friction welded AA7075-T6 joint. Materials Characterization, 191, p. 112112. |
| [5] | Deutsches Institut DIN, für Normung e. V. (2023): Schweißen - Schmelzschweißverbindungen an Stahl, Nickel, Titan und deren Legierungen (ohne Strahlschweißen) - Bewertungsgruppen von Unregelmäßigkeiten (ISO 5817: 2023). Berlin: DIN Media GmbH. |
| [6] | Erhunmwun, I. D. and Etin-Osa, C. E. (2019): Temperature distribution in centrifugal casting with partial solidification during pouring. Materials and Engineering Technology, ISSN: 2667-4033. |
| [7] | Etin-Osa, C. E. and Achebo, J. I. (2017): Analysis of optimum butt welded joint for mild steel components using FEM (ANSYS). American Journal of Naval Architecture and Marine Engineering, 2(3), pp. 61-70. |
| [8] | Etin-Osa, E. C. and Ogbeide, O. O. (2021): Optimization of the weld bead volume of tungsten inert gas mild steel using response surface methodology. NIPES Journal of Science and Technology Research, 3(4), pp. 314-321. |
| [9] | Imhansoloeva, N. A., Achebo, J. I., Obahiagbon, K., Osarenmwinda, J. O., and Etin-Osa, C. E. (2018): Optimization of the deposition rate of tungsten inert gas mild steel using response surface methodology. Scientific Research Publishing, pp. 784-804. |
| [10] | Jamrozik, W., Górka, J., and Kik, T. (2021): Temperature-based prediction of joint hardness in TIG welding of Inconel 600, 625, and 718 nickel superalloys. Materials, 14, p. 442. |
| [11] | Jorge, J. C. F., Souza, L. F. G. D., Mendes, M. C., Bott, I. S., Araújo, L. S., Santos, V. R. D., Rebello, J. M. A., and Evans, G. M. (2021): Microstructure characterization and its relationship with impact toughness of C-Mn and high-strength low alloy steel weld metals - a review. Journal of Materials Research and Technology, 10, pp. 471-501. |
| [12] | Kataria, R., Pratap Singh, R., Sharma, P., and Phanden, R. K. (2021): Welding of super alloys: A review. Materials Today: Proceedings, 38, pp. 265-268. |
| [13] | Kuroiwa, R., Liu, H., Aoki, Y., Yoon, S., Fujii, H., Murayama, G., and Yasuyama, M. (2020): Microstructure control of medium carbon steel joints by low-temperature linear friction welding. Science and Technology of Welding and Joining, 25(1), pp. 1-9. |
| [14] | Li, S., Liu, Q., Rui, S.-S., et al. (2022): Fatigue crack initiation behaviors around defects induced by welding thermal cycle in superalloy IN617B. International Journal of Fatigue, 158, p. 106745. |
| [15] | Lu, S., Lu, Y., Shen, H., Chen, Y., Zhang, Z., and Sun, X. (2019): Investigation on microstructure and mechanical properties of a low-temperature multi-pass tungsten inert gas welding process. Journal of Materials Processing Technology, 265, pp. 1-9. |
| [16] | Mani, K., Uthayakumar, M., Kumar, M. P., and Sekar, K. (2019): Optimization of friction welding parameters on microstructure and mechanical properties of Al6061 and AISI 304 dissimilar joint. Procedia Manufacturing, 30, pp. 505-512. |
| [17] | Mughal, M. P., and Sajjad, M. (2022): Application of Six Sigma DMAIC to improve weld quality in shipbuilding. Shipbuilding Technology and Research, 2(4), pp. 234-240. |
| [18] | Ogbeide, O. O., Afolalu, T. D., and Etin-Osa, C. E. (2021): Investigation into microstructural and mechanical properties of friction stir welded aluminum alloy using optimized welding parameters. Journal of Materials Science Research and Reviews, 8(3), pp. 21-30. |
| [19] | Achebo, J. I., 2009. Evaluation of Wear Severity in Pipeline. Journal of Engineering and Applied Sciences, 4(1), pp. 74-76. |
| [20] | Quintana, E., and Amaya, M. (2022): Advances in the development of hybrid laser arc welding processes: A review. Welding in the World, 66(6), pp. 1365-1380. |
| [21] | Ravindran, M., and Janarthanan, B. (2019): Investigations on the effect of preheating and post-weld heat treatment on the mechanical and metallurgical properties of TIG welded joints of Inconel 718. Materials Today: Proceedings, 27, pp. 2440-2444. |
| [22] | Shaikh, S., and Chourasia, D. (2021): Mechanical and microstructural characterization of dissimilar metal TIG welding between austenitic stainless steel and mild steel. Materials Today: Proceedings, 43(Part 2), pp. 1626-1631. |
| [23] | Ogbeide, O. O. and Etin-Osa, E. C., 2023. Prediction of hardness of mild steel welded joints in a tungsten inert gas welding process using artificial neural network. JASEM, 27(11), pp. 2381-2386. |
| [24] | Otimeyin, A. W., Achebo, J. I., & Frank, U. (2025). Advanced Modeling and Optimization of Weldment Responses Using Statistical and Metaheuristic Techniques. American Journal of Mechanical and Materials Engineering, 9(1), 25-36. |
| [25] | Achebo, J. I. and Eki, M. U., 2020. Prediction of mild steel weld properties using artificial neural network and regression analysis. Tropical Journal of Science and Technology, 1(2), pp. 37-49. |
APA Style
Ijoni, V. A., Achebo, J. I., Etin-Osa, C. E. (2025). The Influence of Process Parameters on Weld Droplet Diameter in MIG Welding: An Experimental Study. American Journal of Materials Synthesis and Processing, 10(2), 27-35. https://doi.org/10.11648/j.ajmsp.20251002.11
ACS Style
Ijoni, V. A.; Achebo, J. I.; Etin-Osa, C. E. The Influence of Process Parameters on Weld Droplet Diameter in MIG Welding: An Experimental Study. Am. J. Mater. Synth. Process. 2025, 10(2), 27-35. doi: 10.11648/j.ajmsp.20251002.11
@article{10.11648/j.ajmsp.20251002.11,
  author = {Victor Avokerie Ijoni and Joseph Ifeanyi Achebo and Collins Eruogun Etin-Osa},
  title = {The Influence of Process Parameters on Weld Droplet Diameter in MIG Welding: An Experimental Study
},
  journal = {American Journal of Materials Synthesis and Processing},
  volume = {10},
  number = {2},
  pages = {27-35},
  doi = {10.11648/j.ajmsp.20251002.11},
  url = {https://doi.org/10.11648/j.ajmsp.20251002.11},
  eprint = {https://article.sciencepublishinggroup.com/pdf/10.11648.j.ajmsp.20251002.11},
  abstract = {Metal Inert Gas (MIG) welding is a widely utilized welding process due to its efficiency and versatility. The weld droplet diameter is a critical parameter that significantly influences weld quality, including bead geometry, penetration, and mechanical properties. This study investigates the effects of welding current, voltage, and wire feed rate on the weld droplet diameter using locally sourced materials. A design of experiments (DOE) approach was employed, with parent samples measuring 40mm × 40mm × 10mm. Twenty experimental runs were conducted, and the results were analyzed using ANOVA. The findings reveal that voltage and current have a significant impact on the droplet diameter, while the wire feed rate exhibits negligible influence. A mathematical model was developed to predict the droplet diameter, and optimization was performed to identify the optimal process parameters. The model demonstrated a high R² value of 0.9008, indicating a strong correlation between the predicted and experimental results. The optimal parameters for achieving a droplet diameter of 1.024mm were identified as a current of 240A, a voltage of 24.168V, and a wire feed rate of 3.0mm/s. This study provides valuable insights into the relationship between process parameters and droplet diameter, offering a framework for optimizing MIG welding to enhance weld quality.},
 year = {2025}
}
TY  - JOUR
T1  - The Influence of Process Parameters on Weld Droplet Diameter in MIG Welding: An Experimental Study

AU  - Victor Avokerie Ijoni
AU  - Joseph Ifeanyi Achebo
AU  - Collins Eruogun Etin-Osa
Y1  - 2025/07/30
PY  - 2025
N1  - https://doi.org/10.11648/j.ajmsp.20251002.11
DO  - 10.11648/j.ajmsp.20251002.11
T2  - American Journal of Materials Synthesis and Processing
JF  - American Journal of Materials Synthesis and Processing
JO  - American Journal of Materials Synthesis and Processing
SP  - 27
EP  - 35
PB  - Science Publishing Group
SN  - 2575-1530
UR  - https://doi.org/10.11648/j.ajmsp.20251002.11
AB  - Metal Inert Gas (MIG) welding is a widely utilized welding process due to its efficiency and versatility. The weld droplet diameter is a critical parameter that significantly influences weld quality, including bead geometry, penetration, and mechanical properties. This study investigates the effects of welding current, voltage, and wire feed rate on the weld droplet diameter using locally sourced materials. A design of experiments (DOE) approach was employed, with parent samples measuring 40mm × 40mm × 10mm. Twenty experimental runs were conducted, and the results were analyzed using ANOVA. The findings reveal that voltage and current have a significant impact on the droplet diameter, while the wire feed rate exhibits negligible influence. A mathematical model was developed to predict the droplet diameter, and optimization was performed to identify the optimal process parameters. The model demonstrated a high R² value of 0.9008, indicating a strong correlation between the predicted and experimental results. The optimal parameters for achieving a droplet diameter of 1.024mm were identified as a current of 240A, a voltage of 24.168V, and a wire feed rate of 3.0mm/s. This study provides valuable insights into the relationship between process parameters and droplet diameter, offering a framework for optimizing MIG welding to enhance weld quality.
VL  - 10
IS  - 2
ER  -
Department of Production Engineering, University of Benin, Benin City, Nigeria
Department of Production Engineering, University of Benin, Benin City, Nigeria
Department of Production Engineering, University of Benin, Benin City, Nigeria
Information