
The level of fertilizer application is among the factors prioritized for rice production constraints in Ethiopia, Sierra Leone, and Angola. Therefore, a field experiment was conducted to determine the influence of Nitrogen and Phosphorous fertilizer on growth, yield and yield components of NERICA 4 rice variety under upland condition at Tsukuba International Center, Japan during 2025 cropping season. The experiment involved factorial combinations of three rates of Nitrogen (0, 60 and 120 kg N ha-1) and three rates of Phosphorous (0, 50 and 100 kg P2O5 ha-1) laid out in 3×3 factorial arrangements in RCBD with three replications. Growth and yield of rice were significantly affected by nitrogen levels and the treatment difference, but not by phosphorus fertilizer levels. Due to the sufficient phosphorus in the experimental field, the application of high phosphorus did not have a significant effect. The significant highest grain yield (3.49 t ha-1), number of panicles per m2 (281.7), N uptake (103.8 kg ha-1) and P uptake (21.8 kg ha-1) were obtained from application of 120 kg N ha-1. Applying 60 kg N ha-1 and no phosphorus application produced the highest agronomic efficiency and statistically equivalent to the highest application of nitrogen (120 kg N ha-1) and phosphorus (100 kg P2O5 ha-1), making it an economical treatment. However, this one season and one location study must be reconfirmed in different seasons and over locations to make a sound conclusion.
| Published in | American Journal of Plant Biology (Volume 11, Issue 3) |
| DOI | 10.11648/j.ajpb.20261103.20 |
| Page(s) | 120-135 |
| Creative Commons |
This is an Open Access article, distributed under the terms of the Creative Commons Attribution 4.0 International License (http://creativecommons.org/licenses/by/4.0/), which permits unrestricted use, distribution and reproduction in any medium or format, provided the original work is properly cited. |
| Copyright |
Copyright © The Author(s), 2026. Published by Science Publishing Group |
Fertilizer Rate, Grain Yield, Inorganic Fertilizer, Soil Analysis, Upland Rice
Nitrogen rate (kg ha-1) | Phosphorous (P2O5) rate (kg ha-1) | ||
|---|---|---|---|
0 | 50 | 100 | |
0 | N0P0 | N0P50 | N0P100 |
60 | N60P0 | N60P50 | N60P100 |
120 | N120P0 | N120P50 | N120P100 |
Soil parameter tested | Result | Rating | Reference |
|---|---|---|---|
Total N (%) | 0.309 | Very high | [17] |
Available P2O5 (mg kg-1) | 105.3 | Very High | [18] |
Total Carbon (%) | 3.64 | Medium | [19] |
Ca (mg 100g-1) | 188.7 | Very high | [20] |
K (mg 100g-1) | 61.9 | Very high | [20] |
Mg (mg 100g-1) | 22.1 | Very high | [20] |
Na (mg 100g-1) | 3.3 | Very high | [20] |
Total cations (meq 100g-1) | 13.13 | - | |
CEC (meq 100g-1) | 43.7 | Very high | [20] . |
Base saturation (%) | 30.2 | Low | [17] |
Growth stages | Parameter | Mean square for source of variation | ||||
|---|---|---|---|---|---|---|
N rate (2) | P rate (2) | Rep (2) | Nx P rate (4) | MS of Error (16) | ||
Early Growth stage | Plant length (cm) | 77.99** | 0.52ns | 14.43ns | 4.47ns | 4.30 |
Stem number | 1713.37ns | 49.59ns | 725.90ns | 333.15ns | 488.93 | |
SPAD value | 11.16* | 12.39* | 35.77** | 5.07ns | 3.00 | |
Active Tillering stage | Plant length (cm) | 347.52** | 12.02ns | 1.70ns | 9.82ns | 8.51 |
Stem number | 25876.26** | 69.37ns | 3946.7* | 779.76ns | 905.62 | |
SPAD value | 56.25** | 0.13ns | 1.31ns | 0.75ns | 2.30 | |
Maximum Tillering stage | Plant length (cm) | 509.74** | 81.40ns | 20.40ns | 26.56ns | 31.52 |
Stem number | 25225.30** | 243.11ns | 1711.40ns | 793.11ns | 655.53 | |
SPAD value | 99.85** | 1.51ns | 9.01* | 1.04ns | 2.39 | |
Leaf Area Index | 3.06** | 0.15ns | 0.17ns | 0.251ns | 0.25 | |
Dry weight (g m-2) | 31616.83** | 1240.84ns | 5250.29ns | 2006.91ns | 2444.11 | |
Panicle Initiation Stage | Plant length (cm) | 416.42** | 0.51ns | 3.89ns | 8.44ns | 11.52 |
Stem number | 24815.44** | 424.33ns | 2088.44ns | 750.11ns | 682.69 | |
SPAD value | 47.37** | 6.85* | 1.58ns | 0.176ns | 1.30 | |
Leaf Area Index | 12.6** | 0.82ns | 0.075ns | 0.227ns | 0.47 | |
Dry weight (g m-2) | 165250.50** | 7050.09ns | 1093.12ns | 6205.40ns | 2124.06 | |
50% Heading Stage | Plant length (cm) | 255.43** | 6.90ns | 10.10ns | 7.20ns | 23.2 |
Stem number | 21544.48** | 497.37ns | 353.59ns | 428.59ns | 392.26 | |
SPAD value | 127.1** | 6.16ns | 1.53ns | 2.59ns | 2.35 | |
Leaf Area Index | 4.05** | 0.37ns | 0.02ns | 0.65ns | 0.28 | |
Dry weight (g m-2) | 143134.78** | 24331.9* | 5483.67ns | 1148.88ns | 5794.40 | |
14 days after 50% Heading Stage | Plant length (cm) | 263.94** | 8.07ns | 11.92ns | 6.61ns | 19.1 |
Stem number | 17887.26** | 632.26ns | 1045.59ns | 159.71ns | 30.0 | |
SPAD value | 58.4** | 0.54ns | 9.57* | 2.09ns | 1.98 | |
Leaf Area Index | 8.21** | 0.04ns | 0.61ns | 0.21ns | 0.38 | |
Dry weight (g m-2) | 254559.35** | 9225.59ns | 9658.79ns | 24248.17ns | 9170.02 | |
Yield and yield components | Mean square for source of variation | ||||
|---|---|---|---|---|---|
N rate (2) | P rate (2) | Rep (2) | Nx P rate (4) | MS of Error (16) | |
No. of panicle per m2 | 16227.1** | 1159.03ns | 121.53ns | 236.11ns | 1271.53 |
No. of spikelet per panicle | 181.82ns | 52.34ns | 57.33ns | 25.39ns | 64.79 |
%ge of Ripened grains | 2.75ns | 121.48ns | 141.71ns | 42.28ns | 59.44 |
1,000 grain weight (g) | 0.035ns | 0.12ns | 0.81* | 0.13ns | 0.18 |
Above ground biomass (t ha-1) | 29.51** | 1.34ns | 0.86ns | 0.83ns | 0.96 |
Yield (t ha-1) | 3.90** | 0.31ns | 0.56ns | 0.25ns | 0.21 |
Harvest Index | 0.00ns | 0.001ns | 0.006ns | 0.001ns | 0.002 |
N levels kg ha-1 | No. of Panicles m-2 | No. of spikelet per panicle | %ge of Ripened grains | 1,000 grain weight (g) | Yield (t ha-1) | Harvest index |
|---|---|---|---|---|---|---|
0 | 198.3b | 75.9 | 60.3 | 24.6 | 2.22b | 0.36 |
60 | 254.2a | 84.1 | 59.8 | 24.7 | 3.16a | 0.36 |
120 | 281.7a | 83.1 | 60.9 | 24.8 | 3.49a | 0.36 |
P2O5 levels kg ha-1 | ||||||
0 | 239.2 | 82.5 | 57.2 | 24.7 | 2.78 | 0.35 |
50 | 237.2 | 78.2 | 64.4 | 24.6 | 2.94 | 0.37 |
100 | 257.8 | 82.3 | 59.4 | 24.8 | 3.15 | 0.36 |
Mean | 244.7 | 81.0 | 60.3 | 24.7 | 2.96 | 0.36 |
MSD | 43.4 | 9.8 | 9.4 | 0.5 | 0.56 | 0.06 |
Cv (%) | 14.6 | 9.9 | 12.8 | 1.7 | 15.6 | 12.9 |
F-test | ||||||
N levels | ** | ns | ns | ns | ** | ns |
P levels | ns | ns | ns | ns | ns | ns |
N X P | ns | ns | ns | ns | ns | ns |
Nutrient concentration and Uptake | Mean square for source of variation | ||||
|---|---|---|---|---|---|
N rate (2) | P rate (2) | Rep (2) | Nx P rate (4) | MS of Error (16) | |
N concentration | 0.036* | 0.002ns | 0.01ns | 0.0036ns | 0.0085 |
P concentration | 0.003* | 0.001ns | 0.001ns | 0.0004ns | 0.0006 |
K concentration | 0.0099ns | 0.002ns | 0.013ns | 0.007ns | 0.009 |
N uptake | 4747.28** | 205.96 | 230.91 | 97.64 | 92.2 |
P uptake | 86.95** | 3.20 | 7.44 | 6.81 | 7.936 |
K uptake | 742.67** | 74.51 | 136.44 | 105.61 | 75.895 |
N levels kg ha-1 | Nutrient concentration (%) | Nutrient uptake (kg ha-1) | ||||
|---|---|---|---|---|---|---|
N | P | K | N | P | K | |
0 | 0.961b | 0.26a | 0.56 | 60.1b | 16.2b | 35.3b |
60 | 1.067ab | 0.24ab | 0.58 | 94.3a | 21.3a | 51.7a |
120 | 1.074a | 0.22b | 0.52 | 103.8a | 21.8a | 50.2a |
P2O5 Levels kg ha-1 | ||||||
0 | 1.044 | 0.24 | 0.57 | 84.2 | 19.1 | 45.3 |
50 | 1.017 | 0.25 | 0.54 | 82.5 | 20.0 | 43.1 |
100 | 1.041 | 0.23 | 0.56 | 91.5 | 20.2 | 48.8 |
Mean | 0.40 | 0.24 | 0.55 | 86.7 | 19.75 | 45.75 |
MSD | 0.112 | 0.03 | 0.115 | 11.68 | 3.43 | 10.6 |
Cv (%) | 8.9 | 10.2 | 17.1 | 11.2 | 14.26 | 19.0 |
F-test | ||||||
N levels | * | * | ns | ** | ** | ** |
P levels | ns | ns | ns | ns | ns | ns |
N X P | ns | ns | ns | ns | ns | ns |
N levels kg ha-1 | Phosphorous levels (P2O5) kg ha-1 | ||
|---|---|---|---|
0 | 50 | 100 | |
0 | - | 2.6 | -1.6 |
6 | 13.0 | 6.2 | 8.3 |
120 | 7.3 | 7.6 | 7.3 |
Nutrient content of soil | Mean square for source of variation | ||||
|---|---|---|---|---|---|
N rate (2) | P rate (2) | Rep (2) | Nx P rate (4) | MS of Error (16) | |
Electrical conductivity | 0.00271** | 0.00158** | 0.00018 ns | 0.00004 ns | 0.00014 |
pH | 0.0715* | 0.0015ns | 0.0904** | 0.0037 ns | 0.0141 |
Total N (%) | 0.00007ns | 0.00003ns | 0.0001* | 0.00001ns | 0.00003 |
Av. P (mg P2O5 kg-1) | 180.94ns | 339.84ns | 2223.26* | 814.97ns | 396.93 |
K (mg K2O kg-1) | 305.167* | 117.006ns | 198.525ns | 14.826ns | 57.1644 |
Total carbon (%) | 0.012ns | 0.004ns | 0.057* | 0.002ns | 0.01064 |
N levels kg ha-1 | EC (mS cm-1) | pH | Total N (%) | Available P (mg P2O5 kg-1) | K (mg K2O kg-1) | Total carbon (%) |
|---|---|---|---|---|---|---|
0 | 0.12b | 6.33a | 0.328 | 108.7 | 73.6a | 3.84 |
60 | 0.14a | 6.26ab | 0.331 | 106.2 | 70.6ab | 3.86 |
120 | 0.15a | 6.16b | 0.333 | 114.9 | 62.3b | 3.91 |
P2O5 Levels kg ha-1 | ||||||
0 | 0.12b | 6.23 | 0.333 | 103.0 | 69.7 | 3.87 |
50 | 0.14a | 6.26 | 0.330 | 114.8 | 71.9 | 3.85 |
100 | 0.14a | 6.26 | 0.330 | 112.0 | 64.9 | 3.89 |
Mean | 0.14 | 6.25 | 0.33 | 109.9 | 68.8 | 3.87 |
MSD | 0.01 | 0.145 | 0.006 | 24.23 | 9.2 | 0.125 |
Cv (%) | 8.6 | 1.9 | 1.5 | 18.1 | 11.0 | 2.7 |
F-test | ||||||
N levels | ** | * | ns | ns | * | ns |
P levels | ** | ns | ns | ns | ns | ns |
N X P | ns | ns | ns | ns | ns | ns |
CV | Coefficient of Variation |
CEC | Cation Exchange Capacity |
DAS | Days After Sowing |
EC | Electric Conductivity |
HSD | Honest Significant Difference |
JICA | Japan International Cooperation Agency |
LAI | Leaf Area Index |
LSD | Least Significant Difference |
MSD | Minimum Significant Difference |
m.a.s.l | Meter Above Sea Level |
NERICA | New Rice for Africa |
RCBD | Randomized Complete Bock Design |
| [1] | Zhao, L., Wu, L., Wu, M. and Li, Y., 2011. Nutrient uptake and water use efficiency as affected by modified rice cultivation methods with reduced irrigation. Paddy and Water Environment, 9, pp. 25-32. |
| [2] | Africa Rice Center (Africa rice), 2010. Improving Access to Rice Seed and Building a Rice Data System for Sub-Saharan Africa (Japan Emergency Project). Final Report of the Japan Emergency Project, Cotonou, Benin. |
| [3] | Dustin L. H. and Sterling B. B., 2005. Rice yield components as affected by cultivar and seeding rate. Vol. 97. No. 6. 1622-1625. |
| [4] | Oonyu, J., 2011. Upland rice growing: A potential solution to declining crop yields and the degradation of the Doho wetlands, Butaleja district-Uganda. African Journal of Agricultural Research, 6(12), pp. 2774-2783. |
| [5] | Fageria, N. K. and Barbosa Filho, M. P., 2001. Nitrogen use efficiency in lowland rice genotypes. Communications in Soil Science and Plant Analysis, 32(13-14), pp. 2079-2089. |
| [6] | Mingotte, F. L. C., Hanashiro, R. K. and Fornasieri Filho, D., 2013. Response of rice cultivars to nitrogen in upland conditions. Revista Ceres, 60, pp. 86-95. |
| [7] | Ferraz Junior, A. D. L., De Souza, S. R., Fernandes, M. S. and Rossiello, R. O. P., 1997. Nitrogen use efficiency for grain and protein production by rice genotypes. Pesquisa Agropecuaria Brasileira (Brazil), 32(4). |
| [8] | Awan, T. H., Ali, R. I., Manzoor, Z., Ahmad, M. and Akhtar, M., 2011. Effect of different nitrogen levels and row spacing on the performance of newly evolved medium grain rice variety, KSK-133. J. Anim. Plant Sci, 21(2), pp. 231-234. |
| [9] | Wu, L., Chen, X., Cui, Z., Wang, G. and Zhang, W., 2015. Improving nitrogen management via a regional management plan for Chinese rice production. Environmental Research Letters, 10(9), p. 095011. |
| [10] | Yuan, L. P., 2002. A scientist’s perspective on experience with SRI in China for raising the yields of super hybrid rice. In Assessments of the System of Rice Intensification (SRI): Proceedings of an international conference, Sanya, China (pp. 1-4). |
| [11] | Wang, S., Li, S., Liu, Q., Wu, K., Zhang, J., Wang, S., Wang, Y., Chen, X., Zhang, Y., Gao, C. and Wang, F., 2015. The OsSPL16-GW7 regulatory module determines grain shape and simultaneously improves rice yield and grain quality. Nature genetics, 47(8), pp. 949-954. |
| [12] | Ministry of Agriculture and Rural Development (MoARD), 2020. National Rice Development Strategy-II. Addis Ababa, Ethiopia. |
| [13] | Abdul R. Conteh, and Alie Kamara, 2020. “Improving the Efficiency of Fertilizer Utilization in Sierra Leone.”IOSR Journal of Agriculture and Veterinary Science (IOSR-JAVS), 13(6), pp. 45-56. |
| [14] | Ministry of Agriculture and forestry (MINAGRIF), 2024. Minaagrif. gov. ao portal official. |
| [15] | Meena, N. and Fathima, P. S., 2017. Nutrient Uptake of Rice as Influenced by Agronomic Biofortification of Zn and Fe under Methods of Rice Cultivation, Int. J. Pure App. Biosci. 5(5): 456-459. |
| [16] | Dobermann, A. R., 2005. Nitrogen use efficiency - state of the art. Agronomy & Horticulture Faculty Publications 316. |
| [17] | Frank, B., 1990. Adapted from agricultural compendium. FAO and Booker (MTs). |
| [18] | Olsen, S. R., C. V. Cole, F. S. Watanabe, and Dean, L. A., 1954. Estimation of available phosphorus in soils by extraction with sodium bicarbonate. USDA Circular 939. U. S. Government Printing Office, Washington D. C. |
| [19] | Metson, A. J., 1957. Methods of chemical analysis for soil survey samples. Soil Science, 83(3), p. 245. |
| [20] | Landon, J. R., 1991. Booker Tropical Soil Manual: a handbook for soil survey and agricultural land evaluation in the tropic and subtropic (eds). John Wiley & Sons Inc., New York, USA. 474p. |
| [21] | Akram HM, A Ali, MA Nadeem and MS Iqbal, 2007. Yield and yield components of rice varieties as affected by transplanting dates. Journal of Agricultural Research 45(2): 105–111. |
| [22] | Lu, J., De Datta, S. K., and Fillery, I. R. P. (1991). Nitrogen fertilizer management and its effect on rice growth and yield. International Rice Research Notes, 16(5), 24–26. |
| [23] | Dorar Tuoch, D. T., Amsalu Nebiyu, A. N. and Merkebu Getachew, M. G., 2016. Response of upland rice'Nerica-4'to rates of N and P fertilizers in south west Ethiopia. |
| [24] | Manzoor Z, Ali RI, Awan TH, Khalid N and Ahmad M., 2006. Appropriate time of nitrogen application to fine rice, Oryza sativa. Journal of Agriculture Research 44: 261-266. |
| [25] | Kim T-H and Kim S-M (2024) Effects of SPAD value variations according to nitrogen application levels on rice yield and its components. |
| [26] | Mahajan, G., Timsina, J., Jhanji, S., Sekhon, N. K. and Kuldeep-Singh, 2012. Cultivar response, dry-matter partitioning, and nitrogen-use efficiency in dry direct-seeded rice in northwest India. Journal of Crop Improvement, 26(6), pp. 767-790. |
| [27] | Shiferaw N, Heluf G, Sharma JJ and Tareke B., 2012. Effects of nitrogen and phosphorus fertilizer application on yield attributes, grain yield and quality of rain fed rice (Nerica-3) in Gambella, Southwest Ethiopia. East African Journal of Science 6: 91-104. |
| [28] | Dobermann A, Fairhurst T., 2000. Rice: Nutrient disorders and nutrient management. IRRI, Philippines, PPI USA and PPIC, Canada. |
| [29] | Shen, J., Yuan, L., Zhang, J., Li, H., Bai, Z., Chen, X., Zhang, W. and Zhang, F., 2011. Phosphorus dynamics: from soil to plant. Plant physiology, 156(3), pp. 997-1005. |
| [30] | Cassman, K. G., A. Dobermann, and D. T. Walters, 2002. Agroecosytems, nitrogen use efficiency, and nitrogen management. AMBIO: J. Human Environ. 3: 132-140. |
APA Style
Gurmu, S., Alfredo, A., Muctaru, M. M., Urayama, H., Sasaki, G. (2026). Nitrogen and Phosphorus Fertilizer Rates Influence on Growth and Yield of NERICA 4 Rice Variety in Upland Conditions at JICA Tsukuba Center Japan. American Journal of Plant Biology, 11(3), 120-135. https://doi.org/10.11648/j.ajpb.20261103.20
ACS Style
Gurmu, S.; Alfredo, A.; Muctaru, M. M.; Urayama, H.; Sasaki, G. Nitrogen and Phosphorus Fertilizer Rates Influence on Growth and Yield of NERICA 4 Rice Variety in Upland Conditions at JICA Tsukuba Center Japan. Am. J. Plant Biol. 2026, 11(3), 120-135. doi: 10.11648/j.ajpb.20261103.20
@article{10.11648/j.ajpb.20261103.20,
  author = {Sisay Gurmu and Ahave Alfredo and Massaquoi Mustapha Muctaru and Hisashi Urayama and Goichi Sasaki},
  title = {Nitrogen and Phosphorus Fertilizer Rates Influence on Growth and Yield of NERICA 4 Rice Variety in Upland Conditions at JICA Tsukuba Center Japan},
  journal = {American Journal of Plant Biology},
  volume = {11},
  number = {3},
  pages = {120-135},
  doi = {10.11648/j.ajpb.20261103.20},
  url = {https://doi.org/10.11648/j.ajpb.20261103.20},
  eprint = {https://article.sciencepublishinggroup.com/pdf/10.11648.j.ajpb.20261103.20},
  abstract = {The level of fertilizer application is among the factors prioritized for rice production constraints in Ethiopia, Sierra Leone, and Angola. Therefore, a field experiment was conducted to determine the influence of Nitrogen and Phosphorous fertilizer on growth, yield and yield components of NERICA 4 rice variety under upland condition at Tsukuba International Center, Japan during 2025 cropping season. The experiment involved factorial combinations of three rates of Nitrogen (0, 60 and 120 kg N ha-1) and three rates of Phosphorous (0, 50 and 100 kg P2O5 ha-1) laid out in 3×3 factorial arrangements in RCBD with three replications. Growth and yield of rice were significantly affected by nitrogen levels and the treatment difference, but not by phosphorus fertilizer levels. Due to the sufficient phosphorus in the experimental field, the application of high phosphorus did not have a significant effect. The significant highest grain yield (3.49 t ha-1), number of panicles per m2 (281.7), N uptake (103.8 kg ha-1) and P uptake (21.8 kg ha-1) were obtained from application of 120 kg N ha-1. Applying 60 kg N ha-1 and no phosphorus application produced the highest agronomic efficiency and statistically equivalent to the highest application of nitrogen (120 kg N ha-1) and phosphorus (100 kg P2O5 ha-1), making it an economical treatment. However, this one season and one location study must be reconfirmed in different seasons and over locations to make a sound conclusion.},
 year = {2026}
}
TY  - JOUR
T1  - Nitrogen and Phosphorus Fertilizer Rates Influence on Growth and Yield of NERICA 4 Rice Variety in Upland Conditions at JICA Tsukuba Center Japan
AU  - Sisay Gurmu
AU  - Ahave Alfredo
AU  - Massaquoi Mustapha Muctaru
AU  - Hisashi Urayama
AU  - Goichi Sasaki
Y1  - 2026/08/18
PY  - 2026
N1  - https://doi.org/10.11648/j.ajpb.20261103.20
DO  - 10.11648/j.ajpb.20261103.20
T2  - American Journal of Plant Biology
JF  - American Journal of Plant Biology
JO  - American Journal of Plant Biology
SP  - 120
EP  - 135
PB  - Science Publishing Group
SN  - 2578-8337
UR  - https://doi.org/10.11648/j.ajpb.20261103.20
AB  - The level of fertilizer application is among the factors prioritized for rice production constraints in Ethiopia, Sierra Leone, and Angola. Therefore, a field experiment was conducted to determine the influence of Nitrogen and Phosphorous fertilizer on growth, yield and yield components of NERICA 4 rice variety under upland condition at Tsukuba International Center, Japan during 2025 cropping season. The experiment involved factorial combinations of three rates of Nitrogen (0, 60 and 120 kg N ha-1) and three rates of Phosphorous (0, 50 and 100 kg P2O5 ha-1) laid out in 3×3 factorial arrangements in RCBD with three replications. Growth and yield of rice were significantly affected by nitrogen levels and the treatment difference, but not by phosphorus fertilizer levels. Due to the sufficient phosphorus in the experimental field, the application of high phosphorus did not have a significant effect. The significant highest grain yield (3.49 t ha-1), number of panicles per m2 (281.7), N uptake (103.8 kg ha-1) and P uptake (21.8 kg ha-1) were obtained from application of 120 kg N ha-1. Applying 60 kg N ha-1 and no phosphorus application produced the highest agronomic efficiency and statistically equivalent to the highest application of nitrogen (120 kg N ha-1) and phosphorus (100 kg P2O5 ha-1), making it an economical treatment. However, this one season and one location study must be reconfirmed in different seasons and over locations to make a sound conclusion.
VL  - 11
IS  - 3
ER  -
Agronomy Department, Ethiopia Institute of Agricultural Research, Addis Ababa, Ethiopia
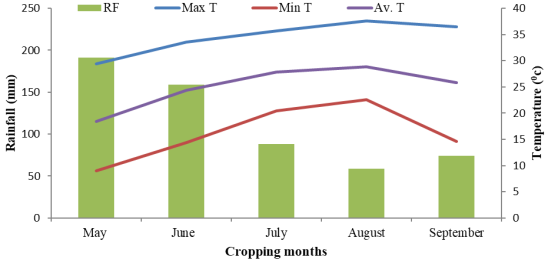
Figure 1. Maximum, average and minimum temperature and rainfall received at the experimental site during the period of cropping months in Tsukuba International Centre, Japan.
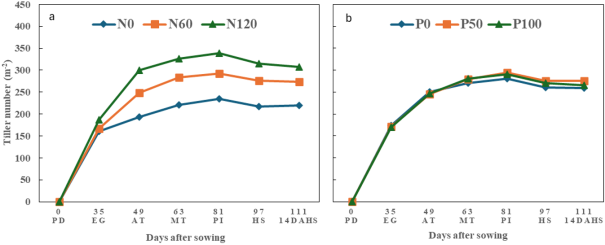
Figure 2. Nitrogen (a) and Phosphorous (b) fertilizer rates influence on the number of stems of rice throughout the growth period: Early Growth (EG), Active Tillering (AT), Maximum Tillering (MT), Panicle Initiation (PI), 50% Heading Stage (HS) and 14 days after 50% Heading Stage (14DAHS).
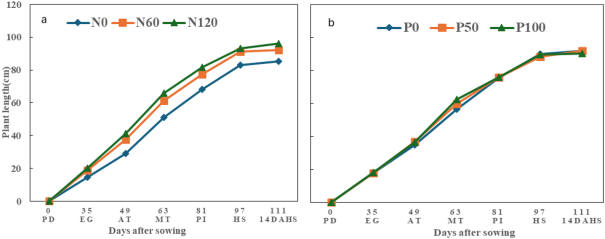
Figure 3. Nitrogen and Phosphorous fertilizer rates influence on the plant length throughout the growth period of rice: Early Growth (EG), Active Tillering (AT), Maximum Tillering (MT), Panicle Initiation (PI), 50% Heading Stage (HS) and 14 days after 50% Heading Stage (14DAHS).
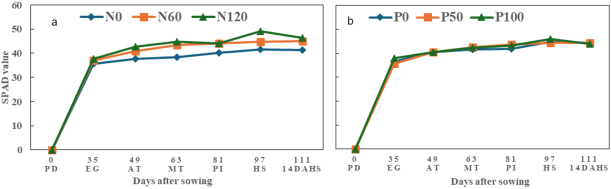
Figure 4. Nitrogen and Phosphorous fertilizer rates influence on the SPAD value throughout the growth period of rice: Early Growth (EG), Active Tillering (AT), Maximum Tillering (MT), Panicle Initiation (PI), 50% Heading Stage (HS) and 14 days after 50% Heading Stage (14DAHS).
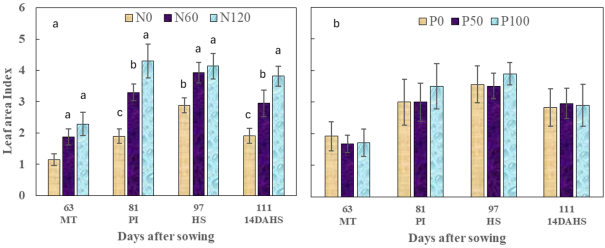
Figure 5. Nitrogen and Phosphorous fertilizer rates influence on the leaf area index throughout the growth period of rice: Maximum Tillering (MT), Panicle Initiation (PI), 50% Heading Stage (HS) and 14 days after 50% Heading Stage (14DAHS).
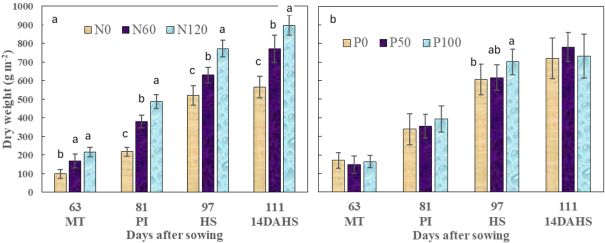
Figure 6. Influence of NP fertilizer rates on the shoot dry weight throughout the growth period of rice: Maximum Tillering (MT), Panicle Initiation (PI), 50% Heading Stage (HS) and 14 days after 50% Heading Stage (14DAHS).
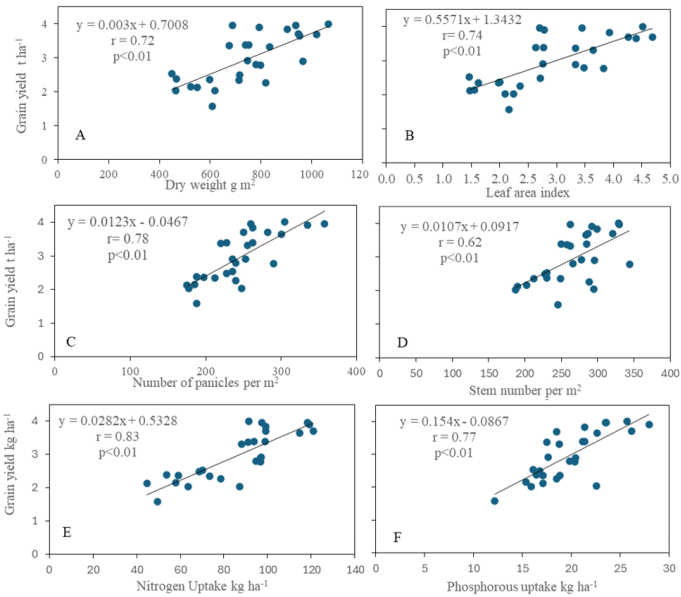
Figure 7. Relationships between grain yield and dry weight (A), leaf area index (B), number of panicles per m2 (C), stem number per m2 (D), nitrogen uptake (E) and phosphorous uptake (F).

Information



 Share This Article
 Twitter
 Linked In
 Facebook
 Copy
Copy Download