Bangladesh is among the nations most vulnerable to earthquakes worldwide. Being a developing country, it has been a challenging issue to ensure commercial prosperity along with safety against seismic hazards. Structural engineers also face difficulties in accurately designing buildings with maximum economy and efficiency. ETABS, a leading global engineering software with BNBC 2020 guidelines plays a vital role in these cases. In this study, analysis of a B+G+6 storied building for Symmetric & Asymmetric Plan configuration has been performed using ETABS software. Both kinds of structures have experienced a range of loads for example- dead loads, live loads, partition loads, wind loads, and seismic loads, as well as load combinations that have been pursued following BNBC 2020 requirements. The objective of this work is to evaluate the seismic impact resulting from varying seismic coefficients for four seismic zones in Bangladesh, given identical symmetric and asymmetric plan arrangements. Four required metrics were evaluated between the structural performances of symmetric and asymmetric structures: storey drift, overturning moment, storey shear, and storey stiffness. The structural software provided the analytical results and parameter computations. The comparison's result demonstrates that the asymmetric structure exhibits greater storey rigidity and less storey drift over the longer axis.
| Published in | American Journal of Science, Engineering and Technology (Volume 9, Issue 2) |
| DOI | 10.11648/j.ajset.20240902.13 |
| Page(s) | 60-95 |
| Creative Commons |
This is an Open Access article, distributed under the terms of the Creative Commons Attribution 4.0 International License (http://creativecommons.org/licenses/by/4.0/), which permits unrestricted use, distribution and reproduction in any medium or format, provided the original work is properly cited. |
| Copyright |
Copyright © The Author(s), 2024. Published by Science Publishing Group |
Symmetric & Asymmetric Plan, Commercial Building, Storey Drift, Overturning Moment, Storey Shear, Storey Stiffness, ETABS, BNBC 2020
1.1. Symmetric & Asymmetric Plan
1.2. Seismic Zones of Bangladesh
1.3. Statement of the Study
1.4. Objectives of the Study
1.5. Literature Review
2.1. Structural Model
2.2. Tables
Name | Type | Unit Weight, lb/ft2 | Modulus of Elasticity, lb/in2 | Grade |
|---|---|---|---|---|
Concrete 4000psi | Concrete | 150 | 3604996.53 | f’c=4000psi |
Rebar 60,000psi | Rebar | 490 | 29000000 | f’c=60000psi |
Name | Material | Section Shape |
|---|---|---|
Beam 2’x 1.5’ | Concrete 4000psi | Concrete Rectangular |
Column 2’x 2’ | Concrete 4000psi | Concrete Rectangular |
Column 2.5’x 2.5’ | Concrete 4000psi | Concrete Rectangular |
Stair Beam 1’x 1’ | Concrete 4000psi | Concrete Rectangular |
Name | Type | Element Type | Material | Thickness, in |
|---|---|---|---|---|
Shear Wall Lift 8” | Wall | Shell-thin | Concrete 4000psi | 8 |
Slab 8” | Slab | Membrane | Concrete 4000psi | 8 |
Underground Slab 10” | Slab | Membrane | Concrete 4000psi | 10 |
Waist Slab 8” | Slab | Membrane | Concrete 4000psi | 8 |
Zone | Zone Coefficient | Wind Speed (m/s) |
|---|---|---|
Zone-I (Rajshahi) | 0.12 | 49.2 |
Zone-II (Dhaka) | 0.20 | 65.7 |
Zone-III (Chittagong) | 0.28 | 80.0 |
Zone-IV (Kurigram) | 0.36 | 65.6 |
Load | Type | Self-weight Multiplier | Auto Load |
|---|---|---|---|
Dead | Dead | 1 | Self-weight |
Live | Live | 0 | --- |
Floor Finish | Super Dead | 0 | --- |
Parapet Wall | Super Dead | 0 | --- |
Partition Load | Dead | 0 | --- |
Eq X | Seismic | 0 | IS 1893:2016 |
Eq Y | Seismic | 0 | IS 1893:2016 |
Wind Load X | Wind | 0 | Indian IS 875:2015 |
Wind Load Y | Wind | 0 | Indian IS 875:2015 |
Sl. No. | Load Combination | Sl. No. | Load Combination |
|---|---|---|---|
1 | 1.4DL | 17 | 1.2DL +LL +0.3Ex - Ey |
2 | 1.2DL+1.6LL | 18 | 1.2DL +LL -0.3Ex + Ey |
3 | 1.2 DL+LL | 19 | 1.2DL +LL -0.3Ex - Ey |
4 | 1.2DL +0.8 Wx | 20 | 0.9 DL + Wx |
5 | 1.2DL +0.8 Wy | 21 | 0.9 DL + Wy |
6 | 1.2DL -0.8 Wx | 22 | 0.9 DL - Wx |
7 | 1.2DL -0.8 Wy | 23 | 0.9 DL - Wy |
8 | 1.2 DL +LL + 1.6 Wx | 24 | 0.823 DL + Ex + 0.3 Ey |
9 | 1.2 DL +LL + 1.6 Wy | 25 | 0.823 DL + Ex - 0.3 Ey |
10 | 1.2 DL +LL - 1.6 Wx | 26 | 0.823 DL - Ex + 0.3 Ey |
11 | 1.2 DL +LL - 1.6 Wy | 27 | 0.823 DL - Ex - 0.3 Ey |
12 | 1.2DL +LL + Ex + 0.3 Ey | 28 | 0.823 DL +0.3Ex + Ey |
13 | 1.2DL +LL + Ex - 0.3 Ey | 29 | 0.823 DL +0.3Ex - Ey |
14 | 1.2DL +LL - Ex + 0.3 Ey | 30 | 0.823 DL -0.3Ex + Ey |
15 | 1.2DL +LL - Ex - 0.3 Ey | 31 | 0.823 DL -0.3Ex - Ey |
16 | 1.2DL +LL +0.3Ex + Ey | * DL = DL' + FF + PW |
3.1. Seismic Zone-I (z=0.12)
3.1.1. Maximum Storey Drift Due to Seismic Load
3.1.2. Overturning Moment Due to Seismic Load
3.1.3. Storey Shear Due to Seismic Load
3.1.4. Storey Stiffness Due to Seismic Load
3.2. Seismic Zone-II (z=0.20)
3.2.1. Maximum Storey Drift Due to Seismic Load
3.2.2. Overturning Moment Due to Seismic Load
3.2.3. Storey Shear Due to Seismic Load
3.2.4. Storey Stiffness Due to Seismic Load
3.3. Seismic Zone-III (z=0.28)
3.3.1. Maximum Storey Drift Due to Seismic Load
3.3.2. Overturning Moment Due to Seismic Load
3.3.3. Storey Shear Due to Seismic Load
3.3.4. Storey Stiffness Due to Seismic Load
3.4. Seismic Zone-IV (z=0.36)
3.4.1. Maximum Storey Drift Due to Seismic Load
3.4.2. Overturning Moment Due to Seismic Load
3.4.3. Storey Shear Due to Seismic Load
3.4.4. Storey Stiffness Due to Seismic Load
3.5. Comparison Between ETABS & Manual Calculation
3.5.1. For Symmetric Plan
Horizontal Force Act on Floor Due to Seismic Action-Symmetrical | |||||
|---|---|---|---|---|---|
Story | Elevation (ft) | X-Dir-ETABS (kip) | Y-Dir-ETABS (kip) | X-Dir-EXCEL (kip) | Y-Dir-EXCEL (kip) |
Upper Roof | 91 | 32.71 | 33.70 | 57.92 | 56.99 |
Roof | 81 | 926.49 | 954.43 | 784.49 | 617.53 |
Story6 | 71 | 767.44 | 790.58 | 635.91 | 482.69 |
Story5 | 61 | 570.91 | 588.13 | 463.34 | 379.93 |
Story4 | 51 | 401.99 | 414.11 | 318.80 | 250.95 |
Story3 | 41 | 259.95 | 267.79 | 201.92 | 149.01 |
Story2 | 31 | 148.72 | 153.21 | 112.29 | 73.66 |
Story1 | 21 | 68.27 | 70.33 | 49.35 | 24.28 |
GF | 11 | 19.35 | 19.94 | 12.35 | 6.08 |
Underground | 1 | 0.59 | 0.61 | 0.47 | 0.19 |
3.5.2. For Asymmetric Plan
Horizontal Force Act on Floor Due to Seismic Action-Asymmetrical | |||||
|---|---|---|---|---|---|
Story | Elevation (ft) | X-Dir-ETABS (kip) | Y-Dir-ETABS (kip) | X-Dir-EXCEL (kip) | Y-Dir-EXCEL (kip) |
Upper Roof | 91 | 71.95 | 57.87 | 32.18 | 31.66 |
Roof | 81 | 534.47 | 429.85 | 435.83 | 343.07 |
Story6 | 71 | 462.25 | 371.76 | 353.28 | 268.16 |
Story5 | 61 | 341.34 | 274.52 | 257.41 | 211.07 |
Story4 | 51 | 238.60 | 191.89 | 177.11 | 139.42 |
Story3 | 41 | 154.20 | 124.02 | 112.18 | 82.79 |
Story2 | 31 | 88.18 | 70.92 | 62.38 | 40.92 |
Story1 | 21 | 40.48 | 32.56 | 27.41 | 13.49 |
GF | 11 | 11.31 | 9.10 | 6.86 | 3.38 |
Underground | 1 | 0.32 | 0.26 | 0.26 | 0.10 |
Story Data- Symmetrical Structure | |||||||
|---|---|---|---|---|---|---|---|
Story | Case | Shear X- Symmetrical | Drift X- Symmetrical | Stiff X- Symmetrical | Shear Y- Symmetrical | Drift Y- Symmetrical | Stiff Y- Symmetrical |
(kip) | (kip/in) | (kip) | (kip/in) | ||||
Upper Roof | Eq X | 10.903 | 0.00036 | 283.7037 | 0 | - | 0 |
Roof | Eq X | 319.733 | 0.000357 | 7241.6954 | 0 | - | 0 |
6th Floor | Eq X | 575.545 | 0.000543 | 9402.8999 | 0 | - | 0 |
5th Floor | Eq X | 765.849 | 0.000678 | 10545.9857 | 0 | - | 0 |
4th Floor | Eq X | 899.845 | 0.000782 | 11017.7181 | 0 | - | 0 |
3rd Floor | Eq X | 986.494 | 0.000838 | 11365.5951 | 0 | - | 0 |
2nd Floor | Eq X | 1036.067 | 0.00084 | 11956.0186 | 0 | - | 0 |
1st Floor | Eq X | 1058.822 | 0.00072 | 14675.5982 | 0 | - | 0 |
GF | Eq X | 1065.273 | 0.000371 | 26113.5454 | 0 | - | 0 |
Underground | Eq X | 1065.47 | 0.000031 | 3118623.621 | 0 | - | 0 |
Upper Roof | Eq Y | 0 | - | 0 | 11.232 | 0.000414 | 257.0164 |
Roof | Eq Y | 0 | - | 0 | 329.375 | 0.000423 | 6959.2916 |
6th Floor | Eq Y | 0 | - | 0 | 592.902 | 0.00061 | 9280.1365 |
5th Floor | Eq Y | 0 | - | 0 | 788.945 | 0.000757 | 10359.3911 |
4th Floor | Eq Y | 0 | - | 0 | 926.982 | 0.000863 | 10955.4339 |
3rd Floor | Eq Y | 0 | - | 0 | 1016.244 | 0.000916 | 11555.3489 |
2nd Floor | Eq Y | 0 | - | 0 | 1067.312 | 0.000898 | 12712.0519 |
1st Floor | Eq Y | 0 | - | 0 | 1090.754 | 0.000789 | 16668.4111 |
GF | Eq Y | 0 | - | 0 | 1097.4 | 0.000496 | 28514.5306 |
Underground | Eq Y | 0 | - | 0 | 1097.602 | 0.00004 | 3343496.276 |
Story Data-Asymmetrical Structure | |||||||
|---|---|---|---|---|---|---|---|
Story | Case | Shear X- Asymmetrical | Drift X- Asymmetrical | Stiff X- Asymmetrical | Shear Y- Asymmetrical | Drift Y- Asymmetrical | Stiff Y- Asymmetrical |
(kip) | (kip/in) | (kip) | (kip/in) | ||||
Upper Roof | Eq X | 42.766 | 0.000322 | 1043.3535 | 0 | - | 0 |
Roof | Eq X | 360.728 | 0.000317 | 8362.0607 | 0 | - | 0 |
Story6 | Eq X | 635.734 | 0.000461 | 10974.5249 | 0 | - | 0 |
Story5 | Eq X | 838.806 | 0.000586 | 12105.8438 | 0 | - | 0 |
Story4 | Eq X | 980.754 | 0.000675 | 12771.3469 | 0 | - | 0 |
Story3 | Eq X | 1072.485 | 0.000726 | 13388.8204 | 0 | - | 0 |
Story2 | Eq X | 1124.943 | 0.000733 | 14565.8617 | 0 | - | 0 |
Story1 | Eq X | 1149.025 | 0.000658 | 19336.835 | 0 | - | 0 |
GF | Eq X | 1155.75 | 0.000318 | 33465.9957 | 0 | - | 0 |
Underground | Eq X | 1155.941 | 0.00004 | 2665366.323 | 0 | - | 0 |
Upper Roof | Eq Y | 0 | - | 0 | 34.623 | 0.000256 | 1162.4255 |
Roof | Eq Y | 0 | - | 0 | 292.038 | 0.000415 | 7635.9501 |
Story6 | Eq Y | 0 | - | 0 | 514.678 | 0.000676 | 9151.027 |
Story5 | Eq Y | 0 | - | 0 | 679.081 | 0.000898 | 9477.5899 |
Story4 | Eq Y | 0 | - | 0 | 793.999 | 0.001058 | 9620.2314 |
Story3 | Eq Y | 0 | - | 0 | 868.263 | 0.001155 | 9824.6743 |
Story2 | Eq Y | 0 | - | 0 | 910.732 | 0.001174 | 10439.8795 |
Story1 | Eq Y | 0 | - | 0 | 930.228 | 0.001012 | 13274.3293 |
GF | Eq Y | 0 | - | 0 | 935.672 | 0.000451 | 26305.6606 |
Underground | Eq Y | 0 | - | 0 | 935.828 | 0.00005 | 2175045.588 |
Story Data - Symmetrical Structure | |||||||
|---|---|---|---|---|---|---|---|
Story | Case | Shear X- Symmetrical | Drift X- Symmetrical | Stiff X- Symmetrical | Shear Y- Symmetrical | Drift Y- Symmetrical | Stiff Y- Symmetrical |
(kip) | (kip/in) | (kip) | (kip/in) | ||||
Upper Roof | Eq X | 18.171 | 0.000601 | 283.7037 | 0 | - | 0 |
Roof | Eq X | 532.888 | 0.000596 | 7241.6954 | 0 | - | 0 |
6th Floor | Eq X | 959.241 | 0.000908 | 9402.8999 | 0 | - | 0 |
5th Floor | Eq X | 1276.415 | 0.001131 | 10545.9857 | 0 | - | 0 |
4th Floor | Eq X | 1499.742 | 0.001304 | 11017.7181 | 0 | - | 0 |
3rd Floor | Eq X | 1644.156 | 0.001398 | 11365.5951 | 0 | - | 0 |
2nd Floor | Eq X | 1726.778 | 0.001401 | 11956.0186 | 0 | - | 0 |
1st Floor | Eq X | 1764.704 | 0.001199 | 14675.5982 | 0 | - | 0 |
GF | Eq X | 1775.455 | 0.000616 | 26113.5454 | 0 | - | 0 |
Underground | Eq X | 1775.783 | 0.000052 | 3118623.621 | 0 | - | 0 |
Upper Roof | Eq Y | 0 | - | 0 | 18.719 | 0.000699 | 257.0164 |
Roof | Eq Y | 0 | - | 0 | 548.959 | 0.000711 | 6959.2916 |
6th Floor | Eq Y | 0 | - | 0 | 988.169 | 0.001024 | 9280.1365 |
5th Floor | Eq Y | 0 | - | 0 | 1314.909 | 0.001268 | 10359.3911 |
4th Floor | Eq Y | 0 | - | 0 | 1544.971 | 0.001445 | 10955.4339 |
3rd Floor | Eq Y | 0 | - | 0 | 1693.74 | 0.001532 | 11555.3489 |
2nd Floor | Eq Y | 0 | - | 0 | 1778.854 | 0.001502 | 12712.0519 |
1st Floor | Eq Y | 0 | - | 0 | 1817.924 | 0.001318 | 16668.4111 |
GF | Eq Y | 0 | - | 0 | 1828.999 | 0.000826 | 28514.5306 |
Underground | Eq Y | 0 | - | 0 | 1829.336 | 0.000067 | 3343496.276 |
Story Data -Asymmetrical Structure | |||||||
|---|---|---|---|---|---|---|---|
Story | Case | Shear X- Asymmetrical | Drift X- Asymmetrical | Stiff X- Asymmetrical | Shear Y- Asymmetrical | Drift Y- Asymmetrical | Stiff Y- Asymmetrical |
(kip) | (kip/in) | (kip) | (kip/in) | ||||
Upper Roof | Eq X | 71.277 | 0.00058 | 1043.3535 | 0 | - | 0 |
Roof | Eq X | 601.213 | 0.000541 | 8362.0607 | 0 | - | 0 |
Story6 | Eq X | 1059.557 | 0.000787 | 10974.5249 | 0 | - | 0 |
Story5 | Eq X | 1398.009 | 0.000994 | 12105.8438 | 0 | - | 0 |
Story4 | Eq X | 1634.59 | 0.00114 | 12771.3469 | 0 | - | 0 |
Story3 | Eq X | 1787.476 | 0.001223 | 13388.8204 | 0 | - | 0 |
Story2 | Eq X | 1874.905 | 0.001233 | 14565.8617 | 0 | - | 0 |
Story1 | Eq X | 1915.041 | 0.001103 | 19336.835 | 0 | - | 0 |
GF | Eq X | 1926.249 | 0.000531 | 33465.9957 | 0 | - | 0 |
Underground | Eq X | 1926.569 | 0.000066 | 2665366.323 | 0 | - | 0 |
Upper Roof | Eq Y | 0 | - | 0 | 57.705 | 0.000441 | 1162.4255 |
Roof | Eq Y | 0 | - | 0 | 486.73 | 0.00069 | 7635.9501 |
Story6 | Eq Y | 0 | - | 0 | 857.796 | 0.001124 | 9151.027 |
Story5 | Eq Y | 0 | - | 0 | 1131.801 | 0.001495 | 9477.5899 |
Story4 | Eq Y | 0 | - | 0 | 1323.332 | 0.001762 | 9620.2314 |
Story3 | Eq Y | 0 | - | 0 | 1447.105 | 0.001923 | 9824.6743 |
Story2 | Eq Y | 0 | - | 0 | 1517.887 | 0.001956 | 10439.8795 |
Story1 | Eq Y | 0 | - | 0 | 1550.38 | 0.001687 | 13274.3293 |
GF | Eq Y | 0 | - | 0 | 1559.454 | 0.000751 | 26305.6606 |
Underground | Eq Y | 0 | - | 0 | 1559.713 | 0.000084 | 2175045.588 |
Story Data - Symmetrical Structure | |||||||
|---|---|---|---|---|---|---|---|
Story | Case | Shear X- Symmetrical | Drift X- Symmetrical | Stiff X- Symmetrical | Shear Y- Symmetrical | Drift Y- Symmetrical | Stiff Y- Symmetrical |
(kip) | (kip/in) | (kip) | (kip/in) | ||||
Upper Roof | Eq X | 25.44 | 0.000842 | 283.7037 | 0 | - | 0 |
Roof | Eq X | 746.044 | 0.000835 | 7241.6954 | 0 | - | 0 |
6th Floor | Eq X | 1342.937 | 0.001272 | 9402.8999 | 0 | - | 0 |
5th Floor | Eq X | 1786.981 | 0.001585 | 10545.9857 | 0 | - | 0 |
4th Floor | Eq X | 2099.638 | 0.001827 | 11017.7181 | 0 | - | 0 |
3rd Floor | Eq X | 2301.819 | 0.001958 | 11365.5951 | 0 | - | 0 |
2nd Floor | Eq X | 2417.49 | 0.001962 | 11956.0186 | 0 | - | 0 |
1st Floor | Eq X | 2470.586 | 0.001678 | 14675.5982 | 0 | - | 0 |
GF | Eq X | 2485.638 | 0.000864 | 26113.5454 | 0 | - | 0 |
Underground | Eq X | 2486.096 | 0.000072 | 3118623.621 | 0 | - | 0 |
Upper Roof | Eq Y | 0 | - | 0 | 26.207 | 0.001018 | 257.0164 |
Roof | Eq Y | 0 | - | 0 | 768.542 | 0.001 | 6959.2916 |
6th Floor | Eq Y | 0 | - | 0 | 1383.437 | 0.001438 | 9280.1365 |
5th Floor | Eq Y | 0 | - | 0 | 1840.873 | 0.00178 | 10359.3911 |
4th Floor | Eq Y | 0 | - | 0 | 2162.959 | 0.002027 | 10955.4339 |
3rd Floor | Eq Y | 0 | - | 0 | 2371.236 | 0.002148 | 11555.3489 |
2nd Floor | Eq Y | 0 | - | 0 | 2490.396 | 0.002107 | 12712.0519 |
1st Floor | Eq Y | 0 | - | 0 | 2545.093 | 0.001847 | 16668.4111 |
GF | Eq Y | 0 | - | 0 | 2560.599 | 0.001155 | 28514.5306 |
Underground | Eq Y | 0 | - | 0 | 2561.071 | 0.000094 | 3343496.276 |
Story Data -Asymmetrical Structure | |||||||
|---|---|---|---|---|---|---|---|
Story | Case | Shear X- Asymmetrical | Drift X- Asymmetrical | Stiff X- Asymmetrical | Shear Y- Asymmetrical | Drift Y- Asymmetrical | Stiff Y- Asymmetrical |
(kip) | (kip/in) | (kip) | (kip/in) | ||||
Upper Roof | Eq X | 99.788 | 0.000838 | 1043.3535 | 0 | - | 0 |
Roof | Eq X | 841.698 | 0.000765 | 8362.0607 | 0 | - | 0 |
Story6 | Eq X | 1483.379 | 0.001112 | 10974.5249 | 0 | - | 0 |
Story5 | Eq X | 1957.213 | 0.001402 | 12105.8438 | 0 | - | 0 |
Story4 | Eq X | 2288.425 | 0.001605 | 12771.3469 | 0 | - | 0 |
Story3 | Eq X | 2502.466 | 0.00172 | 13388.8204 | 0 | - | 0 |
Story2 | Eq X | 2624.868 | 0.001732 | 14565.8617 | 0 | - | 0 |
Story1 | Eq X | 2681.058 | 0.001548 | 19336.835 | 0 | - | 0 |
GF | Eq X | 2696.749 | 0.000745 | 33465.9957 | 0 | - | 0 |
Underground | Eq X | 2697.196 | 0.000092 | 2665366.323 | 0 | - | 0 |
Upper Roof | Eq Y | 0 | - | 0 | 80.787 | 0.000626 | 1162.4255 |
Roof | Eq Y | 0 | - | 0 | 681.422 | 0.000964 | 7635.9501 |
Story6 | Eq Y | 0 | - | 0 | 1200.915 | 0.001572 | 9151.027 |
Story5 | Eq Y | 0 | - | 0 | 1584.522 | 0.002092 | 9477.5899 |
Story4 | Eq Y | 0 | - | 0 | 1852.665 | 0.002465 | 9620.2314 |
Story3 | Eq Y | 0 | - | 0 | 2025.948 | 0.002692 | 9824.6743 |
Story2 | Eq Y | 0 | - | 0 | 2125.042 | 0.002738 | 10439.8795 |
Story1 | Eq Y | 0 | - | 0 | 2170.532 | 0.002362 | 13274.3293 |
GF | Eq Y | 0 | - | 0 | 2183.236 | 0.001052 | 26305.6606 |
Underground | Eq Y | 0 | - | 0 | 2183.598 | 0.000117 | 2175045.588 |
Story Data - Symmetrical Structure | |||||||
|---|---|---|---|---|---|---|---|
Story | Case | Shear X- Symmetrical | Drift X- Symmetrical | Stiff X- Symmetrical | Shear Y- Symmetrical | Drift Y- Symmetrical | Stiff Y- Symmetrical |
(kip) | (kip/in) | (kip) | (kip/in) | ||||
Upper Roof | Eq X | 32.708 | 0.001084 | 283.7037 | 0 | - | 0 |
Roof | Eq X | 959.199 | 0.001074 | 7241.6954 | 0 | - | 0 |
6th Floor | Eq X | 1726.634 | 0.001636 | 9402.8999 | 0 | - | 0 |
5th Floor | Eq X | 2297.548 | 0.002039 | 10545.9857 | 0 | - | 0 |
4th Floor | Eq X | 2699.535 | 0.002349 | 11017.7181 | 0 | - | 0 |
3rd Floor | Eq X | 2959.481 | 0.002518 | 11365.5951 | 0 | - | 0 |
2nd Floor | Eq X | 3108.201 | 0.002523 | 11956.0186 | 0 | - | 0 |
1st Floor | Eq X | 3176.467 | 0.002157 | 14675.5982 | 0 | - | 0 |
GF | Eq X | 3195.82 | 0.001112 | 26113.5454 | 0 | - | 0 |
Underground | Eq X | 3196.409 | 0.000093 | 3118623.621 | 0 | - | 0 |
Upper Roof | Eq Y | 0 | - | 0 | 33.695 | 0.00127 | 257.0164 |
Roof | Eq Y | 0 | - | 0 | 988.126 | 0.001288 | 6959.2916 |
6th Floor | Eq Y | 0 | - | 0 | 1778.705 | 0.001852 | 9280.1365 |
5th Floor | Eq Y | 0 | - | 0 | 2366.836 | 0.002291 | 10359.3911 |
4th Floor | Eq Y | 0 | - | 0 | 2780.947 | 0.002609 | 10955.4339 |
3rd Floor | Eq Y | 0 | - | 0 | 3048.732 | 0.002765 | 11555.3489 |
2nd Floor | Eq Y | 0 | - | 0 | 3201.937 | 0.002711 | 12712.0519 |
1st Floor | Eq Y | 0 | - | 0 | 3272.262 | 0.002376 | 16668.4111 |
GF | Eq Y | 0 | - | 0 | 3292.199 | 0.001485 | 28514.5306 |
Underground | Eq Y | 0 | - | 0 | 3292.805 | 0.000121 | 3343496.276 |
Story Data -Asymmetrical Structure | |||||||
|---|---|---|---|---|---|---|---|
Story | Case | Shear X- Asymmetrical | Drift X- Asymmetrical | Stiff X- Asymmetrical | Shear Y- Asymmetrical | Drift Y- Asymmetrical | Stiff Y- Asymmetrical |
(kip) | (kip/in) | (kip) | (kip/in) | ||||
Upper Roof | Eq X | 128.299 | 0.001096 | 1043.3535 | 0 | - | 0 |
Roof | Eq X | 1082.183 | 0.000988 | 8362.0607 | 0 | - | 0 |
Story6 | Eq X | 1907.202 | 0.001438 | 10974.5249 | 0 | - | 0 |
Story5 | Eq X | 2516.417 | 0.00181 | 12105.8438 | 0 | - | 0 |
Story4 | Eq X | 2942.261 | 0.002071 | 12771.3469 | 0 | - | 0 |
Story3 | Eq X | 3217.456 | 0.002217 | 13388.8204 | 0 | - | 0 |
Story2 | Eq X | 3374.83 | 0.002231 | 14565.8617 | 0 | - | 0 |
Story1 | Eq X | 3447.074 | 0.001993 | 19336.835 | 0 | - | 0 |
GF | Eq X | 3467.249 | 0.000959 | 33465.9957 | 0 | - | 0 |
Underground | Eq X | 3467.824 | 0.000119 | 2665366.323 | 0 | - | 0 |
Upper Roof | Eq Y | 0 | - | 0 | 103.869 | 0.000811 | 1162.4255 |
Roof | Eq Y | 0 | - | 0 | 876.114 | 0.001238 | 7635.9501 |
Story6 | Eq Y | 0 | - | 0 | 1544.034 | 0.002021 | 9151.027 |
Story5 | Eq Y | 0 | - | 0 | 2037.242 | 0.002689 | 9477.5899 |
Story4 | Eq Y | 0 | - | 0 | 2381.997 | 0.003169 | 9620.2314 |
Story3 | Eq Y | 0 | - | 0 | 2604.79 | 0.00346 | 9824.6743 |
Story2 | Eq Y | 0 | - | 0 | 2732.197 | 0.00352 | 10439.8795 |
Story1 | Eq Y | 0 | - | 0 | 2790.684 | 0.003036 | 13274.3293 |
GF | Eq Y | 0 | - | 0 | 2807.017 | 0.001352 | 26305.6606 |
Underground | Eq Y | 0 | - | 0 | 2807.483 | 0.000151 | 2175045.588 |
Level | Elevation | Symmetric Structure; z=0.12 | Asymmetric Structure; z=0.12 | ||||||
|---|---|---|---|---|---|---|---|---|---|
Story Force/Shear (Vx) | Overturning Moment-X direction | Story Force/Shear (Vy) | Overturning Moment-Y direction | Story Force/Shear (Vx) | Overturning Moment-X direction | Story Force/Shear (Vy) | Overturning Moment-Y direction | ||
Underground | 1 | -1065.47 | 1065.47 | -1097.602 | 1097.602 | -1155.941 | 1155.941 | -935.828 | 935.828 |
GF | 11 | -1065.273 | 11718.003 | -1097.4 | 12071.4 | -1155.75 | 12713.25 | -935.672 | 10292.392 |
Story 1 | 21 | -1058.822 | 22235.262 | -1090.754 | 22905.834 | -1149.025 | 24129.525 | -930.228 | 19534.788 |
Story 2 | 31 | -1036.067 | 32118.077 | -1067.312 | 33086.672 | -1124.943 | 34873.233 | -910.732 | 28232.692 |
Story 3 | 41 | -986.494 | 40446.254 | -1016.244 | 41666.004 | -1072.485 | 43971.885 | -868.263 | 35598.783 |
Story 4 | 51 | -899.845 | 45892.095 | -926.982 | 47276.082 | -980.754 | 50018.454 | -793.999 | 40493.949 |
Story 5 | 61 | -765.849 | 46716.789 | -788.945 | 48125.645 | -838.806 | 51167.166 | -679.081 | 41423.941 |
Story 6 | 71 | -575.545 | 40863.695 | -592.902 | 42096.042 | -635.734 | 45137.114 | -514.678 | 36542.138 |
Roof | 81 | -319.733 | 25898.373 | -329.375 | 26679.375 | -360.728 | 29218.968 | -292.038 | 23655.078 |
Upper Roof | 91 | -10.903 | 992.173 | -11.232 | 1022.112 | -42.766 | 3891.706 | -34.623 | 3150.693 |
Level | Elevation | Symmetric Structure; z=0.20 | Asymmetric Structure; z=0.20 | ||||||
|---|---|---|---|---|---|---|---|---|---|
Story Force/Shear (Vx) | Overturning Moment-X direction | Story Force/Shear (Vy) | Overturning Moment-Y direction | Story Force/Shear (Vx) | Overturning Moment-X direction | Story Force/Shear (Vy) | Overturning Moment-Y direction | ||
Underground | 1 | -1775.783 | 1775.783 | -1829.336 | 1829.336 | -1926.569 | 1926.569 | -1559.713 | 1559.713 |
GF | 11 | -1775.455 | 19530.005 | -1828.999 | 20118.989 | -1926.249 | 21188.739 | -1559.454 | 17153.994 |
Story 1 | 21 | -1764.704 | 37058.784 | -1817.924 | 38176.404 | -1915.041 | 40215.861 | -1550.38 | 32557.98 |
Story 2 | 31 | -1726.778 | 53530.118 | -1778.854 | 55144.474 | -1874.905 | 58122.055 | -1517.887 | 47054.497 |
Story 3 | 41 | -1644.156 | 67410.396 | -1693.74 | 69443.34 | -1787.476 | 73286.516 | -1447.105 | 59331.305 |
Story 4 | 51 | -1499.742 | 76486.842 | -1544.971 | 78793.521 | -1634.59 | 83364.09 | -1323.332 | 67489.932 |
Story 5 | 61 | -1276.415 | 77861.315 | -1314.909 | 80209.449 | -1398.009 | 85278.549 | -1131.801 | 69039.861 |
Story 6 | 71 | -959.241 | 68106.111 | -988.169 | 70159.999 | -1059.557 | 75228.547 | -857.796 | 60903.516 |
Roof | 81 | -532.888 | 43163.928 | -548.959 | 44465.679 | -601.213 | 48698.253 | -486.73 | 39425.13 |
Upper Roof | 91 | -18.171 | 1653.561 | -18.719 | 1703.429 | -71.277 | 6486.207 | -57.705 | 5251.155 |
Level | Elevation | Symmetric Structure; z=0.28 | Asymmetric Structure; z=0.28 | ||||||
|---|---|---|---|---|---|---|---|---|---|
Story Force/Shear (Vx) | Overturning Moment-X direction | Story Force/Shear (Vy) | Overturning Moment-Y direction | Story Force/Shear (Vx) | Overturning Moment-X direction | Story Force/Shear (Vy) | Overturning Moment-Y direction | ||
Underground | 1 | -2486.096 | 2486.096 | -2561.071 | 2561.071 | -2697.196 | 2697.196 | -2183.598 | 2183.598 |
GF | 11 | -2485.638 | 27342.018 | -2560.599 | 28166.589 | -2696.749 | 29664.239 | -2183.236 | 24015.596 |
Story 1 | 21 | -2470.586 | 51882.306 | -2545.093 | 53446.953 | -2681.058 | 56302.218 | -2170.532 | 45581.172 |
Story 2 | 31 | -2417.49 | 74942.19 | -2490.396 | 77202.276 | -2624.868 | 81370.908 | -2125.042 | 65876.302 |
Story 3 | 41 | -2301.819 | 94374.579 | -2371.236 | 97220.676 | -2502.466 | 102601.10 | -2025.948 | 83063.868 |
Story 4 | 51 | -2099.638 | 107081.53 | -2162.959 | 110310.90 | -2288.425 | 116709.67 | -1852.665 | 94485.915 |
Story 5 | 61 | -1786.981 | 109005.84 | -1840.873 | 112293.25 | -1957.213 | 119389.99 | -1584.522 | 96655.842 |
Story 6 | 71 | -1342.937 | 95348.527 | -1383.437 | 98224.027 | -1483.379 | 105319.90 | -1200.915 | 85264.965 |
Roof | 81 | -746.044 | 60429.564 | -768.542 | 62251.902 | -841.698 | 68177.538 | -681.422 | 55195.182 |
Upper Roof | 91 | -25.44 | 2315.04 | -26.207 | 2384.837 | -99.788 | 9080.708 | -80.787 | 7351.617 |
Level | Elevation | Symmetric Structure; z=0.36 | Asymmetric Structure; z=0.36 | ||||||
|---|---|---|---|---|---|---|---|---|---|
Story Force/Shear (Vx) | Overturning Moment-X direction | Story Force/Shear (Vy) | Overturning Moment-Y direction | Story Force/Shear (Vx) | Overturning Moment-X direction | Story Force/Shear (Vy) | Overturning Moment-Y direction | ||
Underground | 1 | -3196.409 | 3196.409 | -3292.805 | 3292.805 | -3467.824 | 3467.824 | -2807.483 | 2807.483 |
GF | 11 | -3195.82 | 35154.02 | -3292.199 | 36214.189 | -3467.249 | 38139.739 | -2807.017 | 30877.187 |
Story 1 | 21 | -3176.467 | 66705.807 | -3272.262 | 68717.502 | -3447.074 | 72388.554 | -2790.684 | 58604.364 |
Story 2 | 31 | -3108.201 | 96354.231 | -3201.937 | 99260.047 | -3374.83 | 104619.73 | -2732.197 | 84698.107 |
Story 3 | 41 | -2959.481 | 121338.72 | -3048.732 | 124998.01 | -3217.456 | 131915.69 | -2604.79 | 106796.39 |
Story 4 | 51 | -2699.535 | 137676.28 | -2780.947 | 141828.29 | -2942.261 | 150055.31 | -2381.997 | 121481.84 |
Story 5 | 61 | -2297.548 | 140150.42 | -2366.836 | 144376.99 | -2516.417 | 153501.43 | -2037.242 | 124271.76 |
Story 6 | 71 | -1726.634 | 122591.01 | -1778.705 | 126288.05 | -1907.202 | 135411.34 | -1544.034 | 109626.41 |
Roof | 81 | -959.199 | 77695.119 | -988.126 | 80038.206 | -1082.183 | 87656.823 | -876.114 | 70965.234 |
Upper Roof | 91 | -32.708 | 2976.428 | -33.695 | 3066.245 | -128.299 | 11675.209 | -103.869 | 9452.079 |
| [1] | Munshi, Sarfaraj, and M. S. Bhandiwad. Seismic Analysis of Regular and Vertical Irregular RC Buildings, Bonfring International Journal of Man Machine Interface. 4 (2016). |
| [2] | Reddy, K. Harshavardhana, D. Mohammed Rafi, and C. Ramachandrudu. Comparative Study on The Analysis Results of Multi-Storeyed Commercial Building (G+ 12) by Using Staad. Pro and ETABS, (2019). |
| [3] | Md Rajibul Islam, Sudipta Chakraborty, and Dookie Kim. Effect of Plan Irregularity and Beam Discontinuity on Structural Performances of Buildings under Lateral Loadings, Architectural Research 24.2 (2022): 53-61. |
| [4] | N. Lingeshwaran, Satrasala Koushik, Tummuru Manish Kumar Reddy, and P. Preethi. Comparative analysis on asymmetrical and symmetrical structures subjected to seismic load, Materials Today: Proceedings, Volume 45, Part 7, (2021), pp: 6471-6475. |
| [5] | Abdoulhakim Souhaibou, Ling-zhi Li. A comparative study on the lateral displacement of a multi-story RC building under wind and earthquake load actions using base shear method and ETABS software, Materials Today: Proceedings, (2023). |
| [6] | Dhanapal Arunraj, Velchandran Sasirekha, Mullainathan Suganthi, Kumarasamy Vidhya K. Vidhya, Ramasamy Manirasu. Seismic analysis and design of high rise building by using ETABS in different seismic zones. AIP Conf. Proc, Volume 2782 (1): 020186, (15 June 2023). |
| [7] | S. Sivakumar, R. Shobana, E. Aarthy, S. Thenmozhi, V. Gowri, and B. Sarath Chandra Kumar. Seismic analysis of RC building (G+9) by response spectrum method, Materials Today: Proceedings, (2023). |
| [8] | Umer Bin Fayaz, Brahamjeet Singh. A Study of Seismic Analysis of Building Using ETABS, International Journal of Innovative Research in Engineering and Management (IJIREM), ISSN (Online): 2350-0557, Volume-10, Issue-6, (December 2023). |
| [9] |
Jose, Ragy, et al. Analysis and design of commercial building using ETABS, International Research Journal of Engineering and Technology 4 (2017), Volume: 04 Issue: 06, June-2017.
https://www.academia.edu/download/53811409/IRJET-V4I6114.pdf |
| [10] | Kim, JH., Hessek, C. J., Kim, Y. J. et al. Seismic analysis, design, and retrofit of built-environments: a procedural review of current practices and case studies. J Infrastruct Preserv Resil 3, 11 (2022). |
| [11] |
Shohag, JM Raisul Islam, and Kowshik Mozumder. Performance Assessment of Residential Building for Different Plan Configurations in Different Seismic Zones of Bangladesh Using ETABS, Journal of Civil, Construction and Environmental Engineering. Vol. 7, No. 5, 2022, pp. 93-101, November 4, (2022).
http://article.jccee.net/pdf/10.11648.j.jccee.20220705.12.pdf |
| [12] | Shanker, Battu Jaya Uma, G. Kiran Kumar, and R. Sai Kiran. Analysis and comparison of seismic behaviour of multi-storied RCC building with symmetric and asymmetric in plan, AIP Conference Proceedings. Vol. 2358. No. 1. AIP Publishing, (2021). |
| [13] |
Patil, Mahesh N., and Yogesh N. Sonawane. Seismic analysis of multistoried building, International Journal of Eng. and Innovative Technology 4.9 Volume 4, Issue 9 (2015): 123-130.
https://www.academia.edu/download/54151092/IJEIT1412201503_22.pdf |
APA Style
Rana, M. S., Kabir, S. F. B., Sami, S. T., Shahriar, M. M. (2024). Performance Assessment of Commercial Building for Symmetric and Asymmetric Plan Configurations in Different Seismic Zones of Bangladesh Using ETABS. American Journal of Science, Engineering and Technology, 9(2), 60-95. https://doi.org/10.11648/j.ajset.20240902.13
ACS Style
Rana, M. S.; Kabir, S. F. B.; Sami, S. T.; Shahriar, M. M. Performance Assessment of Commercial Building for Symmetric and Asymmetric Plan Configurations in Different Seismic Zones of Bangladesh Using ETABS. Am. J. Sci. Eng. Technol. 2024, 9(2), 60-95. doi: 10.11648/j.ajset.20240902.13
AMA Style
Rana MS, Kabir SFB, Sami ST, Shahriar MM. Performance Assessment of Commercial Building for Symmetric and Asymmetric Plan Configurations in Different Seismic Zones of Bangladesh Using ETABS. Am J Sci Eng Technol. 2024;9(2):60-95. doi: 10.11648/j.ajset.20240902.13
@article{10.11648/j.ajset.20240902.13,
  author = {Md. Sohel Rana and Syed Fardin Bin Kabir and Samiha Tabassum Sami and Md. Mahin Shahriar},
  title = {Performance Assessment of Commercial Building for Symmetric and Asymmetric Plan Configurations in Different Seismic Zones of Bangladesh Using ETABS
},
  journal = {American Journal of Science, Engineering and Technology},
  volume = {9},
  number = {2},
  pages = {60-95},
  doi = {10.11648/j.ajset.20240902.13},
  url = {https://doi.org/10.11648/j.ajset.20240902.13},
  eprint = {https://article.sciencepublishinggroup.com/pdf/10.11648.j.ajset.20240902.13},
  abstract = {Bangladesh is among the nations most vulnerable to earthquakes worldwide. Being a developing country, it has been a challenging issue to ensure commercial prosperity along with safety against seismic hazards. Structural engineers also face difficulties in accurately designing buildings with maximum economy and efficiency. ETABS, a leading global engineering software with BNBC 2020 guidelines plays a vital role in these cases. In this study, analysis of a B+G+6 storied building for Symmetric & Asymmetric Plan configuration has been performed using ETABS software. Both kinds of structures have experienced a range of loads for example- dead loads, live loads, partition loads, wind loads, and seismic loads, as well as load combinations that have been pursued following BNBC 2020 requirements. The objective of this work is to evaluate the seismic impact resulting from varying seismic coefficients for four seismic zones in Bangladesh, given identical symmetric and asymmetric plan arrangements. Four required metrics were evaluated between the structural performances of symmetric and asymmetric structures: storey drift, overturning moment, storey shear, and storey stiffness. The structural software provided the analytical results and parameter computations. The comparison's result demonstrates that the asymmetric structure exhibits greater storey rigidity and less storey drift over the longer axis.
},
 year = {2024}
}
TY  - JOUR
T1  - Performance Assessment of Commercial Building for Symmetric and Asymmetric Plan Configurations in Different Seismic Zones of Bangladesh Using ETABS

AU  - Md. Sohel Rana
AU  - Syed Fardin Bin Kabir
AU  - Samiha Tabassum Sami
AU  - Md. Mahin Shahriar
Y1  - 2024/04/28
PY  - 2024
N1  - https://doi.org/10.11648/j.ajset.20240902.13
DO  - 10.11648/j.ajset.20240902.13
T2  - American Journal of Science, Engineering and Technology
JF  - American Journal of Science, Engineering and Technology
JO  - American Journal of Science, Engineering and Technology
SP  - 60
EP  - 95
PB  - Science Publishing Group
SN  - 2578-8353
UR  - https://doi.org/10.11648/j.ajset.20240902.13
AB  - Bangladesh is among the nations most vulnerable to earthquakes worldwide. Being a developing country, it has been a challenging issue to ensure commercial prosperity along with safety against seismic hazards. Structural engineers also face difficulties in accurately designing buildings with maximum economy and efficiency. ETABS, a leading global engineering software with BNBC 2020 guidelines plays a vital role in these cases. In this study, analysis of a B+G+6 storied building for Symmetric & Asymmetric Plan configuration has been performed using ETABS software. Both kinds of structures have experienced a range of loads for example- dead loads, live loads, partition loads, wind loads, and seismic loads, as well as load combinations that have been pursued following BNBC 2020 requirements. The objective of this work is to evaluate the seismic impact resulting from varying seismic coefficients for four seismic zones in Bangladesh, given identical symmetric and asymmetric plan arrangements. Four required metrics were evaluated between the structural performances of symmetric and asymmetric structures: storey drift, overturning moment, storey shear, and storey stiffness. The structural software provided the analytical results and parameter computations. The comparison's result demonstrates that the asymmetric structure exhibits greater storey rigidity and less storey drift over the longer axis.

VL  - 9
IS  - 2
ER  -
Department of Civil Engineering, Rajshahi University of Engineering and Technology, Rajshahi, Bangladesh
Biography: Md. Sohel Rana is currently working as a lecturer at Rajshahi University of Engineering & Technology, Department of Civil Engineering. He acquired his B.Sc. in Civil Engineering from Rajshahi University of Engineering & Technology in 2019 and currently doing Master’s in Civil Engineering from the same institution. He has published various research works and conference papers in recent years.
Research Fields: Performance-Based Design, Soil-Structure Interaction, Composite Structures.

Department of Civil Engineering, Rajshahi University of Engineering and Technology, Rajshahi, Bangladesh
Biography: Syed Fardin Bin Kabir has just completed undergraduate studies in Civil Engineering Department at Rajshahi University of Engineering & Technology. He will acquire his B.Sc. in Civil Engineering degree from Rajshahi University of Engineering & Technology in 2024.
Research Fields: Seismic Engineering and Retrofitting, Structural Forensics and Failure Analysis, Performance-Based Analysis, ETABS.

Department of Civil Engineering, Rajshahi University of Engineering and Technology, Rajshahi, Bangladesh
Biography: Samiha Tabassum Sami has just completed undergraduate studies in Civil Engineering Department at Rajshahi University of Engineering & Technology. He will acquire his B.Sc. in Civil Engineering degree from Rajshahi University of Engineering & Technology in 2024.
Research Fields: Earthquake Engineering, Performance-Based Analysis, Retrofitting

Department of Civil Engineering, Rajshahi University of Engineering and Technology, Rajshahi, Bangladesh
Biography: Md. Mahin Shahriar has just completed undergraduate studies in Civil Engineering Department at Rajshahi University of Engineering & Technology. He will acquire his B.Sc. in Civil Engineering degree from Rajshahi University of Engineering & Technology in 2024.
Research Fields: Earthquake Engineering, Performance-Based Design, ETABS.

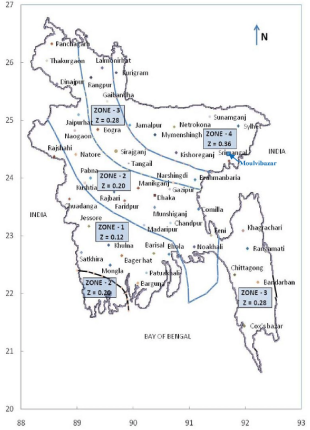
Figure 1. Seismic Zones (Four) in Bangladesh (www.researchgate.net, 2024).
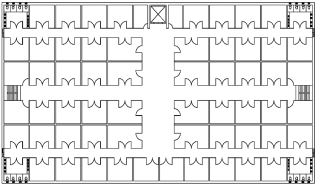
Figure 2. Symmetric Plan View.

Figure 3. Asymmetric Plan View.

Figure 4. Symmetric Plan View (ETABS).

Figure 5. Asymmetric Plan View (ETABS).
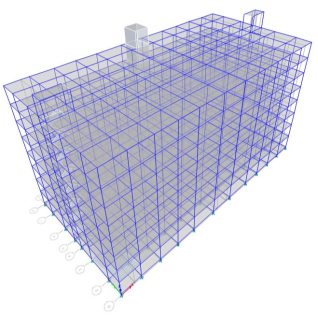
Figure 6. Symmetric Plan 3D View.
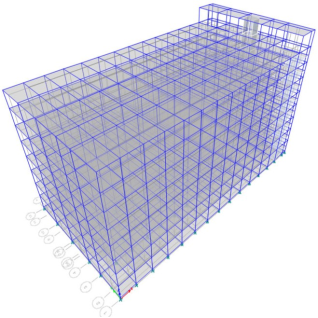
Figure 7. Asymmetric Plan 3D View.
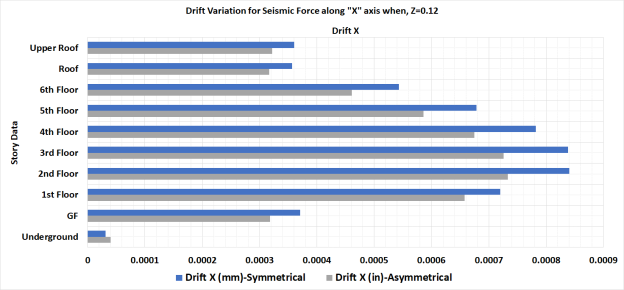
Figure 8. Variation in Storey Drift for Ex.
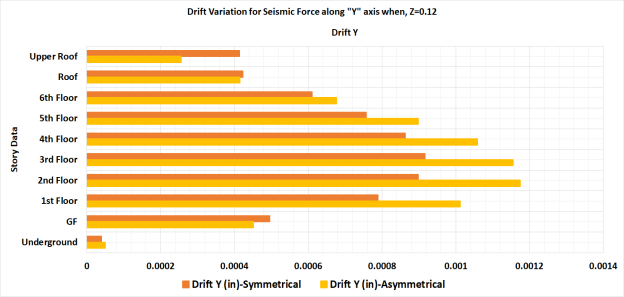
Figure 9. Variation in Storey Drift for Ey.

Figure 10. Variation in Overturning Moment with respect to Ex.
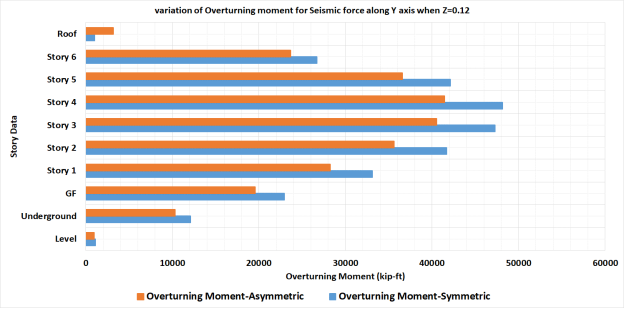
Figure 11. Variation in Overturning Moment with respect to Ey.
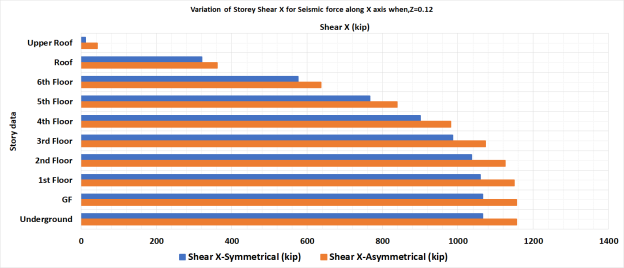
Figure 12. Variation in Storey Shear with respect to Ex.
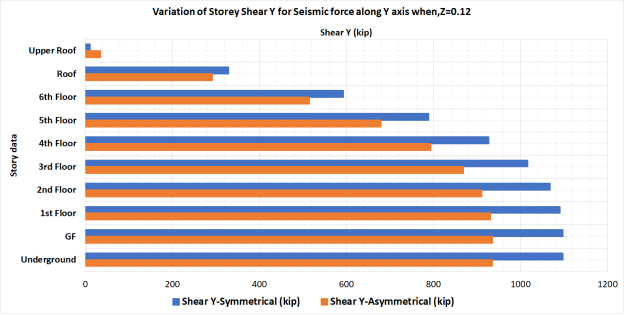
Figure 13. Variation in Storey Shear with respect to Ey.

Figure 14. Variation in Storey Stiffness with respect to Ex.

Figure 15. Variation in Storey Stiffness with respect to Ey.

Figure 16. Variation in Storey Drift with respect to Ex.

Figure 17. Variation in Storey Drift with respect to Ey.
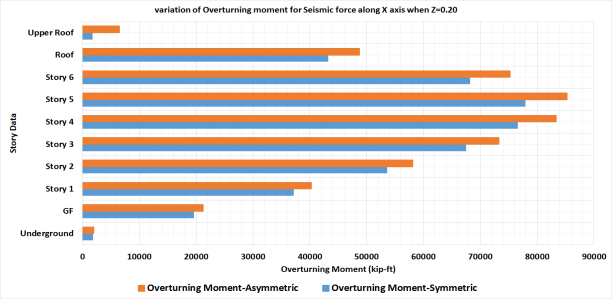
Figure 18. Variation in Overturning Moment with respect to Ex.
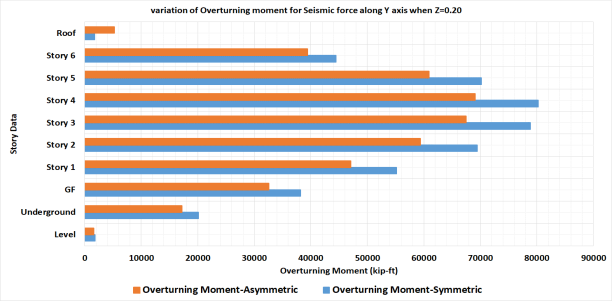
Figure 19. Variation in Overturning Moment with respect to Ey.
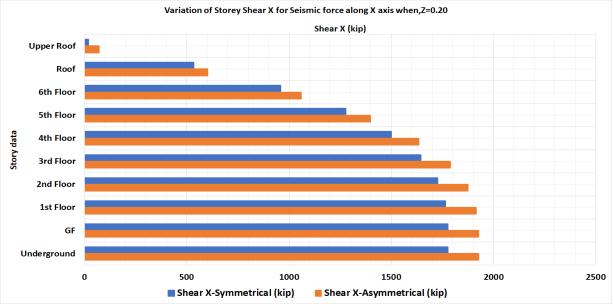
Figure 20. Variation in Storey Shear with respect to Ex.
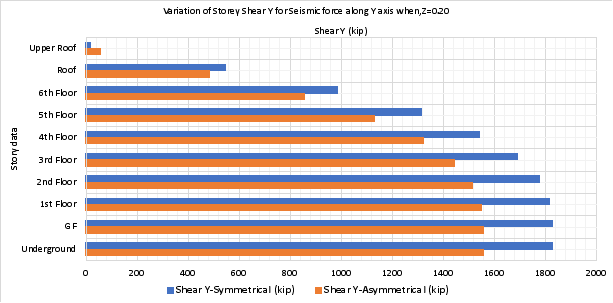
Figure 21. Variation in Storey Shear with respect to Ey.
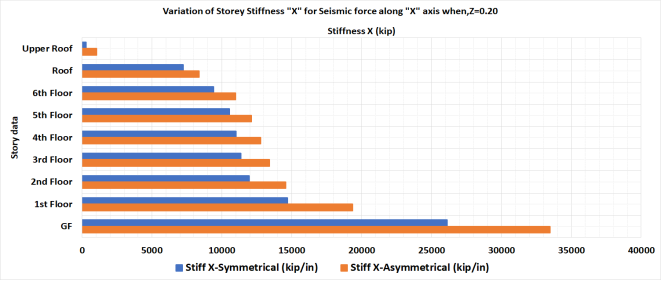
Figure 22. Variation in Storey Stiffness with respect to Ex.

Figure 23. Variation in Storey Stiffness with respect to Ey.
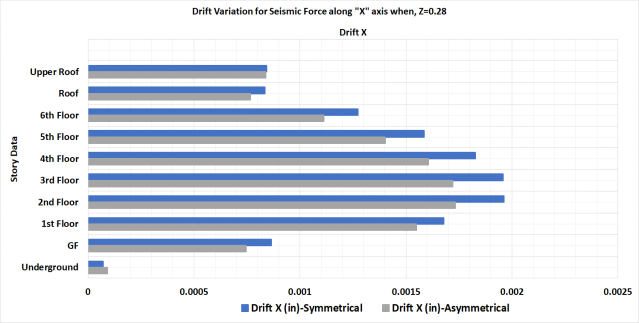
Figure 24. Variation in Storey Drift with respect to Ex.
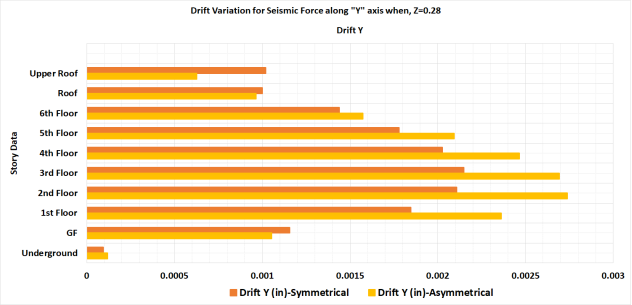
Figure 25. Variation in Storey Drift with respect to Ey.
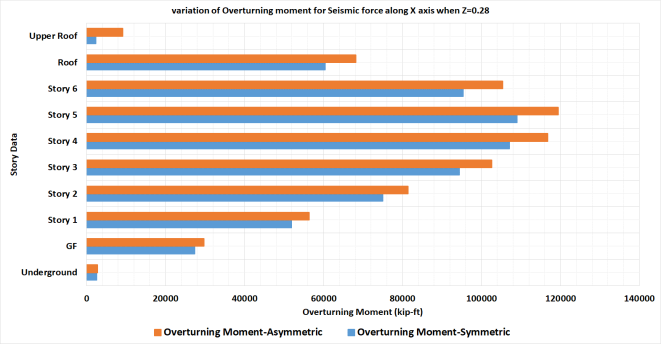
Figure 26. Variation in Overturning Moment with respect to Ex.
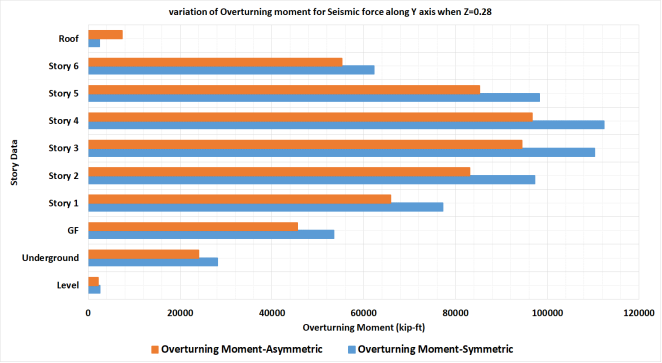
Figure 27. Variation in Overturning Moment with respect to Ey.

Figure 28. Variation in Storey Shear with respect to Ex.

Figure 29. Variation in Storey Shear with respect to Ey.

Figure 30. Variation in Storey Stiffness with respect to Ex.
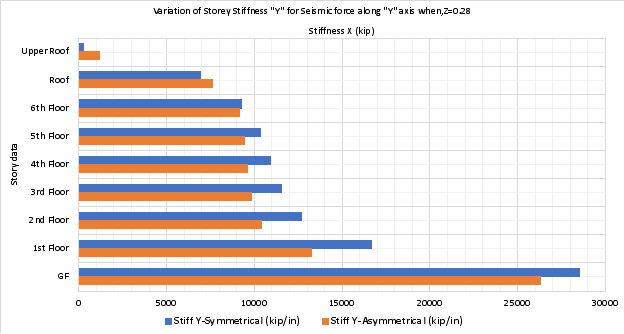
Figure 31. Variation in Storey Stiffness with respect to Ey.

Figure 32. Variation in Storey Drift with respect to Ex.

Figure 33. Variation in Storey Drift with respect to Ey.
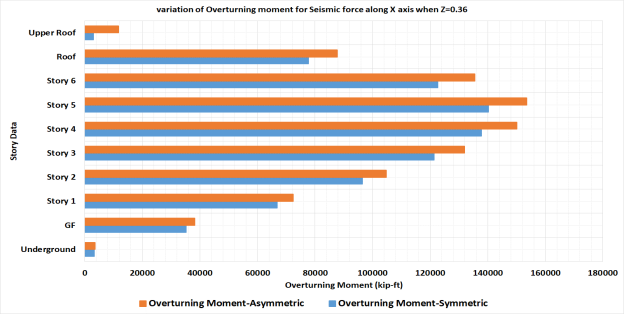
Figure 34. Variation in Overturning Moment with respect to Ex.
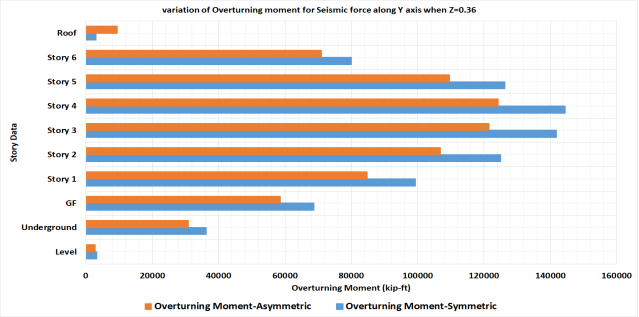
Figure 35. Variation in Overturning Moment with respect to Ey.
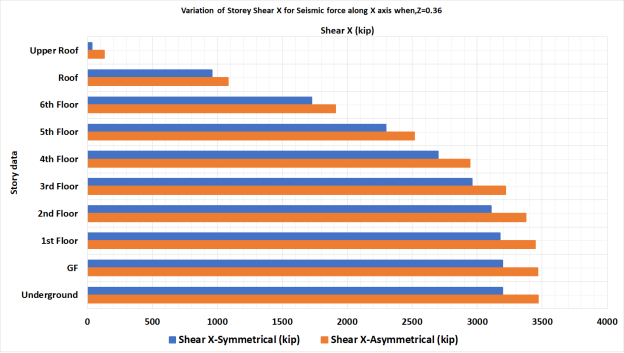
Figure 36. Variation in Storey Shear with respect to Ex.

Figure 37. Variation in Storey Shear with respect to Ey.
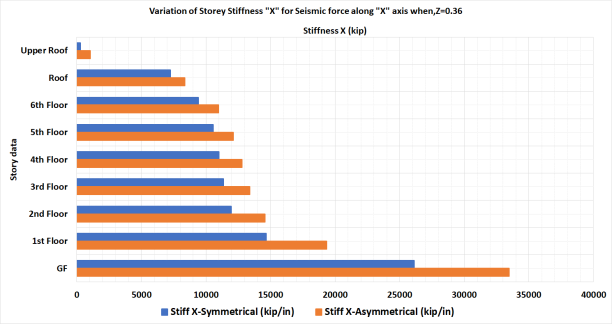
Figure 38. Variation in Storey Stiffness with respect to Ex.
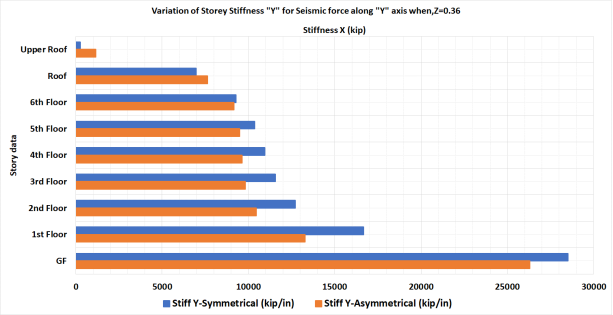
Figure 39. Variation in Storey Stiffness with respect to Ey.
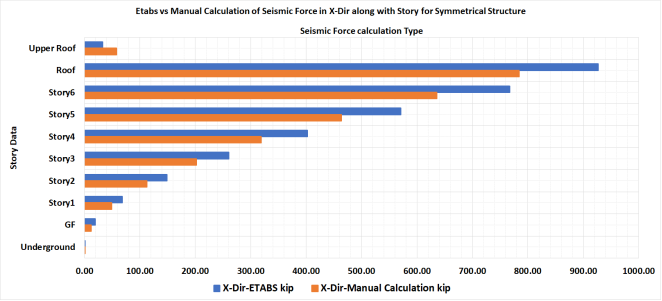
Figure 40. Variation in Ex with respect to Storey Height.

Figure 41. Variation in Ey with respect to Storey Height.

Figure 42. Variation in Ex with respect to Storey Height.
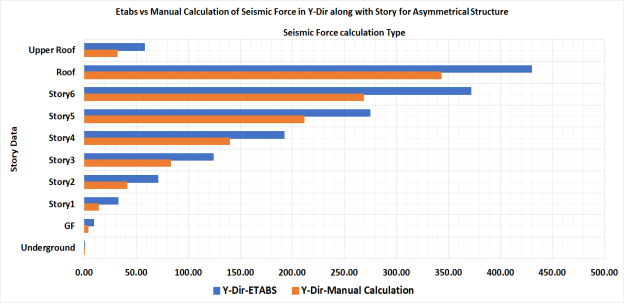
Figure 43. Variation in Ey with respect to Storey Height.
Information

