Abstract
Ground-contact time (GCT) is an important biomechanical parameter in sprint performance, reflecting the duration available for force application during stance. However, the reliability of GCT estimates derived from historical race footage depends on source timing accuracy and the identification of touchdown and toe-off events. This methodological commentary examines a provisional software-derived mean GCT of 90.67 ms from U.K. Shyam’s 2001 100 m performance, contextualized against published elite-sprint biomechanics data. The estimate remains independently unverified because source-level timing records and event annotations are unavailable for external audit. A conditional sensitivity analysis considers an assumed ±10 ms allowance (80.67-100.67 ms) and one-frame timing uncertainties at hypothetical source rates of 25, 50 and 100 frames/s. These scenarios demonstrate how temporal resolution may influence comparisons with published London 2017 GCT values of 90, 97 and 104 ms. Numerical overlap does not establish measurement equivalence or biomechanical similarity. The study provides a structured framework for interpreting provisional video-derived GCT estimates while emphasizing the importance of transparent uncertainty reporting and independent validation.
|
Published in
|
American Journal of Sports Science (Volume 14, Issue 4)
|
|
DOI
|
10.11648/j.ajss.20261404.12
|
|
Page(s)
|
63-69 |
|
Creative Commons
|

This is an Open Access article, distributed under the terms of the Creative Commons Attribution 4.0 International License (http://creativecommons.org/licenses/by/4.0/), which permits unrestricted use, distribution and reproduction in any medium or format, provided the original work is properly cited.
|
|
Copyright
|
Copyright © The Author(s), 2026. Published by Science Publishing Group
|
Keywords
100 M Sprint, Ground-contact Time, Performance Analysis, Video Estimation, Kinematics, Measurement Reliability
1. Introduction
Ground-contact time (GCT) is a key spatiotemporal parameter in sprint biomechanics, reflecting the duration available for force application during the stance phase. At higher running velocities, ground-contact durations generally decrease, placing greater demands on the athlete's ability to generate and transmit substantial ground reaction forces within a limited time. Consequently, GCT provides a useful indicator of sprint mechanics and may contribute to understanding differences in sprint performance when interpreted alongside ground reaction forces, step length, step frequency, and running velocity
| [5] | Hunter JP, Marshall RN, McNair PJ. Interaction of step length and step rate during sprint running. Med Sci Sports Exerc. 2004; 36(2): 261-271.
https://doi.org/10.1249/01.MSS.0000113664.15777.53 |
| [7] | Rabita G, Dorel S, Slawinski J, Sàez-de-Villarreal E, Couturier A, Samozino P, Morin JB. Sprint mechanics in world-class athletes: a new insight into the limits of human locomotion. Scand J Med Sci Sports. 2015; 25(5): 583-594.
https://doi.org/10.1111/sms.12389 |
| [10] | Weyand PG, Sternlight DB, Bellizzi MJ, Wright S. Faster top running speeds are achieved with greater ground forces not more rapid leg movements. J Appl Physiol. 2000; 89(5): 1991-1999. https://doi.org/10.1152/jappl.2000.89.5.1991 |
[5, 7, 10]
. However, shorter GCT alone does not necessarily indicate superior sprint performance, as propulsion depends on both the magnitude and direction of force application. Horizontal speed in the 100 m is the product of step length and step frequency. Step time is itself the sum of ground-contact time and flight time, so contact time is one of the few temporal variables a coach can point to when two athletes of similar stature produce different speeds. The attraction of the variable is mechanical as well as practical. Force can change the momentum of the center of mass only while the foot is on the ground. The impulse-momentum relation during stance is J = ∫ F(t) dt = Δp, where J is impulse, F(t) is the resultant ground-reaction force and Δp is the change in momentum. A shorter contact therefore requires a higher mean force if the same impulse is to be delivered
| [10] | Weyand PG, Sternlight DB, Bellizzi MJ, Wright S. Faster top running speeds are achieved with greater ground forces not more rapid leg movements. J Appl Physiol. 2000; 89(5): 1991-1999. https://doi.org/10.1152/jappl.2000.89.5.1991 |
[10]
.
That relation has been over-read. Weyand et al. (2000) showed that faster top speeds in human running come principally from greater mass-specific ground force, not from a large rise in step rate. Hunter et al. (2004) showed a negative interaction between step length and step rate: athletes who lengthen the step tend to reduce frequency, with vertical take-off velocity a principal source of the trade-off. Clark and Weyand (2014) showed that the fastest sprinters do not behave as symmetric springs
. They apply force asymmetrically through contact. A single contact-time value, taken out of phase and out of the force record, is not a ranking key.
Championship measurement makes the same point. At the London 2017 World Championships the mid-race contacts of the men’s 100 m medalists, averaged left to right over 47-55.5 m, were 0.090 s for Christian Coleman, 0.097 s for Usain Bolt and 0.104 s for Justin Gatlin
| [9] | World Athletics. Preliminary analysis of the men’s 100 m final, IAAF World Championships London 2017. 2017. |
[9]
. Gatlin won in 9.92 s with the longest of those three contacts. Bolt’s individual steps in that final have been described at 0.092 s and 0.104 s, consistent with the 0.097 s average (
| [1] | Bissas A, Walker J, Tucker C, Paradisis G, Merlino S. Biomechanical report for the IAAF World Championships London 2017: 100 m men’s. IAAF; 2018. |
| [9] | World Athletics. Preliminary analysis of the men’s 100 m final, IAAF World Championships London 2017. 2017. |
[1, 9]
). Drive-phase contacts are longer again. Rabita et al. (2015) reported stance times in elite acceleration that commonly exceed 0.14 s. Contact time is phase-specific, and a maximum-velocity value cannot be compared with a drive-phase value.
The Asian sub-10 s group is now large enough that regional performances are routinely set against it. Su Bingtian’s 9.83 s (+0.9 m/s) in the Tokyo 2021 Olympic semi-final is the Asian record
. Legal personal bests for the other men often named beside him include 9.95 s for Ryota Yamagata, 9.96 s for Abdul Hakim Sani Brown, 9.97 s for Xie Zhenye and 9.98 s for Yoshihide Kiryu
. These are race-time facts. They are not contact-time facts. Assigning each man an 80-89 ms band, and then ranking a historical athlete against that band, treats unpublished numbers as measurements.
U.K. Shyam is the historical reference in Singapore. On 27 August 2001, at the World University Games in Beijing, he ran 10.37 s and broke C. Kunalan’s national record of 10.38 s, set in 1968, by 0.01 s. He equaled 10.37 s at the Southeast Asian Games in Kuala Lumpur the following month, a run recorded as the individual silver medal (
). The mark stood until 30 September 2023, when Marc Brian Louis ran 10.27 s in the heats at the Hangzhou Asian Games
. A 90.67 ms maximum velocity contact has been proposed for the 2001 performance. No force platform, instrumented track or calibrated multi-camera array was in place at those races. The figure is a video estimate.
This methodological commentary asks whether a provisional archival estimate can be compared responsibly with independently published championship contact times. Its objective is to distinguish numerical overlaps from measurement equivalence, and to demonstrate how temporal sampling and event-boundary assumptions alter the apparent comparison; no validated new measurement or ranking is claimed.
2. Materials and Methods
2.1. Design
This is a methodological commentary and secondary critical appraisal of a single historical estimate, not a validated primary measurement study. Evidence is classified as (i) official race results, (ii) published instrumented/high-speed-video comparator measurements, (iii) internal software-output summaries and (iv) an archival estimate whose source-level timing and event boundaries are not publicly auditable. These categories are not pooled as equivalent observations.
2.2. Performance Record
Race results for Shyam were taken from contemporary reporting of the 2001 World University Games and the 2001 Southeast Asian Games, from the biography based on those competitions, and from the report of the 2023 national-record performance (
). Personal bests for the comparator athletes were taken from World Athletics athlete profiles (
, 2026b). Wind-legal marks only are used.
2.3. Comparator Kinematics
Mid-race contact and flight times were taken from the World Athletics preliminary analysis of the London 2017 men’s 100 m final
| [9] | World Athletics. Preliminary analysis of the men’s 100 m final, IAAF World Championships London 2017. 2017. |
[9]
. That analysis used high-speed cameras along the home straight to produce 10 m splits and a three-dimensional sample. Contact times in the published fast analysis are given for the medalists only, as left-right averages over 47-55.5 m. The full biomechanical report
| [1] | Bissas A, Walker J, Tucker C, Paradisis G, Merlino S. Biomechanical report for the IAAF World Championships London 2017: 100 m men’s. IAAF; 2018. |
[1]
describes the camera array, direct linear transformation and center-of-mass reconstruction, and presents contact, flight and step times for finalists during high-velocity running. Where the fast analysis does not print a contact for a non-medalist, no contact is assigned here. Split times in the same document are reported in seconds for each 10 m segment and are not converted to milliseconds.
2.4. Video Estimate
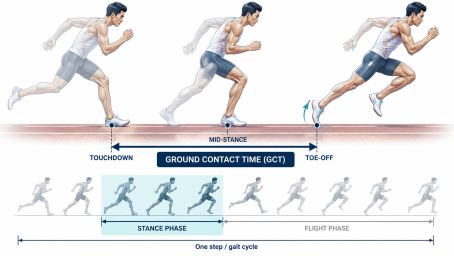
The provisional 90.67 ms software originated in software-assisted examination of historical broadcast footage during a visually identified high-velocity portion of the race; this portion has not been independently established as maximum velocity. The author retains the original video footage and software documentation. However, these source-level records are not publicly available due to intellectual property considerations and their association with ongoing research activities. Consequently, independent verification of the reported ground-contact-time estimate is not possible from the materials provided in this manuscript. The public record therefore lacks independently inspectable source-frame indices, verified native timestamps, a reproducible contact-event log, repeated independent annotations and criterion validation. Ground-contact time is defined operationally as the elapsed time from initial visible foot touchdown to final visible toe-off of that foot. With a single broadcast view, occlusion, perspective and image ambiguity may prevent either boundary from being identified precisely. The 90.67 ms value is therefore a provisional historical estimate, not a verified empirical measurement.
Figure 1. Schematic of the sprint step cycle showing touchdown, mid-stance, toe-off, and flight phase. Ground-contact time (GCT) is the interval between touchdown and toe-off.
No derived step time inferred flight time, GCT percentage, visually estimated knee-recovery angular velocity or internal propulsion score is used as independent evidential support: these exploratory quantities depend on provisional inputs or lack an externally validated operational protocol.
For uniformly sampled footage, event-based GCT is calculated as GCT = (N / f) × 1,000 ms, where N is the number of actual frame intervals between touchdown and toe-off and f is the verified sampling rate in frames per second. At 100 fps, one interval corresponds nominally to 10 ms; this arithmetic does not establish that the source footage was truly sampled at that rate. In this case, the exact touchdown and toe-off frame indices and native source timing have not been independently verified, so the 90.67 ms value remains a provisional estimate.
2.5. Uncertainty
The ±10 ms allowance was selected because one interval at a nominal 100 fps processing rate equals 10 ms; it is an illustrative discretization choice, not an empirically estimated standard error or confidence interval. The nominal output rate does not establish the source capture rate. With a provisional central value of 90.67 ms, allowing one interval of timing displacement produces conditional bands of 50.67-130.67 ms at 25 fps (40 ms/frame), 70.67-110.67 ms at 50 fps (20 ms/frame), and 80.67-100.67 ms at 100 fps (10 ms/frame). Allowing an independent one-frame displacement at both touchdown and toe-off expands the respective extreme-case bands to 12-172, 52-132 and 70.67-110.67 ms. These are deterministic thought experiments, not confidence intervals; the footage could contain duplicated or interpolated frames, and no probabilities are assigned.
2.6. Outcomes and Analysis
Outcomes are limited to verified race results, the provisional 90.67 ms software-output mean, and published London 2017 contact times. Numerical inclusion in a sensitivity interval is reported descriptively, without hypothesis tests or a claim of measurement equivalence. The London comparator contacts were obtained with documented high-speed measurement over approximately 47-55.5 m, unlike the unverified broadcast-derived Shyam estimate.
At 100 fps, the one-interval 80.67-100.67 ms scenario contains the published 90 and 97 ms values but excludes 104 ms. At 50 fps and 25 fps, the corresponding one-interval scenarios include all three. Even at 100 fps, independent one-frame ambiguity at both boundaries gives 70.67-110.67 ms and includes all three. Thus, the overlap classification changes under plausible, unverified timing assumptions; this is the methodological finding, not a biomechanical equivalence result.
Table 1. Deterministic source-framerate and boundary-ambiguity sensitivity scenarios (not confidence intervals).
Assumed source rate | Frame interval | One-interval band | Independent one-frame ambiguity at each boundary |
25 fps | 40 ms | 50.67-130.67 ms | 10.67-170.67 ms |
50 fps | 20 ms | 70.67-110.67 ms | 50.67-130.67 ms |
100 fps | 10 ms | 80.67-100.67 ms | 70.67-110.67 ms |
3. Results
Official-record cross-check: World Athletics athlete profiles document Shyam’s 10.37 s performances and Marc Brian Louis’s 10.27 s performance; the Singapore National Olympic Council SEA Games medal database lists U.K. Shyam as the 2001 men’s 100 m silver medallist. These performance records are separate from any ground-contact-time inference.
3.1. Race Performance
Shyam’s legal personal best is 10.37 s, set in Beijing on 27 August 2001 and equaled in Kuala Lumpur in September 2001
. The Kuala Lumpur run was the Southeast Asian Games silver medal
| [6] | Khoo K. Running on Empty: The Story Behind 0.01s. Ethos Books; 2018. |
[6]
. Relay medals at the Southeast Asian Games were bronze in 1997, silver in 2003 and bronze in 2005
| [6] | Khoo K. Running on Empty: The Story Behind 0.01s. Ethos Books; 2018. |
[6]
. The national record stood for 22 years and was broken by 0.10 s in Hangzhou
.
Table 2 places that record against the legal personal bests of the Asian men usually named in the same conversation. The table ranks race time only.
Table 2. Legal 100 m personal bests. Race time only; not a contact-time rank.
Athlete | Country | Legal PB (s) | Performance used | Contact published? |
Su Bingtian | China | 9.83 | Tokyo 2021 Olympic semi-final, +0.9 m/s | No |
Ryota Yamagata | Japan | 9.95 | Legal personal best | No |
Abdul Hakim Sani Brown | Japan | 9.96 | 4 August 2024 | No |
Xie Zhenye | China | 9.97 | Legal personal best | No |
Yoshihide Kiryu | Japan | 9.98 | Legal personal best | No |
U.K. Shyam | Singapore | 10.37 | Beijing, 27 August 2001; equaled Kuala Lumpur 2001 | Estimate only |
3.2. The Contact Estimate
The software analysis yielded a provisional mean candidate ground-contact duration of 90.67 ms. However, the underlying event-level timing data and touchdown-to-toe-off boundaries have not been independently validated. Accordingly, the reported mean is treated as an exploratory software-derived estimate rather than a validated biomechanical measurement. Furthermore, the visually selected high-velocity segment was not independently verified as representing the maximum-velocity phase of the sprint.
3.3. Published Contacts
Table 3 gives the London 2017 mid-race values that can be cited without conversion. Coleman 0.090 s, Bolt 0.097 s and Gatlin 0.104 s span 14 ms inside one race, and the longest contact belongs to the winner
| [9] | World Athletics. Preliminary analysis of the men’s 100 m final, IAAF World Championships London 2017. 2017. |
[9]
. Simbine’s 0.84 s in the split table is the time for the 50-60 m segment (mean speed about 11.9 m/s), not a contact of 84 ms. Su Bingtian finished eighth in 10.27 s. The fast analysis does not print a mid-race contact for him, and none is assigned. The 10 m splits beside his name, 0.89-0.92 s, are segment times.
Table 3. London 2017 men’s 100 m final: mid-race contacts and the split that is not a contact.
Athlete | Place and time | Mid-race contact (s) | Mid-race flight (s) | Status of the figure |
Justin Gatlin | 1st, 9.92 | 0.104 | 0.113 | Left-right average, 47-55.5 m |
Christian Coleman | 2nd, 9.94 | 0.090 | 0.110 | Left-right average, 47-55.5 m |
Usain Bolt | 3rd, 9.95 | 0.097 | 0.137 | Left-right average, 47-55.5 m |
Akani Simbine | 5th, 10.01 | Not printed | Not printed | 0.84 s is the 50-60 m split |
Su Bingtian | 8th, 10.27 | Not printed | Not printed | 0.89-0.92 s are 10 m splits |
3.4. What Cannot Be Ranked
No published maximum-velocity contact, with phase and method stated, was located for Kiryu, Yamagata, Xie, Sani Brown or Su at the performance that produced the personal best in
Table 1. A downhill lane used in Kiryu’s training is a coaching note, not a contact measurement, and is not used.
Table 4 presents a descriptive comparison of Shyam’s provisional ground-contact-time (GCT) estimate with published elite sprint measurements. The detailed biomechanical report from the 2017 IAAF World Championships
| [18] | Bissas, A., Walker, J., Tucker, C., & Paradisis, G. (2018). Biomechanical report for the IAAF World Championships London 2017: 100 m men's. International Association of Athletics Federations (IAAF). |
[18]
provides two-leg mean contact times of 90 ms for Coleman and approximately 98 ms each for Bolt and Gatlin. Importantly, these values do not represent the athletes’ minimum or universally characteristic contact times. Earlier investigations reported a model-derived GCT of 91 ms for Bolt during the 2009 Berlin World Championships
| [17] | Taylor, M. J. D., & Beneke, R. (2012). Spring mass characteristics of the fastest men on Earth. International Journal of Sports Medicine, 33(8), 667-670. |
[17]
, while Čoh et al.
| [16] | Čoh, M., Hébert-Losier, K., Štuhec, S., Babić, V., & Supej, M. (2018). The kinematics of Usain Bolt’s maximal sprint velocity. Kinesiology, 50(2), 172-180. |
[16]
documented a mean GCT of 86 ms during Bolt’s maximum-velocity phase at the 2011 Zagreb World Challenge, comprising 88 ms for the right leg and 83 ms for the left leg.
These findings highlight variation across competitions, sprint phases, and measurement methodologies. Although Shyam’s provisional estimate of 90.67 ms and conditional sensitivity range of 80.67-100.67 ms numerically overlap several published elite values, such overlap does not establish biomechanical equivalence or comparative performance ranking. Differences in video acquisition, temporal calibration, race-phase identification, and measurement uncertainty preclude direct inferential comparison.
Table 4. Descriptive comparison of provisional and published sprint ground-contact times across different competitions, race phases, and measurement systems; numerical overlap does not establish biomechanical equivalence or ranking.
Athlete / Event Year | GCT | Phase | Measurement |
U.K. Shyam, 2001 | 90.67 ms | Maximum velocity, estimated | Upscaled broadcast, provisional |
Usain Bolt, 2009 | [17] | Taylor, M. J. D., & Beneke, R. (2012). Spring mass characteristics of the fastest men on Earth. International Journal of Sports Medicine, 33(8), 667-670. |
[17] | 91 ms | 60-80 m | Model-derived estimate |
Usain Bolt, 2011 | [16] | Čoh, M., Hébert-Losier, K., Štuhec, S., Babić, V., & Supej, M. (2018). The kinematics of Usain Bolt’s maximal sprint velocity. Kinesiology, 50(2), 172-180. |
[16] | 86 ms | 70-90 m | 300 Hz video, two-leg mean |
Christian Coleman, 2017 | [18] | Bissas, A., Walker, J., Tucker, C., & Paradisis, G. (2018). Biomechanical report for the IAAF World Championships London 2017: 100 m men's. International Association of Athletics Federations (IAAF). |
[18] | 90 ms | 47-55.5 m | High-speed video |
Usain Bolt, 2017 | [18] | Bissas, A., Walker, J., Tucker, C., & Paradisis, G. (2018). Biomechanical report for the IAAF World Championships London 2017: 100 m men's. International Association of Athletics Federations (IAAF). |
[18] | 98 ms | 47-55.5 m | High-speed video, two-leg mean |
Justin Gatlin, 2017 | [18] | Bissas, A., Walker, J., Tucker, C., & Paradisis, G. (2018). Biomechanical report for the IAAF World Championships London 2017: 100 m men's. International Association of Athletics Federations (IAAF). |
[18] | 98 ms | 47-55.5 m | High-speed video, two-leg mean |
4. Discussion
The principal contribution is a transparent evidential hierarchy and a deterministic framerate/event-boundary sensitivity demonstration. A provisional archival estimate cannot be treated as interchangeable with calibrated high-speed championship measurements simply because their numbers overlap. At 100 fps the original one-interval band contains two of three published London values, whereas other plausible timing assumptions include all three. The classification is therefore sensitive to undocumented provenance rather than establishing an elite biomechanical signature.
The London final is the clearest caution. Gatlin won a global championship with a mid-race contact of 0.104 s, 14 ms longer than Coleman’s, at the same maximum 10 m speed of 11.63 m/s
| [9] | World Athletics. Preliminary analysis of the men’s 100 m final, IAAF World Championships London 2017. 2017. |
[9]
. Bolt was slower in step frequency and longer in flight and still medaled. Weyand et al. (2000) would lead one to expect this. Force, its direction, and the length of the step can compensate for a contact that is not the shortest in the field. Clark and Weyand (2014) add that the shape of the force-time curve, not stance duration alone, distinguishes the fastest runners
. A hierarchy built only on contact time discards the variables the force literature says matter more.
The original capture rate, any frame interpolation, and source-level event indices remain unverified in the publicly auditable record. No inter-rater reliability, repeated annotation uncertainty, or criterion validity can be estimated from the disclosed materials. The retained original video and analytics cannot currently be distributed because of draft patent-related restrictions; their private existence does not resolve independent reproducibility. Modern sensor validation studies provide methodological context, not transferable error bounds for this historical broadcast footage
| [2] | Blauberger P, Horsch A, Lames M. Detection of ground contact times with inertial sensors in elite 100-m sprints under competitive field conditions. Sensors. 2021; 21(21): 7331.
https://doi.org/10.3390/s21217331 |
| [13] | Nicholson G, Parelkar P, Dinsdale AJ, Bissas A, Walker J. A comparison between common measurement systems for quantifying spatiotemporal variables during the early sprint acceleration phase. Int J Sports Sci Coach. 2025; 20(4): 1651-1660.
https://doi.org/10.1177/17479541251333937 |
| [14] | Mendicino M, Palha de Araújo dos Santos JM, Margheriti P, Zaffagnini S, Di Paolo S. Detection of foot contact using inertial measurement units in sports movements: a systematic review. Appl Sci. 2025; 15(18): 10250.
https://doi.org/10.3390/app151810250 |
| [15] | Friedl F, Menrad T, Edelmann-Nusser J. Deep learning 1D-CNN-based ground contact detection in sprint acceleration using inertial measurement units. Sensors. 2026; 26(1): 342.
https://doi.org/10.3390/s26010342 |
[2, 13-15]
.
Two further corrections follow for anyone using championship reports. First, segment times and contact times share a decimal appearance and nothing else. An athlete who runs 50-60 m in 0.84 s is fast. He has not thereby recorded an 84 ms contact. Second, flight time cannot be borrowed from a textbook range and subtracted from an assumed step time to “confirm” a contact. The London medalists already differ by 27 ms in mid-race flight
| [9] | World Athletics. Preliminary analysis of the men’s 100 m final, IAAF World Championships London 2017. 2017. |
[9]
. The subtraction used for Shyam assumes the quantity it needs to measure.
On race time the regional record is not in dispute. A 10.37 s legal mark, held for 22 years and equaled at a multi-sport game, is a performance fact (
). Setting that mark beside 9.83-9.98 s personal bests describe a gap of about four to five tenths. Explaining the gap requires splits, step length, step frequency and, only then, contact time measured in the same phase. Those splits were not available for the 2001 races. The gap should be left as a race-time gap.
5. Implications for Performance Analysis
Historical videos are worth analyzing, provided the analysis is not presented as a laboratory measurement when the source timing and event annotations cannot be audited. A reproducible archive study should preserve the original video file and metadata; verify the native frame rate and any frame-rate conversion; define touchdown and toe-off; record source-frame indices and timing basis; use independent annotations by at least two trained reviewers; quantify intra- and inter-rater agreement; and, where possible, validate event times against a synchronized high-speed or instrumented reference system. The report should distinguish directly observed, arithmetically derived, visually estimated and model-generated outputs. These records are not available for the present estimate. Comparison with another athlete should use a contact measured at a named phase and reported with a stated method.
6. Limitations
The defining limitation is that source-level footage, verified timing metadata, frame indices, event-boundary decisions and independent annotation are not available for public audit while patent-related materials remain confidential. The internal chart lacks documented independent criterion reference. The visually identified high-velocity portion cannot be certified as maximum velocity. London measurements were collected using different equipment and at a specified 47-55.5 m location; numerical overlap is not methodological equivalence. No reliability coefficient, confidence interval or validated uncertainty distribution is claimed.
7. Conclusion
This paper does not establish a validated 90.67 ms ground-contact time for U.K. Shyam or biomechanical equivalence to London 2017 finalists. It establishes instead that descriptive overlap of a provisional archival estimate with published elite contacts is unstable under plausible assumptions about source frame rate and touchdown/toe-off boundary ambiguity. The 80.67-100.67 ms interval is only a conditional sensitivity band. The software-reported mean is not independently validated. The methodological contribution is a framework that separates official performance records, published measured comparators, internal software summaries and non-auditable historical estimates. Independent verification remains necessary before making athlete-level contact-time claims.
8. Future Work
Future work should be disclosed when intellectual-property restrictions permit, source-video provenance and native presentation timestamps, explicit touchdown/toe-off frame indices, and a blind independent annotation log. Prospective recordings should use verified high-speed capture and synchronized criterion measurements to quantify inter-rater reliability, event-boundary error and measurement agreement. The present commentary has not validated an AI-assisted analysis pipeline.
Abbreviations
GCT | Ground Contact Time |
Fps | Frames Per Second |
SEA | Southeast Asia |
AI | Artificial Intelligence |
Author Contributions
Edgar Jeevan Danaraj: Conceptualization, Data curation, Formal Analysis, Investigation, Methodology, Software, Validation, Visualization, Writing – original draft, Writing – review & editing
Data Availability Statement
Published comparator data are available in the cited championship biomechanics reports. The original race footage and associated software and timing documentation are retained by the author but are not publicly available due to intellectual property considerations and their association with ongoing research activities. As the source-level timing records and independently verified touchdown and toe-off annotations are not provided, the software-reported mean ground-contact duration of 90.67 ms cannot be independently reproduced or validated from the information presented in this manuscript. Accordingly, this value is treated as a provisional estimate rather than a validated biomechanical measurement.
Conflicts of Interest
The author declares no conflicts of interest.
References
| [1] |
Bissas A, Walker J, Tucker C, Paradisis G, Merlino S. Biomechanical report for the IAAF World Championships London 2017: 100 m men’s. IAAF; 2018.
|
| [2] |
Blauberger P, Horsch A, Lames M. Detection of ground contact times with inertial sensors in elite 100-m sprints under competitive field conditions. Sensors. 2021; 21(21): 7331.
https://doi.org/10.3390/s21217331
|
| [3] |
Mohan M. Singapore sprinter Marc Brian Louis smashes UK Shyam’s 22-year 100m national record at Asian Games. Channel NewsAsia. 30 September 2023.
https://www.channelnewsasia.com/sport/marc-brian-louis-uk-shyam-100m-asian-games-national-record-3810986
|
| [4] |
Clark KP, Weyand PG. Are running speeds maximized with simple-spring stance mechanics? J Appl Physiol. 2014; 117(6): 604-615.
https://doi.org/10.1152/japplphysiol.00174.2014
|
| [5] |
Hunter JP, Marshall RN, McNair PJ. Interaction of step length and step rate during sprint running. Med Sci Sports Exerc. 2004; 36(2): 261-271.
https://doi.org/10.1249/01.MSS.0000113664.15777.53
|
| [6] |
Khoo K. Running on Empty: The Story Behind 0.01s. Ethos Books; 2018.
|
| [7] |
Rabita G, Dorel S, Slawinski J, Sàez-de-Villarreal E, Couturier A, Samozino P, Morin JB. Sprint mechanics in world-class athletes: a new insight into the limits of human locomotion. Scand J Med Sci Sports. 2015; 25(5): 583-594.
https://doi.org/10.1111/sms.12389
|
| [8] |
The Independent Singapore. Running on empty: The story behind 0.01s. 11 August 2017.
https://theindependent.sg/running-on-empty-the-story-behind-0-01s/
|
| [9] |
World Athletics. Preliminary analysis of the men’s 100 m final, IAAF World Championships London 2017. 2017.
|
| [10] |
Weyand PG, Sternlight DB, Bellizzi MJ, Wright S. Faster top running speeds are achieved with greater ground forces not more rapid leg movements. J Appl Physiol. 2000; 89(5): 1991-1999.
https://doi.org/10.1152/jappl.2000.89.5.1991
|
| [11] |
World Athletics. Bingtian Su: athlete profile and 100 m results. Accessed 27 October 2026.
https://worldathletics.org/athletes/_/14171509
|
| [12] |
World Athletics. Abdul Hakim Sani Brown: athlete profile and 100 m results. Accessed 27 October 2026.
https://worldathletics.org/athletes/-/14671546
|
| [13] |
Nicholson G, Parelkar P, Dinsdale AJ, Bissas A, Walker J. A comparison between common measurement systems for quantifying spatiotemporal variables during the early sprint acceleration phase. Int J Sports Sci Coach. 2025; 20(4): 1651-1660.
https://doi.org/10.1177/17479541251333937
|
| [14] |
Mendicino M, Palha de Araújo dos Santos JM, Margheriti P, Zaffagnini S, Di Paolo S. Detection of foot contact using inertial measurement units in sports movements: a systematic review. Appl Sci. 2025; 15(18): 10250.
https://doi.org/10.3390/app151810250
|
| [15] |
Friedl F, Menrad T, Edelmann-Nusser J. Deep learning 1D-CNN-based ground contact detection in sprint acceleration using inertial measurement units. Sensors. 2026; 26(1): 342.
https://doi.org/10.3390/s26010342
|
| [16] |
Čoh, M., Hébert-Losier, K., Štuhec, S., Babić, V., & Supej, M. (2018). The kinematics of Usain Bolt’s maximal sprint velocity. Kinesiology, 50(2), 172-180.
|
| [17] |
Taylor, M. J. D., & Beneke, R. (2012). Spring mass characteristics of the fastest men on Earth. International Journal of Sports Medicine, 33(8), 667-670.
|
| [18] |
Bissas, A., Walker, J., Tucker, C., & Paradisis, G. (2018). Biomechanical report for the IAAF World Championships London 2017: 100 m men's. International Association of Athletics Federations (IAAF).
|
Cite This Article
-
APA Style
Danaraj, E. J. (2026). Evidential Limits of a Provisional Video-derived
Ground-contact-time Estimate in U.K. Shyam’s 2001 100 M Performance: A Methodological Commentary. American Journal of Sports Science, 14(4), 63-69. https://doi.org/10.11648/j.ajss.20261404.12
 Copy
|
 Download
ACS Style
Danaraj, E. J. Evidential Limits of a Provisional Video-derived
Ground-contact-time Estimate in U.K. Shyam’s 2001 100 M Performance: A Methodological Commentary. Am. J. Sports Sci. 2026, 14(4), 63-69. doi: 10.11648/j.ajss.20261404.12
Copy
|
Download
AMA Style
Danaraj EJ. Evidential Limits of a Provisional Video-derived
Ground-contact-time Estimate in U.K. Shyam’s 2001 100 M Performance: A Methodological Commentary. Am J Sports Sci. 2026;14(4):63-69. doi: 10.11648/j.ajss.20261404.12
Copy
|
Download
-
@article{10.11648/j.ajss.20261404.12,
  author = {Edgar Jeevan Danaraj},
  title = {Evidential Limits of a Provisional Video-derived
Ground-contact-time Estimate in U.K. Shyam’s 2001 100 M Performance: A Methodological Commentary},
  journal = {American Journal of Sports Science},
  volume = {14},
  number = {4},
  pages = {63-69},
  doi = {10.11648/j.ajss.20261404.12},
  url = {https://doi.org/10.11648/j.ajss.20261404.12},
  eprint = {https://article.sciencepublishinggroup.com/pdf/10.11648.j.ajss.20261404.12},
  abstract = {Ground-contact time (GCT) is an important biomechanical parameter in sprint performance, reflecting the duration available for force application during stance. However, the reliability of GCT estimates derived from historical race footage depends on source timing accuracy and the identification of touchdown and toe-off events. This methodological commentary examines a provisional software-derived mean GCT of 90.67 ms from U.K. Shyam’s 2001 100 m performance, contextualized against published elite-sprint biomechanics data. The estimate remains independently unverified because source-level timing records and event annotations are unavailable for external audit. A conditional sensitivity analysis considers an assumed ±10 ms allowance (80.67-100.67 ms) and one-frame timing uncertainties at hypothetical source rates of 25, 50 and 100 frames/s. These scenarios demonstrate how temporal resolution may influence comparisons with published London 2017 GCT values of 90, 97 and 104 ms. Numerical overlap does not establish measurement equivalence or biomechanical similarity. The study provides a structured framework for interpreting provisional video-derived GCT estimates while emphasizing the importance of transparent uncertainty reporting and independent validation.},
 year = {2026}
}
Copy
|
Download
-
TY  - JOUR
T1  - Evidential Limits of a Provisional Video-derived
Ground-contact-time Estimate in U.K. Shyam’s 2001 100 M Performance: A Methodological Commentary
AU  - Edgar Jeevan Danaraj
Y1  - 2026/11/09
PY  - 2026
N1  - https://doi.org/10.11648/j.ajss.20261404.12
DO  - 10.11648/j.ajss.20261404.12
T2  - American Journal of Sports Science
JF  - American Journal of Sports Science
JO  - American Journal of Sports Science
SP  - 63
EP  - 69
PB  - Science Publishing Group
SN  - 2330-8540
UR  - https://doi.org/10.11648/j.ajss.20261404.12
AB  - Ground-contact time (GCT) is an important biomechanical parameter in sprint performance, reflecting the duration available for force application during stance. However, the reliability of GCT estimates derived from historical race footage depends on source timing accuracy and the identification of touchdown and toe-off events. This methodological commentary examines a provisional software-derived mean GCT of 90.67 ms from U.K. Shyam’s 2001 100 m performance, contextualized against published elite-sprint biomechanics data. The estimate remains independently unverified because source-level timing records and event annotations are unavailable for external audit. A conditional sensitivity analysis considers an assumed ±10 ms allowance (80.67-100.67 ms) and one-frame timing uncertainties at hypothetical source rates of 25, 50 and 100 frames/s. These scenarios demonstrate how temporal resolution may influence comparisons with published London 2017 GCT values of 90, 97 and 104 ms. Numerical overlap does not establish measurement equivalence or biomechanical similarity. The study provides a structured framework for interpreting provisional video-derived GCT estimates while emphasizing the importance of transparent uncertainty reporting and independent validation.
VL  - 14
IS  - 4
ER  -
Copy
|
Download





 Share This Article
 Twitter
 Linked In
 Facebook