Research Article | | Peer-Reviewed

Performance Evaluation of 50 kW AC-DC Converter Using Vienna Rectifier for EV Charging Applications

Received: 2 December 2025     Accepted: 24 December 2025     Published: 19 January 2026
Views:       Downloads:
Abstract

The rise in Electric Vehicle (EV) usage has significantly increased the need for high-power fast charging systems that must meet rigorous performance standards. This paper examines the performance of 50 kW grid-connected EV charger. The design of the charger utilizes a dual stage Vienna rectifier at the front end, combined with a bi-directional DC-DC stage, to achieve a high-power factor, minimize total harmonic distortion (THD), and maintain stable operation of the DC bus. Vienna rectifiers are commonly utilized in high-power electric vehicle chargers because of their excellent efficiency greater than 94% and nearly unity power factor. An analysis of 50 kW charger that employs a Vienna rectifier focuses on its output ripple, input signal distortion, and power input factor. Under standard operating conditions, the performance remains equable. However, once the battery charge status surpasses 80%, the notable decline in performance occurs. In this scenario, both ripple and THD increase, and the power factor strays from unity, potentially harming the battery State of Health (SOH) during constant-voltage charging. Based on research results, this paper quantified the implication of current ripple on conversion efficiency in Electric vehicle charger through experimental verification and the results communicate that the current ripples have important influence on EV chargers.

Published in Science Journal of Circuits, Systems and Signal Processing (Volume 13, Issue 1)
DOI 10.11648/j.cssp.20261301.11
Page(s) 1-13
Creative Commons

This is an Open Access article, distributed under the terms of the Creative Commons Attribution 4.0 International License (http://creativecommons.org/licenses/by/4.0/), which permits unrestricted use, distribution and reproduction in any medium or format, provided the original work is properly cited.

Copyright

Copyright © The Author(s), 2026. Published by Science Publishing Group

Keywords

Electric Vehicle, Vienna Rectifier, DC-DC Stage, Harmonic Distortion, Output Ripple, State of Health (SOH)

1. Introduction
The fast process of adopting electric vehicles (EV) will require the use of effective AC to DC conversion systems that will be needed to bridge the AC utility grid and DC battery storage. The classes of EV chargers are grouped as DC fast Chargers (known as Level 3), Level 1 and Level 2. On the economic side, they take advantage of the AC grid, minimizing infrastructure and operation expenses and enhancing the usage of energy. Therefore, the AC-DC EV charger offers a technologically developed, energy saving, cost effective solution to the contemporary electric mobility systems. Vienna rectifier is most commonly employed in AC electric vehicle chargers because they have high efficiency, low THD and reactive power compensation. Vienna rectifier is a boost type rectifier without galvanic isolation. Vienna rectifier in basic form is unidirectional in nature which works on pulse width modulation . These characteristics render it’s very applicable in high power density/high performance EV charging. Even though if a specific topology is selected and used, the output current of the charger is bound to contain low frequency ripple that is twice the input power supply frequency . The output DC current ripple directly knocks charging efficacy, battery existence and thermal conduct of an EV charger. An increased output ripple leads to variations in the DC link that are reflected in the input side as harmonic distortion and reducing the quality of power and power factor. When the current outputted contains larger ripple, the energy loss on each device increased exponentially, and dissipated as a heat. The devices would bear a greater electrical stress if the peak current is increased . Therefore, reducing the output current ripple can be used to not only improve charging efficiency and battery life, but also to improve input current THD to achieve stable and high performance EV charging operations. In electric vehicle power trains, power electronic subsystems are tasked with controlling energy distribution within the vehicle and managing the torque output of the electric motor. These systems are known to produce unwanted electrical noise on high voltage bus. The high frequency current oscillations or ripple can infiltrate the vehicle’s battery system. High frequency current ripple promotes faster degradation of EV battery cells, resulting in increased capacity loss, higher internal resistance growth and non-uniform ageing characteristics . Ripple is produced in an AC to DC EV charger based on a Vienna rectifier, primarily because of the switching of the semiconductor devices and pulsating character of the three phase AC input. There is variation in DC voltage and current with the periodic transfer of energy between input phases and output capacitor. Insufficient filtering in switching can further increase ripple, affecting charging performance and output voltage stability. In single-phase AC battery chargers, pulsating power at twice of the line frequency is delivered by the AC source resulting in second-harmonic ripple voltage on the DC-link if additional passive or active filter circuits are not used .
It’s important to castle the level of THD in electric vehicle chargers as acceptable to meet the requirements of the grid, as well as to maintain the integrity of the power, as recommended by the regulations such as IEEE 519 and IEC 61000-3-12. Such standards are established current limits on THD of 8% for systems of less than 16 A and 5% for systems more than 16 A. Therefore, sophisticated Vienna rectifiers are using digital control and Power Factor Correction (PFC) method to suppress the harmonics. DC-link voltage ripple induces fluctuation, that introduces harmonic distortion in the input current waveform. The primary challenge in stabilizing DC based charging infrastructure is the DC link voltage ripple, which arises from the imbalance between generation and demand. It may be more economical to raise or droop voltage deliberately during EV charging or ESS working, and ripple elimination is unnecessary if these ripples are under control . The sinusoidal ripple current variations alternately change output active power of the battery charger (BC), negatively affect AC side terminal current of the BC, and therefore cause a power quality problem .
The literary works discussed so far advisable that, there is considerable work done on performance furthermore the effects of output current ripple on EV chargers. The greater part of these works merely confides on the performance metric analysis to validate the electric vehicle charger, by examining process parameters such as conversion efficiency, charging time, etc.
Therefore, this paper presents a performance analysis of 50 kW electric vehicle charger with Vienna rectifier for charging usage. The benefactions on this paper are as follows:
1) Output analysis.
2) Efficiency analysis.
3) Output current ripple analysis.
4) Input current THD analysis.
The subsequent section of the paper is organized as follows: Section II discusses the system set up for experimental validation. Section III validates the output analysis. Section IV explains about the Output current ripple variations and Section V discusses about the THD analysis. These Sections discuss about the performance evaluation of the EV charger for different battery capacities and concludes the effects of it.
2. System Structure
The charging station is equipped with either a split or integrated charging system, featuring both high and low voltage power distribution. It includes large canopies and a bay layout, as well as communication systems. The Electric Vehicle (EV) charger testing is arranged in the controlled laboratory set up that has a three phase AC power supply. The system will be used to govern the performance, efficiency and power quality attributes in EV charger under different load and operation conditions. The below Figure 1 illustrates the block diagram of test set up of EV charger. As primary power source there is a 3-phase AC input (400 V, 50 Hz) that is rectified and transformed using a Vienna rectifier that controls the charging voltage and current to the EV battery emulator. The system will include surveillance devices (power analyzer, current and voltage probes, current and voltage sensors) that will be used to control important parameters (input current THD, DC output ripple, power factor and system efficiency).
Figure 1. Block diagram of Test set up of EV charger.
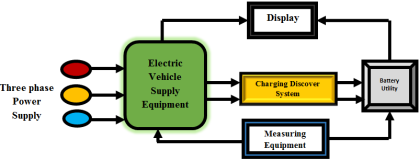
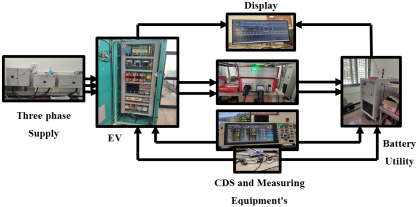
Figure 2. Experimental Set-up in laboratory for EVSE testing.
As shown in the Figure 2, the EVSE (Electric Vehicle Supply Equipment) test set up ensures that the performance of the electric vehicle charger can be closely evaluated under stable and changing conditions to ensure that the converter design, control procedures and compliance with the grid code requirements in IEE and IEC standards.
The EVSE testing system is created to assess the functioning of the chargers by means of measuring instruments and emulating devices. This system has a current sensor to measure the AC/DC current accurately and HIOKI 3390 power analyzer which records the voltage, current, power factor, THD and efficiency. Voltage probes are used in monitoring AC and DC voltage. The EVSE is communicated with the emulator through the charging gun by the Charging Discovery System (CDS) which ensure protocol compliance. The EVSE rectifies the three phase AC input and the DC output goes through the CDS to the emulator. This combined system allows to analyze the performance and response of the control in EV charger in the conditions of the real test. The EVSE and EV profile are formulated as per the requirements.
Table 1. Electric Vehicle charger Specifications.

Parameter

Value

Input Voltage

415±10% VAC

Output Voltage

200-1000 VDC

Max. Output Current DC

250 Amp

Max. Output Power

60 kW

Frequency

50 Hz

The above Table 1 specifies the EV charger input and output specifications. The Programmable Logic Communication and CAN communication serves as the communication mode between EV Charger and EV. A constant current-constant voltage (CC-CV) control technique is used as the charging scheme . The PLC communication in the EV charger illustrates the presence of input supply, error indicator, State of Charge (SOC) and it also includes RFID user authentication. These Chargers able to charge all electric vehicles of having CCS Type-2, CHAdeMO and GB/T charging standards. Along with the above technical specifications it also includes, that it should maintain the THD  5% and to maintain the power factor of value  0.99 (full load). The analysis is performed for the output voltage rating of 500 V and output current rating of 100 A at full load and the output power capacity of 50 kW.
3. Results of EV Charger Performance Parameters
3.1. Output Analysis of EV Charger
The Vienna rectifier based EV charger provides a regulated DC output from a three phase AC input. The output analysis aims at comparing the DC voltage stability under various load and battery conditions. The testing is conducted for the different Battery capacities. The Table 2 specifies the output parameters for the 5 kWh BC. The battery is starts charging from the 0% to 100% SOC. The variations are further mentioned below for 10 kWh, 25 kWh and 50 kWh Battery Capacities in Table 3 - 5 respectively. The DC output voltage, DC output current, output power and efficiency are noted as follows.
Table 2. Output Parameters for 5 kWh BC.

Battery Capacity (BC) = 5 kWh

Time (Minutes)

DC Output Voltage (V)

DC Output Current (A)

Output Power (kW)

Efficiency (%)

0

495.1

38.08

18.85

70.55

0.82

494.81

100.02

49.49

94.23

1.43

494.81

99.99

49.47

94.2

2

494.81

99.96

49.46

94.2

2.65

494.81

99.93

49.44

94.18

3.23

494.80

99.92

49.44

94.14

3.88

494.81

99.89

49.43

94.12

4.48

494.81

99.86

49.41

94.09

5.02

494.81

99.86

49.41

94.09

5.58

494.99

36.56

18.09

96.68

7.05

495.08

12.14

6.01

86.08

12.07

495.11

3.11

1.54

74.80

23.1

495.11

2.02

1

64.52

Table 3. Output Parameters for 10 kWh BC.

Battery Capacity (BC) = 10 kWh

Time (Minutes)

DC Output Voltage (V)

DC Output Current (A)

Output Power (kW)

Efficiency (%)

0

494.99

50.39

24.94

93.47

1.32

494.84

100.14

49.55

94.20

2.5

494.84

100.08

49.52

94.16

3.72

494.83

100.01

49.48

94.14

4.92

494.83

99.97

49.46

94.12

6.17

494.83

99.92

49.44

94.07

7.37

494.83

99.89

49.42

94.03

8.6

494.82

99.86

49.41

93.99

9.67

494.82

99.84

49.40

93.96

10.83

495.01

35.97

17.80

93.98

13.75

495.10

11.97

5.92

84.02

23.8

495.11

3.12

1.54

75.15

46.17

495.11

2.03

1

64.68

In the above Table 3 specifies the variation of parameters for 10 kWh Battery Capacity along with the efficiency changes across the different SOC. In the below Table 4 reflects output parameter analysis for 25 kWh Battery Capacity and the below Table 5 represents the output parameter analysis for the 50 kWh Battery Capacity. The graphical analysis are shown below accordingly and the charging SOC is consistently noted.
Table 4. Output Parameters for 25 kWh BC.

Battery Capacity (BC) = 25 kWh

Time (Minutes)

DC Output Voltage (V)

DC Output Current (A)

Output Power (kW)

Efficiency (%)

0

494.97

49.2

24.35

92.2

3.45

494.81

99.86

49.41

94.03

6.53

494.82

99.80

49.38

93.88

9.55

494.81

99.72

49.34

93.78

12.65

494.80

99.70

49.33

93.74

15.62

494.81

99.66

49.31

93.74

18.67

494.80

99.64

49.30

93.69

21.7

494.81

99.61

49.28

93.69

24.48

494.80

99.58

49.27

93.66

27.35

495

36.83

18.23

93.53

34.73

495.08

12.20

6.04

86.84

60.33

495.11

2.99

1.48

71.82

115.43

495.10

2.02

0.99

64.38

Table 5. Output Parameters for 50 kWh BC.

Battery Capacity (BC) = 50 kWh

Time (Minutes)

DC Output Voltage (V)

DC Output Current (A)

Output Power (kW)

Efficiency (%)

0

495.01

49.86

24.68

93.33

6.68

494.85

99.92

49.44

94.07

12.75

494.84

99.80

49.38

93.86

19.02

494.84

99.71

49.34

93.75

24.93

494.83

99.66

49.32

93.70

31.05

494.83

99.60

49.28

93.67

37.17

494.82

99.57

49.27

93.67

43.23

494.82

99.56

49.26

93.64

48.77

494.83

99.54

49.25

93.64

54.48

495.02

36.95

18.29

93.42

69.65

495.09

12.07

5.97

83.79

120.42

495.11

3.01

1.49

71.82

234.53

495.12

2.02

1

64.36

The plots are explaining the variations of the performance quantities. The below Figure 3 and 4 are describing the Output Parameters plot of 5 kWh and 10 kWh Battery Capacities. The Output Parameters plot of 25 kWh and 50 kWh are shown in below Figure 5 and Figure 6 respectively. The above plots are explicated that, the time taken for charging the different battery capacity is in increasing order. As shown in output parameter plots, the battery is charging in constant current mode till the battery reaches the 79% of its SOC. While it crosses 80% the voltage remains constant at its reference value, while the current and power gradually decreases, typically to around 2% of its reference value.
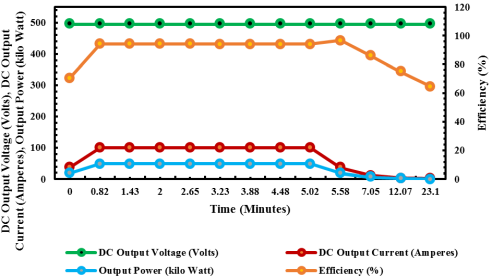
Figure 3. Output Parameters plot of 5 kWh BC.
Figure 4. Output Parameters plot of 10 kWh BC.
The charging time is noted for the marked SOC. As in the below Figure 7 indicates that Time plot for different Battery Capacities over different SOC from 0% to 99%, that the timespan to charge the battery of lower capacity of 5 kWh takes lesser time of 23.1 min when compare to the higher BC of 50 kWh takes 234.53 min (4 hours approx.).
Figure 5. Output Parameters plot of 25 kWh BC.
Figure 6. Output Parameters plot of 50 kWh BC.
Figure 7. Time Plot for different Battery Capacities.
3.2. Output Current Ripple Analysis of EV Charger
The current ripple implied to the AC component current superimposed on the DC stabilizing. The correlation of peak-peak output current and DC current was called as current ripple. Conventional techniques usually employ bulky electrolytic capacitors to reduce this low-frequency ripple, compromising the reliability of the converter because the life of electrolytic capacitors is very short and also increase cost and volume . The current from additional energy storage reaches high values, resulting in rapid battery charging at the expense of accelerated battery aging .
The DC current ripple is signified in expression as:
IRipple,DC= IPP,DC/2IDC* 100%(1)
Here, IPP,DC = (IMax, DC- IMin, DC) The difference between the maximum and minimum value of the DC output current.
IDC = the average value of DC output current.
The above equation (1) represents the expression for the output DC current ripple in percentage. The peak-to-peak DC current value is calculated from the difference of the peak and valley value of the output current.
Table 6. Output DC Current Ripple for 5 kWh BC.

5 kWh BC

SOC (%)

0

10

20

30

40

50

60

70

79

85

90

95

99

IRipple,DC(%)

34.89

0.85

0.87

0.84

0.93

0.86

0.79

0.88

0.84

3.47

3.79

7.40

8.91

Efficiency (%)

70.55

94.23

94.20

94.20

94.18

94.14

94.12

94.09

94.09

96.68

86.08

74.80

64.52

Table 7. Output DC Current Ripple for 10 kWh BC.

10 kWh BC

SOC (%)

0

10

20

30

40

50

60

70

79

85

90

95

99

IRipple,DC(%)

1.27

0.93

0.89

0.93

0.91

0.85

0.81

0.75

0.73

2.46

5.14

6.57

8.87

Efficiency (%)

93.47

94.20

94.16

94.14

94.12

94.07

94.03

93.99

93.96

93.98

84.02

75.15

64.68

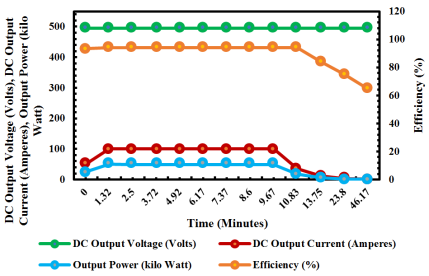
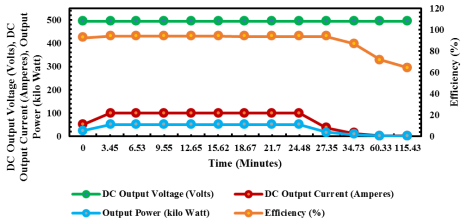
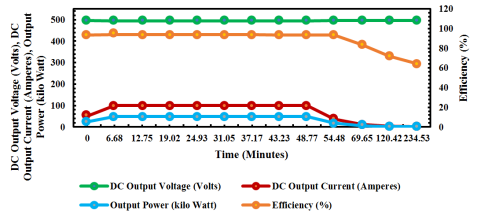
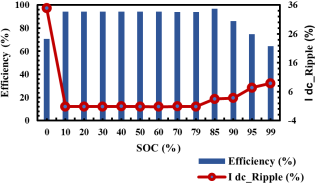
Figure 8. Output DC current ripple vs Efficiency plot for 5 kWh BC.
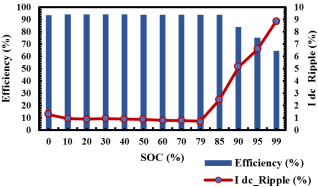
Figure 9. Output DC current ripple vs Efficiency plot for 10 kWh BC.
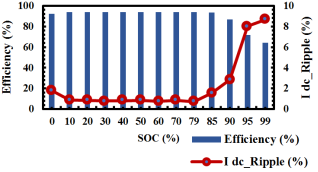
The below Table 6 and Table 7 enumerate the Output DC current Ripple characteristics for the varying state of charge of 5 kWh and 10 kWh battery capacities.
Table 8. Output DC Current Ripple for 25 kWh BC.

25 kWh BC

SOC (%)

0

10

20

30

40

50

60

70

79

85

90

95

99

IRipple,DC(%)

1.82

0.89

0.83

0.79

0.82

0.82

0.77

0.82

0.72

1.56

2.83

8.03

8.66

Efficiency (%)

92.2

94.03

93.88

93.78

93.74

93.74

93.69

93.69

93.66

93.53

86.84

71.82

64.38

Table 9. Output DC Current Ripple for 50 kWh BC.

50 kWh BC

SOC (%)

0

10

20

30

40

50

60

70

79

85

90

95

99

IRipple,DC(%)

1.85

0.92

0.77

0.81

0.84

0.82

0.84

0.84

0.85

2.42

3.36

8.97

9.16

Efficiency (%)

93.33

94.07

93.86

93.75

93.70

93.67

93.67

93.64

93.64

93.42

83.79

71.82

64.36

Figure . 10. Output DC current ripple vs Efficiency plot for 25 kWh BC.. Output DC current ripple vs Efficiency plot for 25 kWh BC.
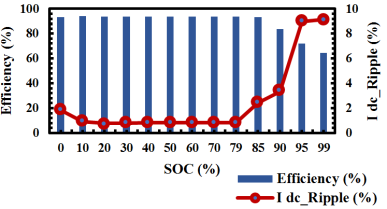
Figure 11. Output DC current ripple vs Efficiency plot for 50 kWh BC.
The output DC current ripple versus efficiency parameters variations of 25 kWh and 50 kWh are noted in the above Table 8 and Table 9 respectively. The variations illustrate that the output DC current ripple is start increasing above 80% of battery status. Meanwhile the efficiency is starts decreasing around 68% of its total efficiency, as the output current ripple increases. The deviation of efficiency falls from 94% to 64% delivered the degradation in charger efficiency gradually over SOC. These variations in the above Figure 8, Figure 9, Figure 10 and Figure 11 indicates Output DC current ripple versus Efficiency plot for 5 kWh, 10 kWh, 25 kWh and 50 kWh independently.
Figure 12. Impact of Output current ripple.
Effects of Output current ripple are mentioned in above Figure 12. Throughout battery experiences aging, which lead to capacity fade, increased internal resistance and scale down the efficiency. The evaluation of ripple currents and their impact on the battery can improve the state- of-health diagnosis and remaining useful life prognosis .
3.3. Input Current Total Harmonic Distortion (THD) Analysis of EV Charger
In electric vehicles, Total Harmonic Distortion ensues due to non linear operation of converters and rectifiers, causing waveform distortion and leads to increase the harmonics over the input current waveform as the charging battery reaches over 80% SOC. The shifts of THD to higher value is chronicled during higher output current ripple towards higher state of charge. The below Figure 13 delineate the tabulation plot of input current THD. The harmonics has to maintained the standard values as per the international standards IEC 61000-3-2 and IEC 61000-3-12.
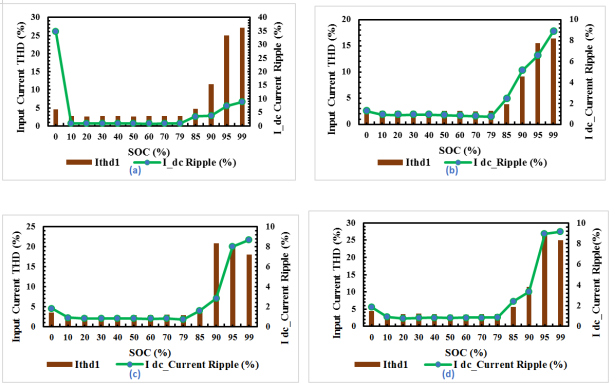
Figure 13. Variations of Input current THD for (a) 5 kWh, (b) 10 kWh, (c) 25 kWh, (d) 50 kWh Battery Capacit.
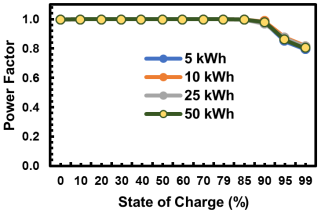
Figure 14. Effects of Ripple on Power factor for different Battery Capacities.
The effects of output current ripple also induce in the input power factor as shown in Figure 14. The increasing in temperature of the battery and EV charger leads to grid current variations. The power factor deviates from unity after the battery reaches 80% SOC. The power factor decreases because of input voltage and input current are out of phase due to the increasing in harmonics. As Battery Capacity increases the EV charger starts heating leads to rise the temperature as the SOC accelerates as detailed in Figure 15. The effects of ripple will also affect the temperature of the EV converter .
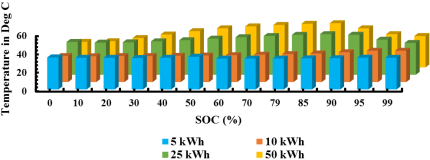
Figure 15. Temperature vs State of Charge for different Battery Capacities.
4. Discussion
The experimental results comprehensively evaluate the performance parameters of the 50 kW EV charger under different battery capacity conditions. Output voltage and current characteristics are analyzed, highlighting their variation across the battery state of charge. The trends of input current THD and output DC current ripple with respect to SoC are clearly illustrated and discussed. Graphical analysis shows that both THD and current ripple increase as the charger transitions toward the constant-voltage region. The corresponding impact on overall system efficiency is also captured, demonstrating its dependence on operating point and charging mode.
5. Conclusion
The growing demand for off-board EV charging has accelerated the adoption of DC fast chargers. A 50 kW two-stage EV charger supplied from a three phase 230 V AC grid is experimentally analyzed using a battery emulator with a DC output range of 200-500 V. Each charger module employs a Vienna rectifier as the front-end AC to DC converter, selected for its high efficiency (>94%), low input current harmonics, and simplified control. Experimental results demonstrate that as the battery state of charge approaches 80%, the charging strategy transitions from constant-current to constant-voltage mode to preserve battery state of health. This transition results in reduced output current and noticeable variations in output current ripple, input current THD, power factor, and efficiency. While the input current THD and output DC current ripple increase in the CV region, the input voltage THD and output voltage ripple remain within standard limits. These observations emphasize the importance of DC current ripple management in EV supply equipment to ensure grid compliance and battery longevity.
Future works will be focused on the expansion of possibilities to lower this current ripple percentage over 80% SOC by using the filter at the output side by choosing the appropriate passive components selection. The output filter has to be selected, designed and tested accordingly.
Abbreviations

AC

Alternating Current

BC

Battery Charger/Battery Capacity

CC-CV

Constant Votlage-Constant Current

CDS

Charging Discover System

DC

Direct Current

EV

Electric Vehicle

EVSE

Electric Vehicle Supply Equipment

PFC

Power Factor Correction

SOC

State of Charge

SOH

State of Health

THD

Total Harmonic Distortion

Acknowledgments
The author would like to express their sincere gratitude to the University of Visvesvaraya College of Engineering (UVCE) and Central Power Research Institute (CPRI) for providing the infrastructure, technical resources, and support necessary for carrying out this research work. The study presented in this paper was made possible through the collaborative efforts and valuable guidance provided by the engineers and research staff at UVCE and CPRI. The authors also acknowledge the support of the management of CPRI for encouraging research in advanced electric vehicle charging technologies.
Conflicts of Interest
The authors declare no conflicts of interest.
References
[1] Nishant, Kumar & Rani, K. & Murthy, K. (2022). Comparative Analysis of Different Topologies of Vienna Rectifier.
[2] T. -H. Kim et al., "Analytical study on low-frequency ripple effect of battery charging," 2012 IEEE Vehicle Power and Propulsion Conference, Seoul, 2012, pp. 809-811,
[3] Zhang, Hechuan. (2016). Impact of Current Ripple on Electric Vehicle Charging Equipment.
[4] Kotub Uddin, Andrew D. Moore, Anup Barai, James Marco, The effects of high frequency current ripple on electric vehicle battery performance, Applied Energy, Volume 178, 2016, Pages 142-154,
[5] Y. Zhang, J. Fang, F. Gao, T. Song, S. Gao and D. J. Rogers, "Second-Harmonic Ripple Voltage Suppression of Integrated Single-Phase Pulsewidth Modulation Rectifier Charging System for EVs," in IEEE Transactions on Power Electronics, vol. 35, no. 4, pp. 3616-3626, April 2020,
[6] S. Gong and V. G. Agelidis, "Ripple manipulator towards REG-integrated EV charging infrastructure system," IECON 2020 The 46th Annual Conference of the IEEE Industrial Electronics Society, Singapore, 2020, pp. 5203-5209,
[7] M. Bayati, M. Abedi, G. B. Gharehpetian and M. Farahmandrad, "Sinusoidal-Ripple Current Control in Battery Charger of Electric Vehicles," in IEEE Transactions on Vehicular Technology, vol. 69, no. 7, pp. 7201-7210, July 2020,
[8] Akhtar, M. F., Raihan, S. R. S. & Rahim, N. A. Battery Charger Based on High Step-Down DC–DC.
[9] Converter for Light Electric Vehicle Charging Applications. Arab J Sci Eng (2025).
[10] Ramos, L. A.; Van Kan, R. F.; Mezaroba, M.; Batschauer, A. L. A Control Strategy to Smooth Power Ripple of a Single-Stage Bidirectional and Isolated AC-DC Converter for Electric Vehicles Chargers. Electronics 2022, 11, 650.
[11] Wrona, G.; Zdanowski, M.; Trochimiuk, P.; Rąbkowski, J.; Sobieski, R. Experimental Validation of 40 kW EV Charger Based on Vienna Rectifier and Series-Resonant Dual Active Bridge. Energies 2023, 16, 5797.
[12] Goldammer, E.; Gentejohann, M.; Schlüter, M.; Weber, D.; Wondrak, W.; Dieckerhoff, S.; Gühmann, C.; Kowal, J. The Impact of an Overlaid Ripple Current on Battery Aging: The Development of the SiCWell Dataset. Batteries 2022, 8, 11.
Cite This Article
  • APA Style

    Manju, D., R, H., Kumar, K. J. (2026). Performance Evaluation of 50 kW AC-DC Converter Using Vienna Rectifier for EV Charging Applications. Science Journal of Circuits, Systems and Signal Processing, 13(1), 1-13. https://doi.org/10.11648/j.cssp.20261301.11

    Copy | Download

    ACS Style

    Manju, D.; R, H.; Kumar, K. J. Performance Evaluation of 50 kW AC-DC Converter Using Vienna Rectifier for EV Charging Applications. Sci. J. Circuits Syst. Signal Process. 2026, 13(1), 1-13. doi: 10.11648/j.cssp.20261301.11

    Copy | Download

    AMA Style

    Manju D, R H, Kumar KJ. Performance Evaluation of 50 kW AC-DC Converter Using Vienna Rectifier for EV Charging Applications. Sci J Circuits Syst Signal Process. 2026;13(1):1-13. doi: 10.11648/j.cssp.20261301.11

    Copy | Download

  • @article{10.11648/j.cssp.20261301.11,
      author = {Divyajyothi Manju and Hemavathi R and K Jeykishan Kumar},
      title = {Performance Evaluation of 50 kW AC-DC Converter Using Vienna Rectifier for EV Charging Applications},
      journal = {Science Journal of Circuits, Systems and Signal Processing},
      volume = {13},
      number = {1},
      pages = {1-13},
      doi = {10.11648/j.cssp.20261301.11},
      url = {https://doi.org/10.11648/j.cssp.20261301.11},
      eprint = {https://article.sciencepublishinggroup.com/pdf/10.11648.j.cssp.20261301.11},
      abstract = {The rise in Electric Vehicle (EV) usage has significantly increased the need for high-power fast charging systems that must meet rigorous performance standards. This paper examines the performance of 50 kW grid-connected EV charger. The design of the charger utilizes a dual stage Vienna rectifier at the front end, combined with a bi-directional DC-DC stage, to achieve a high-power factor, minimize total harmonic distortion (THD), and maintain stable operation of the DC bus. Vienna rectifiers are commonly utilized in high-power electric vehicle chargers because of their excellent efficiency greater than 94% and nearly unity power factor. An analysis of 50 kW charger that employs a Vienna rectifier focuses on its output ripple, input signal distortion, and power input factor. Under standard operating conditions, the performance remains equable. However, once the battery charge status surpasses 80%, the notable decline in performance occurs. In this scenario, both ripple and THD increase, and the power factor strays from unity, potentially harming the battery State of Health (SOH) during constant-voltage charging. Based on research results, this paper quantified the implication of current ripple on conversion efficiency in Electric vehicle charger through experimental verification and the results communicate that the current ripples have important influence on EV chargers.},
     year = {2026}
    }
    

    Copy | Download

  • TY  - JOUR
    T1  - Performance Evaluation of 50 kW AC-DC Converter Using Vienna Rectifier for EV Charging Applications
    AU  - Divyajyothi Manju
    AU  - Hemavathi R
    AU  - K Jeykishan Kumar
    Y1  - 2026/01/19
    PY  - 2026
    N1  - https://doi.org/10.11648/j.cssp.20261301.11
    DO  - 10.11648/j.cssp.20261301.11
    T2  - Science Journal of Circuits, Systems and Signal Processing
    JF  - Science Journal of Circuits, Systems and Signal Processing
    JO  - Science Journal of Circuits, Systems and Signal Processing
    SP  - 1
    EP  - 13
    PB  - Science Publishing Group
    SN  - 2326-9073
    UR  - https://doi.org/10.11648/j.cssp.20261301.11
    AB  - The rise in Electric Vehicle (EV) usage has significantly increased the need for high-power fast charging systems that must meet rigorous performance standards. This paper examines the performance of 50 kW grid-connected EV charger. The design of the charger utilizes a dual stage Vienna rectifier at the front end, combined with a bi-directional DC-DC stage, to achieve a high-power factor, minimize total harmonic distortion (THD), and maintain stable operation of the DC bus. Vienna rectifiers are commonly utilized in high-power electric vehicle chargers because of their excellent efficiency greater than 94% and nearly unity power factor. An analysis of 50 kW charger that employs a Vienna rectifier focuses on its output ripple, input signal distortion, and power input factor. Under standard operating conditions, the performance remains equable. However, once the battery charge status surpasses 80%, the notable decline in performance occurs. In this scenario, both ripple and THD increase, and the power factor strays from unity, potentially harming the battery State of Health (SOH) during constant-voltage charging. Based on research results, this paper quantified the implication of current ripple on conversion efficiency in Electric vehicle charger through experimental verification and the results communicate that the current ripples have important influence on EV chargers.
    VL  - 13
    IS  - 1
    ER  - 

    Copy | Download

Author Information