
This study presents a comparative fatigue-life assessment of two traction-arm designs used on the New Holland TT75 tractor operating under the demanding agricultural conditions found in Chad: the current production arm (BA) and a geometrically optimized alternative (BP), both manufactured from S235 steel. Finite element simulations performed in ABAQUS/CAE 2017 were used to determine the maximum and equivalent stresses generated in each arm under applied pressures ranging from 90 to 125 MPa, the equivalent stresses being obtained through the Goodman mean-stress correction. Fatigue life was then predicted using three complementary damage models of increasing complexity: Miner's linear cumulative-damage law, the Tikri model, and the Chaboche-Lemaître continuous damage model, applied first to constant-amplitude loading and then to loading sequences that include periodic overload cycles (one overload every 50 cycles, with overload ratios R = 1.2, 1.4 and 1.6) representative of the irregular soil, stones and roots encountered during ploughing and traction work in Chadian fields. Reference life values were obtained by digitizing a published Wohler S-N curve for S235JR steel. Across every applied pressure and every overload scenario, the optimized arm (BP) developed systematically lower equivalent stresses and achieved a longer predicted fatigue life than the current arm (BA), regardless of the damage model used. Among the three models, the Chaboche-Lemaître formulation consistently gave the most accurate and most conservative life estimates, capturing the progressive, sequence-dependent nature of damage accumulation more realistically than Miner's rule, which tended toward optimistic, non-conservative predictions. These findings confirm that modest geometric optimization of the traction arm can meaningfully extend component durability under the harsh tropical operating conditions typical of Chadian agriculture, and they point to the Chaboche-Lemaître model as the preferred tool for life prediction in this application, pending confirmation through physical fatigue testing.
| Published in | Engineering and Applied Sciences (Volume 11, Issue 5) |
| DOI | 10.11648/j.eas.20261105.14 |
| Page(s) | 194-204 |
| Creative Commons |
This is an Open Access article, distributed under the terms of the Creative Commons Attribution 4.0 International License (http://creativecommons.org/licenses/by/4.0/), which permits unrestricted use, distribution and reproduction in any medium or format, provided the original work is properly cited. |
| Copyright |
Copyright © The Author(s), 2026. Published by Science Publishing Group |
Fatigue, Traction Arms, Finite Elements, Miner, Chaboche-Lemaitre, Tikri
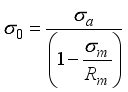
Pressure applied in MPa | Constraints of the actual Arm (BA) | Constraints of the Proposed Arm (BP) | ||
|---|---|---|---|---|
S11. max (MPa) | Σ0 (MPa) | S11. max (MPa) | σ0 (MPa) | |
90 | 314,7 | 239,16 | 296 | 218,20 |
95 | 332,2 | 259,97 | 312,4 | 236,51 |
100 | 349,7 | 282,07 | 328,9 | 255,95 |
105 | 367,2 | 305,56 | 345,3 | 276,38 |
110 | 384,7 | 330,58 | 361,8 | 298,15 |
115 | 402,2 | 357,30 | 378,2 | 321,10 |
120 | 419,7 | 385,89 | 394,7 | 345,63 |
125 | 437,1 | 416,37 | 411,1 | 371,60 |
Applied pressure in MPa | Equivalent stress in MPa (BA) | Experimental Life Cycle of BA (extract) | Equivalent stress in MPa (BP) | Experimental Life Cycle of BP (extract)) |
|
|---|---|---|---|---|---|
90 | 239 | 132756 | 218 | 2262300 | 5,87 |
95 | 260 | 35229 | 237 | 132756 | 26,54 |
100 | 282 | 13174 | 256 | 43638 | 30,19 |
105 | 306 | 4575 | 276 | 14169 | 32,29 |
110 | 331 | 1475 | 298 | 6140 | 24,02 |
115 | 357 | 614 | 321 | 2240 | 27,41 |
120 | 386 | 222 | 345 | 896 | 24,78 |
125 | 416 | 74 | 372 | 296 | 25 |
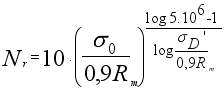
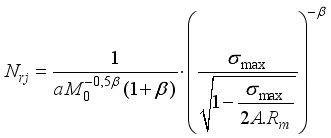
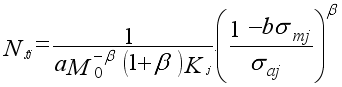
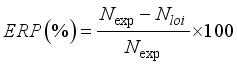
Equivalent stress | (MPa) Number of Experimental Life Cycles (extract) | Miner's Law | Tikri Model | Chaboche Model | |||
|---|---|---|---|---|---|---|---|
Life Cycle | ERP (%) | Life Cycle | ERP (%) | Life Cycle | ERP (%) | ||
239 | 132756 | 744627 | -461 | 137783 | -3,78 | 111520 | 15,99 |
260 | 35229 | 175910 | -399 | 45576 | -29,37 | 33532 | 4,81 |
282 | 13174 | 43743 | -232 | 15694 | -19,12 | 10522 | 20,13 |
306 | 4575 | 10794 | -136 | 5378 | -17,55 | 3281 | 28,28 |
331 | 1475 | 2811 | -90,55 | 1922 | -30,30 | 1070 | 27,45 |
357 | 614 | 769 | -25,31 | 714 | -16,28 | 364 | 40,71 |
386 | 222 | 202 | 9,07 | 257 | -15,76 | 119 | 46,39 |
416 | 74 | 56 | 24,33 | 97 | -31,08 | 41 | 44,59 |
Equivalent stress | (MPa) Number of Experimental Life Cycles (extract) | Miner's Law | Tikri Model | Chaboche Model | |||
|---|---|---|---|---|---|---|---|
Life Cycle | ERP (%) | Life Cycle | ERP (%) | Life Cycle | ERP (%) | ||
218 | 2262300 | 3099342 | -36,99 | 461648 | 79,59 | 414264 | 81,68 |
237 | 132756 | 740425 | -458,7 | 153871 | -15,90 | 125727 | 5,29 |
256 | 43638 | 197546 | -352,7 | 55867 | -28,02 | 41835 | 4,13 |
276 | 14169 | 54444 | -284,24 | 20811 | -46,87 | 14302 | -0,93 |
298 | 6140 | 14632 | -138,30 | 7610 | -23,94 | 4788 | 22,01 |
321 | 2240 | 4093 | -82,74 | 2873 | -28,25 | 1657 | 26,02 |
345 | 896 | 1190 | -32,82 | 1118 | -24,77 | 592 | 33,92 |
372 | 296 | 327 | -10,57 | 417 | -40,87 | 202 | 31,75 |
| [1] | Kim, J.-H., Kim, K.-M., Kim, J.-G., & Nam, J.-S. (2026). Fatigue life evaluation and research trend in agricultural machinery: A review. Journal of Agricultural Engineering, 57(3), Article 1928. |
| [2] | Zhang, C., Song, J., Yin, X., Cai, J., Liang, Y., & Lu, J. (2025). Digital twin-based approaches for agricultural machinery damage prediction and maintenance: A review. Journal of Computational Design and Engineering, 12(10), 87–117. |
| [3] | Djondang, S., Bianzeubé, T., Natebaye, N., & Adjeffa, G. (2023). Study two-dimensional and three-dimensional of the stress concentration of the traction arm of the NEW HOLLAND TT75 tractor in service in CHAD. Open Journal of Applied Sciences, 13(2), 212–223. |
| [4] | Palmgren, A. (1924). Die Lebensdauer von Kugellagern. Zeitschrift des Vereines Deutscher Ingenieure, 68(14), 339–341. |
| [5] | Miner, M. A. (1945). Cumulative damage in fatigue. Journal of Applied Mechanics, 12(3), A159–A164. |
| [6] | Tikri, B. (2012). Etude de l’influence de surcharges sur le comportement en fatigue d’aciers soudés par points. Thèse de doctorat, Université Blaise Pascal – Clermont Ferrand II. |
| [7] | Chaboche, J. L., & Lesne, P. M. (1988). A non-linear continuous fatigue damage model. Fatigue & Fracture of Engineering Materials & Structures, 11(1), 1–17. |
| [8] | Lemaitre, J., & Chaboche, J.-L. (1990). Mechanics of solid materials. Cambridge University Press. |
| [9] | Staff. univ-batna2. (2022). Fatigue des matériaux. |
| [10] | Wöhler, A. (1870). Über die Festigkeitsversuche mit Eisen und Stahl. Zeitschrift für Bauwesen, 20, 73–106. |
| [11] | Basquin, O. H. (1910). The exponential law of endurance tests. Proceedings of the American Society for Testing and Materials, 10, 625–630. |
| [12] | Goodman, J. (1899). Mechanics applied to engineering. Longmans, Green and Co. |
| [13] | Schijve, J. (2009). Fatigue of structures and materials (2nd ed.). Springer. |
| [14] | Fatemi, A., & Yang, L. (1998). Cumulative fatigue damage and life prediction theories: A survey of the state of the art for homogeneous materials. International Journal of Fatigue, 20(1), 9–34. |
| [15] | Santecchia, E., Hamouda, A. M. S., Musharavati, F., Zalnezhad, E., Cabibbo, M., El Mehtedi, M., & Spigarelli, S. (2016). A review on fatigue life prediction methods for metals. Advances in Materials Science and Engineering, 2016, Article 9573524. |
| [16] | Hectors, K., & De Waele, W. (2021). Cumulative damage and life prediction models for high-cycle fatigue of metals: A review. Metals, 11(2), Article 204. |
| [17] | Manson, S. S., & Halford, G. R. (1981). Practical implementation of the double linear damage rule and damage curve approach for treating cumulative fatigue damage. International Journal of Fracture, 17(2), 169–192. |
| [18] | Chen, H., Yang, F., Wu, Z., Yang, B., & Huo, J. (2023). A nonlinear fatigue damage accumulation model under variable amplitude loading considering the loading sequence effect. International Journal of Fatigue, 177, Article 107945. |
| [19] | Yang, B., & Huo, J. (2025). A multi-level nonlinear cumulative fatigue damage life prediction model considering load loading effects. Materials, 18(17), Article 3973. |
| [20] | Wheeler, O. E. (1972). Spectrum loading and crack growth. Journal of Basic Engineering, 94(1), 181–186. |
| [21] | Gassner, E. (1939). Festigkeitsversuche mit wiederholter Beanspruchung im Flugzeugbau. Luftwissen, 6, 61–64. |
| [22] | Sun, L., Yuan, Z., & Zhu, S. (2019). Research on fatigue life prediction method of tractor frame. IOP Conference Series: Earth and Environmental Science, 358(4), Article 042018. |
| [23] | Kim, W.-S., Kim, Y.-J., Kim, Y.-S., Park, S.-U., Lee, K.-H., Hong, D.-H., & Choi, C.-H. (2021). Evaluation of the fatigue life of a tractor’s transmission spiral bevel gear. Journal of Terramechanics, 94, 13–22. |
| [24] | Hwang, I.-S., Kim, J.-H., Im, W.-T., Jeung, H.-H., Nam, J.-S., & Shin, C.-S. (2024). Analyzing safety factors and predicting fatigue life of weak points in an electrically driven, multi-purpose cultivation tractor. Agriculture, 14(3), Article 416. |
| [25] | Jain, V., Jain, A., Jain, T., Kushwaha, B. K., & Kumar, A. (2025). Fatigue life enhancement of a tractor wheel disc under cornering load using finite element analysis and experimental validation. ARAI Journal of Mobility Technology, 6(3), 2237–2249. |
| [26] | Xian, C., Zhang, H., Kim, Y.-C., Zhang, H., & Liu, Y. (2024). Programmed system for fatigue life prediction of excavator turntables based on multi-body dynamics and finite element analysis. Heliyon, 10(12), Article e33126. |
| [27] | Felaco, A., Ionescu, N., & Lamanna, G. (2025). Advanced methodologies for fatigue in agricultural machinery: Integrating multibody dynamics and finite element analysis. Macromolecular Symposia, 414(3), Article 70068. |
| [28] | Mendes, P., Correia, J. A. F. O., Mourão, A., Dantas, R., de Jesus, A., Horas, C., Fantuzzi, N., & Manuel, L. (2024). High-cycle fatigue design curves of mild- and high-strength steels for offshore applications. Structures, 67, Article 106827. |
| [29] | Razmkhah, M. H., Ghaderi, M., & Gerami, M. (2023). Experimental study on seismic fatigue capacity of high- and mild-strength structural steels with and without corrosion. Shock and Vibration, 2023, Article 9107240. |
APA Style
Sindang, D., Ouinra, K., Sehoret, T., Badjoua, B. (2026). Comparative Prediction of the Fatigue Life of Traction Arms on the New Holland TT75 Tractor in Chad: Miner, Chaboche-Lemaitre and Tikri Approaches. Engineering and Applied Sciences, 11(5), 194-204. https://doi.org/10.11648/j.eas.20261105.14
ACS Style
Sindang, D.; Ouinra, K.; Sehoret, T.; Badjoua, B. Comparative Prediction of the Fatigue Life of Traction Arms on the New Holland TT75 Tractor in Chad: Miner, Chaboche-Lemaitre and Tikri Approaches. Eng. Appl. Sci. 2026, 11(5), 194-204. doi: 10.11648/j.eas.20261105.14
@article{10.11648/j.eas.20261105.14,
  author = {Djondang Sindang and Kinet Ouinra and Tchoudang Sehoret and Baimi Badjoua},
  title = {Comparative Prediction of the Fatigue Life of Traction Arms on the New Holland TT75 Tractor in Chad: Miner, Chaboche-Lemaitre and Tikri Approaches},
  journal = {Engineering and Applied Sciences},
  volume = {11},
  number = {5},
  pages = {194-204},
  doi = {10.11648/j.eas.20261105.14},
  url = {https://doi.org/10.11648/j.eas.20261105.14},
  eprint = {https://article.sciencepublishinggroup.com/pdf/10.11648.j.eas.20261105.14},
  abstract = {This study presents a comparative fatigue-life assessment of two traction-arm designs used on the New Holland TT75 tractor operating under the demanding agricultural conditions found in Chad: the current production arm (BA) and a geometrically optimized alternative (BP), both manufactured from S235 steel. Finite element simulations performed in ABAQUS/CAE 2017 were used to determine the maximum and equivalent stresses generated in each arm under applied pressures ranging from 90 to 125 MPa, the equivalent stresses being obtained through the Goodman mean-stress correction. Fatigue life was then predicted using three complementary damage models of increasing complexity: Miner's linear cumulative-damage law, the Tikri model, and the Chaboche-Lemaître continuous damage model, applied first to constant-amplitude loading and then to loading sequences that include periodic overload cycles (one overload every 50 cycles, with overload ratios R = 1.2, 1.4 and 1.6) representative of the irregular soil, stones and roots encountered during ploughing and traction work in Chadian fields. Reference life values were obtained by digitizing a published Wohler S-N curve for S235JR steel. Across every applied pressure and every overload scenario, the optimized arm (BP) developed systematically lower equivalent stresses and achieved a longer predicted fatigue life than the current arm (BA), regardless of the damage model used. Among the three models, the Chaboche-Lemaître formulation consistently gave the most accurate and most conservative life estimates, capturing the progressive, sequence-dependent nature of damage accumulation more realistically than Miner's rule, which tended toward optimistic, non-conservative predictions. These findings confirm that modest geometric optimization of the traction arm can meaningfully extend component durability under the harsh tropical operating conditions typical of Chadian agriculture, and they point to the Chaboche-Lemaître model as the preferred tool for life prediction in this application, pending confirmation through physical fatigue testing.},
 year = {2026}
}
TY  - JOUR
T1  - Comparative Prediction of the Fatigue Life of Traction Arms on the New Holland TT75 Tractor in Chad: Miner, Chaboche-Lemaitre and Tikri Approaches
AU  - Djondang Sindang
AU  - Kinet Ouinra
AU  - Tchoudang Sehoret
AU  - Baimi Badjoua
Y1  - 2026/10/20
PY  - 2026
N1  - https://doi.org/10.11648/j.eas.20261105.14
DO  - 10.11648/j.eas.20261105.14
T2  - Engineering and Applied Sciences
JF  - Engineering and Applied Sciences
JO  - Engineering and Applied Sciences
SP  - 194
EP  - 204
PB  - Science Publishing Group
SN  - 2575-1468
UR  - https://doi.org/10.11648/j.eas.20261105.14
AB  - This study presents a comparative fatigue-life assessment of two traction-arm designs used on the New Holland TT75 tractor operating under the demanding agricultural conditions found in Chad: the current production arm (BA) and a geometrically optimized alternative (BP), both manufactured from S235 steel. Finite element simulations performed in ABAQUS/CAE 2017 were used to determine the maximum and equivalent stresses generated in each arm under applied pressures ranging from 90 to 125 MPa, the equivalent stresses being obtained through the Goodman mean-stress correction. Fatigue life was then predicted using three complementary damage models of increasing complexity: Miner's linear cumulative-damage law, the Tikri model, and the Chaboche-Lemaître continuous damage model, applied first to constant-amplitude loading and then to loading sequences that include periodic overload cycles (one overload every 50 cycles, with overload ratios R = 1.2, 1.4 and 1.6) representative of the irregular soil, stones and roots encountered during ploughing and traction work in Chadian fields. Reference life values were obtained by digitizing a published Wohler S-N curve for S235JR steel. Across every applied pressure and every overload scenario, the optimized arm (BP) developed systematically lower equivalent stresses and achieved a longer predicted fatigue life than the current arm (BA), regardless of the damage model used. Among the three models, the Chaboche-Lemaître formulation consistently gave the most accurate and most conservative life estimates, capturing the progressive, sequence-dependent nature of damage accumulation more realistically than Miner's rule, which tended toward optimistic, non-conservative predictions. These findings confirm that modest geometric optimization of the traction arm can meaningfully extend component durability under the harsh tropical operating conditions typical of Chadian agriculture, and they point to the Chaboche-Lemaître model as the preferred tool for life prediction in this application, pending confirmation through physical fatigue testing.
VL  - 11
IS  - 5
ER  -
Faculty of Applied Sciences, University of N’Djamena, N’Djamena, Chad;Faculty of Engineering Sciences and Technology, Polytechnic University of Mongo, Mongo, Chad
Faculty of Applied Sciences, University of N’Djamena, N’Djamena, Chad
Faculty of Applied Sciences, University of N’Djamena, N’Djamena, Chad;Faculty of Engineering Sciences and Technology, Polytechnic University of Mongo, Mongo, Chad
Faculty of Engineering Sciences and Technology, Polytechnic University of Mongo, Mongo, Chad
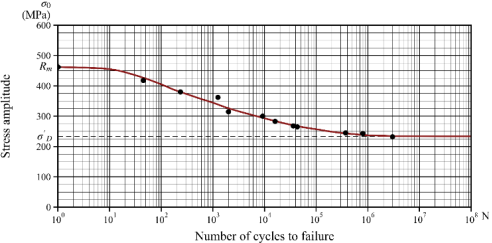
Figure 1.
Wöhler curve for S235JR steel [9].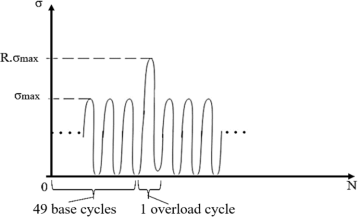
Figure 2. Cycle variation with an overload cycle every 50 cycles.
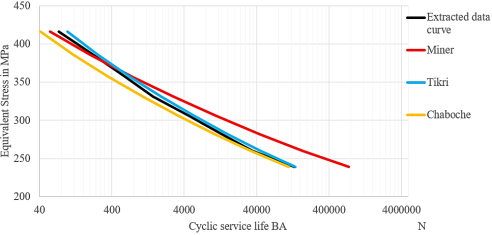
Figure 3. GASSNER S-N curve for the actual arm model.
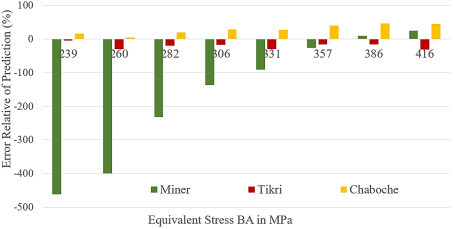
Figure 4. Histogram of ERP (%) as a function of the applied pressure of the actual arm.
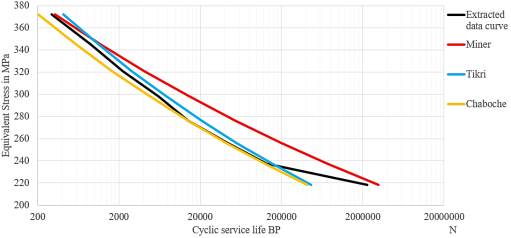
Figure 5. GASSNER S-N curve for the proposed arm model.
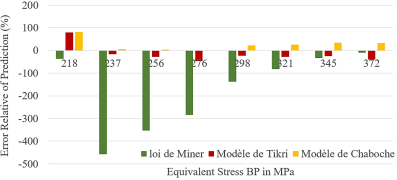
Figure 6. Histogram of ERP (%) as a function of the equivalent stress of the proposed arm.
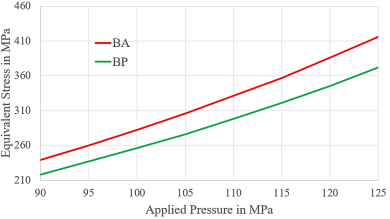
Figure 7. Equivalent stress as a function of applied pressure for BA and BP (without overload).
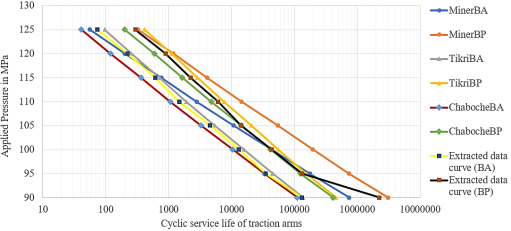
Figure 8. Applied pressure as a function of the BA and BP service life—without overload.
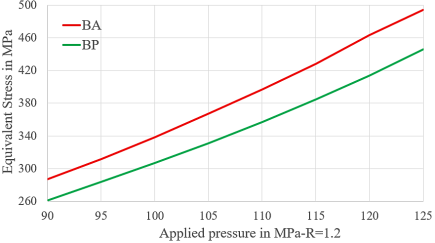
Figure 9. Equivalent stress as a function of applied pressure for BA and BP-R=1.2.
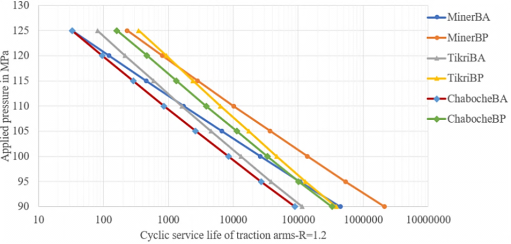
Figure 10. Applied pressure as a function of the life cycle of the BA and BP-R=1.4.
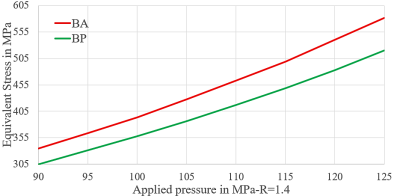
Figure 11. Equivalent stress as a function of applied pressure for BA and BP-R=1.4.
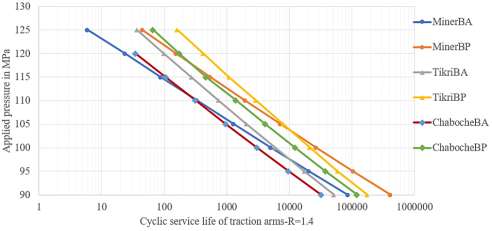
Figure 12. Applied pressure as a function of the life cycle of the BA and BP-R=1.4.
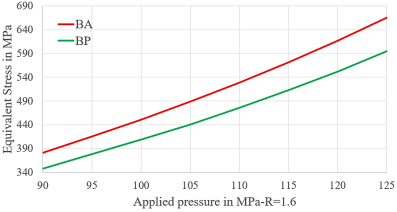
Figure 13. Equivalent stress as a function of applied pressure for BA and BP-R=1,6.
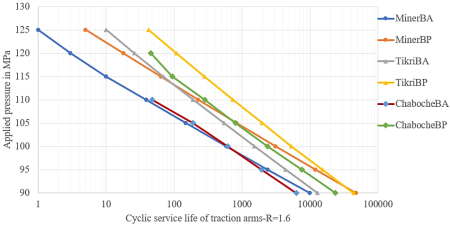
Figure 14. Applied pressure as a function of the life cycle of the BA and BP-R=1,6.

Information



 Share This Article
 Twitter
 Linked In
 Facebook

 Copy
 Download