Research Article | | Peer-Reviewed

Physicochemical Characteristics and Macroinvertebrate Communities of the Crenon and Potamon of the Lobo River in the Rainforest Zone of Cameroon

Received: 18 June 2026     Accepted: 9 July 2026     Published: 22 August 2026
Views:       Downloads:
Abstract

A study of the physicochemical water quality and the diversity of Benthic Macroinvertebrates (BMIs) in the Lobo River was conducted to characterize its upper and lower reaches. Sampling was carried out between May 2020 to May 2021 across four stations (two in the crenon and two in the potamon), using standard methods for physicochemical analyses. BMIs were collected with a 30-cm square, 400-µm mesh dip net over a 100-meter stretch at each station, following the multi-habitat method. Physicochemical parameters were generally low and homogeneous between the crenon and potamon (p > 0.05), with recorded values for dissolved oxygen (61.23 ± 4.37%), turbidity (17.43 ± 2.15 FTU), and suspended solids (16.81 ± 2.29 mg/L); nitrogen forms (0.54 ± 0.08 mg/L NH4+; 0.36 ± 0.18 mg/L NO3-) and orthophosphates (0.85 ± 0.37 mg/L PO43-) being higher in the crenon (L2), whereas nitrites were lower at that zone (0.012 ± 0.004 mg/L NO2-). A total of 86 BMIs species belonging to 3 phyla, 5 classes, 10 orders, and 38 families were recorded. Key bioindicators recorded were: Caridina nilotica and Phyllomacromia bifasciata in the crenon; Micronecta sp., Tramea transmarina, and Canas macateei in the potamon. The Shannon-Weaver diversity index indicated sites with low diversity encompassing both pollution-sensitive (Atyidae and Polymictarcyidae) and pollution-tolerant (Libellulidae and Belostomatidae) organisms, as revealed by Principal Component Analysis (PCA).

Published in Ecology and Evolutionary Biology (Volume 11, Issue 3)
DOI 10.11648/j.eeb.20261103.14
Page(s) 79-91
Creative Commons

This is an Open Access article, distributed under the terms of the Creative Commons Attribution 4.0 International License (http://creativecommons.org/licenses/by/4.0/), which permits unrestricted use, distribution and reproduction in any medium or format, provided the original work is properly cited.

Copyright

Copyright © The Author(s), 2026. Published by Science Publishing Group

Keywords

Bioindicator, Ecology, Ecologic Zone, Lotic Ecosystem, Water Uses

1. Introduction
The overexploitation of ecosystem services (food, water, textiles, and other raw materials) degrades the environment and weakens its ability to regulate climate and water . Freshwater has intrinsic value for human life, health, food security, and biodiversity; yet billions of people worldwide face problems of water scarcity and poor water quality . These are interconnected global issues, exacerbated by climate change, population growth, and pollution, leading to health risks (waterborne diseases), economic risks (losses in GDP), and social risks (conflicts) . The most significant challenge for water management is how to increase the quantity and quality of water resources, while simultaneously improving ecosystem services for society, biodiversity, and resilience to impacts .
The impact of human activities on aquatic ecosystems is often assessed using biological indicator species . The species most commonly used worldwide to assess the overall ecological status of aquatic environments are fish communities, benthic diatoms, and benthic macroinvertebrates . Benthic macroinvertebrates are aquatic organisms visible to the naked eye that inhabit the bottoms of lakes and watercourses; these include insects (larvae, nymphs, adults), mollusks, crustaceans, and worms . They are diverse and belong to various phyla. Their species-specific responses to toxins provide information on the degree of stress on aquatic systems and allow for the interpretation of the effects of human activities on the community . These are sedentary organisms with varied life cycles that provide a snapshot of water quality over time .
In Cameroon, water quality in aquatic ecosystems is commonly assessed by analyzing physicochemical parameters and benthic fauna . In the ecological zone of the rainforests, studies have been conducted by Lactio et al., Nwaha et al., Nwaha, and Dzavi . However, there are still several water systems in the zone whose quality has been little or not at all explored, notably the Lobo River. Understanding water quality is essential for optimizing water resources, designing hydrosystem management plans, helping to resolve conflicts related to water quality, and thereby contributing to the achievement of Sustainable Development Goal 6. With this in mind, a study was conducted on the physicochemical and biological water quality to characterize the crenon and potamon of the Lobo River. The objectives were to assess the ecological status of the freshwater shrimp and river crayfish based on the physicochemical and biological parameters of the water, determine potential water uses, and evaluate the ecological quality of the sites using benthic macroinvertebrates.
2. Materials and Methods
2.1. Study Area
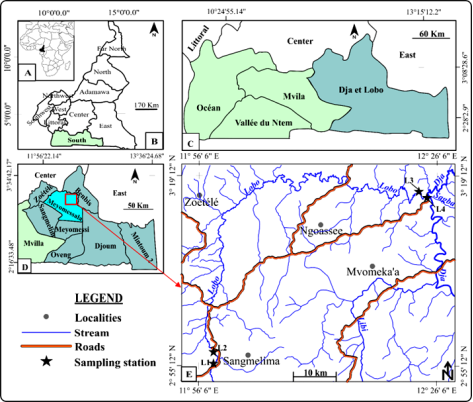
The study was conducted on the Lobo River, located in the humid forest with bimodal rainfall zone ; it flows into the Dja River, which empties into the Congo Basin (Figure 1). The climate is of the Guinean equatorial type, with four seasons occurring throughout the year: a long dry season (November to March, LDS), a short rainy season (March to June, SRS), a short dry season (July to August, SDS), and a long rainy season (September to November, LRS) . The following criteria guided the selection of sampling stations: i) accessibility, ii) absence of tributaries, industrial and mining activities near the stations, and iii) the presence of diverse microhabitats. Four (04) stations were selected, with two in the crenon of the river at Sangmelima (02°55’49.7’’N, 011°58’10’’E; 655 m and 02°56’39.1’’N, 011°58’12.9’’E; 662 m) and two at the potamon site in Mekin village (03°16’19.32’’N, 012°24’19.03’’E; 620 m and 03°16’25.9’’N, 012°24’53.6’’E; 620 m) (Figure 1).
Figure 1. Geographic location of the Lobo River. L1, L2, L3, and L4 = sampling stations.
2.2. Water Sampling and Measurement of Physicochemical Parameters
Physicochemical parameters of water were measured monthly from May 2020 to May 2021 in the field and in the laboratory according to the recommendations of APHA and Rodier et al. . In the field, Dissolved Oxygen (%) and pH were measured using a Hach HQ 30d oximeter and a LAQUA HORIBA multiparameter meter, respectively. Using water samples brought back to the laboratory, Suspended Solids (SS) (mg/L), turbidity (FTU), ammonia nitrogen (mg/L NH4+), nitrites (mg/L NO2), nitrates (mg/L NO3), and orthophosphates (mg/L PO43-) were measured using a DR 3900 spectrophotometer and specific reagents.
2.3. Sampling of Benthic Macroinvertebrates
BMIs sampling was conducted at the same frequency. The mobile boot-and-net technique recommended by Touzin, Usseglio-Poltera et al. and CCME was used. The sampling equipment consisted of a dip net, comprising a 30 cm × 30 cm metal frame mounted on a 150 cm long steel handle and fitted with a 50 cm deep conical net of 400 µm mesh size. Fauna were collected by moving along transects through the target habitats, striking the substrates with the core sampler to dislodge the benthos and capture it while sweeping the water with the net. Transect sampling began downstream of the section and was conducted for 3 minutes over a 10-meter length, covering a total distance of 100 meters per station. The specimens in the net were placed on a white cloth, then collected using a pair of fine-tipped forceps and transferred to pill bottles containing 96% ethanol. The specimens were identified at the Laboratory of Hydrobiology and Environment at the University of Yaounde 1. Depending on the taxonomic group, identifications were resolved to the family, genus, and/or species level using a WILD M3B binocular magnifying glass with episcopic illumination using identification keys of Durand and Levêque, De Moor and Day, De Moor et al., Martin and Aït Boughrous and Tachet et al. .
2.4. Data Analysis
The Water Quality Assessment System was applied with the aim of correlating the physicochemical quality of the water with various types of uses. Thus, the average values of the physicochemical parameters measured at the study stations were compared with the classes and indices of water suitability for biological and various other uses in the SEQ-Eau grid (Appendix 1).
The structure of the benthic macroinvertebrate community was determined based on species richness, relative abundance, the Shannon and Weaver diversity indices (H’), and Pielou’s evenness index J. Expected species richness was calculated for each of the eight nonparametric estimators (ACE, ICE, Chao 1, Chao 2, Jackknife 1, Jackknife 2, Bootstrap, and MMMean) using the EstimateS 9.1.0 software . All sampling efforts (SE) were expressed using the formula:
SE=S x 100 / T (1)
Where S = the number of species actually observed, T = the number of species predicted by fitting the data to one of the theoretical models (nonparametric estimators). The species richness accumulation curve (MAU-TAU curve) was generated using Excel 2016.
The status of a species as a bioindicator was determined based on the calculation of indicator values (IndVal) as described by . It is expressed as follows:
IndValkj=100 x Akj x Bkj(2)
where Akj = the average abundance of species j at a site / the average abundance of that species across all sites in set k. Bkj = frequency of occurrence of species j across the set k of sites. A species is considered a bioindicator of a habitat only when the “IndVal” value is greater than or equal to 25% or if the permutation test is significant . This analysis was performed using the “indic species” package in R software version 3.0.3 .
The Kolmogorov-Smirnov normality test, ANOVA, and Tukey’s test were used to set the probability threshold at 5%. Principal Component Analysis (PCA) was performed using environmental variables, BMIs abundance, and sampling sites to assess the relationships among the different variables. All these analyses were conducted using SPSS 20.0 and Past 3.0 .
3. Results
3.1. Physicochimical Parameters
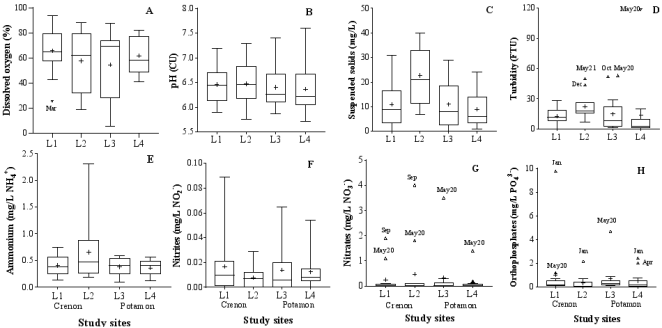
In the crenon, dissolved oxygen saturation levels ranged from 18.50% (L2, May 2020) to 97.70% (L1, July), with an average of 61.23 ± 4.37% (Figure 2A). In the potamon, values ranged from 5.40% (L3, October) to 87.80% (L3, September), with an average of 57.51 ± 4.50%. No significant differences were observed between stations throughout the study period (ANOVA; p = 0.39).
Figure 2. Spatiotemporal variations in physicochemical parameter values during the study period. A. Dissolved oxygen; B. pH; C. SS; D. Turbidity; E. Ammonia nitrogen; F. Nitrites; G. Nitrates; H. Orthophosphates.
In the crenon pH values ranged from 5.75 CU to 7.29 CU at L2 in October and August, respectively (Figure 2B), fluctuating around an average of 6.47 ± 0.08 CU. In the potamon, pH values ranged from 5.71 CU and 7.6 CU at L4 in October and July, respectively, with a mean of 6.34 ± 0.14 CU. No significant variation was observed between the stations (p = 0.99). Suspended Solids (SS) concentrations were very low across all stations during the study, ranging from 0 mg/L (L1) to 40 mg/L (L2) in December for the crenon and from 0 to 29 mg/L (L3) in December and October, respectively, for the potamon (Figure 2C). Comparison of means SS concentrations using the ANOVA test revealed significant differences between L2 and L3 (p = 0.01) and between L2 and L4 (p = 0.003). Turbidity values remained low across all stations (Figure 2D). However, notably high turbidity levels (>35 FTU) were recorded in the crenon at L2 (44 FTU in December and 50 FTU in May 2021), with an overall mean of 17.43 ± 2.15 FTU. Similarly, in the potamon, values exceeding 35 FTU were obtained at L3 (52 FTU in October and 53 FTU in May 2020) and L4 (118 mg/L in May 2020), varying around an average of 14.34 ± 4.99 FTU. No significant difference was observed between stations (p = 0.73).
Ammonia nitrogen concentrations in the crenon ranged from 0.13 mg/L NH4+ (L1, October) to 2.31 mg/L NH4+ (L2, March), with a mean of 0.54 ± 0.08 mg/L NH4+ (Figure 2E). In the potamon, values ranged from 0.10 mg/L NH4+ (L3, July) to 0.59 mg/L NH4+ (L3, November), with a mean of 0.37 ± 0.03 mg/L NH4+. These concentrations did not vary significantly among stations (p = 0.09). During the study, the highest nitrite concentration in the crenon was recorded at L1 (0.089 mg/L NO2-, December) (Figure 2F); whereas in the potamon it was highest at L3 (0.065 mg/L NO2-, February). The lowest concentrations were 0 mg/L NO2-, recorded at all stations during several months. Significant differences were found between L2 and L3 (p = 0.02) and between L2 and L4 (p = 0.02). Nitrate concentrations remainded generally low (below 0.50 mg/L NO3-) across all months and stations, except at L1 (1.10 mg/L NO3- in May 2020, and 1.90 mg/L NO3- in September) and L2 (1.80 mg/L NO3- in May 2020, and 4 mg/L NO3- in September) in the crenon (Figure 2G). In the potamon, the highest levels were occured in May (L3, 3.50 mg/L NO3- and L4, 1.40 mg/L NO3-). Means concentration were 0.25 ± 0.16 mg/L NO3- (L1); 0.47 ± 0.32 mg/L NO3- (L2); 0.32 ± 0.27 mg/L NO3- (L3) and 0.14 ± 0.11 mg/L NO3- (L4). Nitrate concentrations did not vary significant among stations (ANOVA, p = 0.78). In the crenon, orthophosphate concentrations ranged from 0.03 mg/L PO43- at L1 and L2 (October and November, respectively) to 9.76 mg/L PO43- at L1 in January (Figure 2H). Concentrations fluctuated a mean of 0.85 ± 0.37 mg/L PO43-. In the potamon, the lowest concentration (0.05 mg/L PO43-) was recorded at L4 in February and the highest (4.7 mg/L PO43-) at L3 in May 2020. Concentrations fluctuated around a mean of 0.60 ± 0.20 mg/L PO43-. The ANOVA test revealed no significant difference (p = 0.75) among stations.
3.2. Application of Water Quality Assessment Systems (SEQ-Eau) to the Studied Hydrosystems
The assessment of water suitability for aquatic life in the crenon and potamon streams of the Lobo River indicated that both sites belong to the green quality class (Table 1). This classification reflects conditions that are generally favorable for the development of aquatic communities, although reduced sensitivity of certain demanding taxa may suggest a slight ecological impairment.
The suitability class for drinking water production was also green at all sites (Table 1). This class corresponds to a suitability index of 60 and 80, representing good-quality water that nevertheless requires simple treatment prior to human consumption. The suitability of the water for livestock drinking corresponds to the color blue (Table 1). According to SEQ-Eau, the water in these hydrosystems is of very good quality for animal consumption.
Table 1. Water quality classes for biology, drinking water production, and animal drinking, based on average values of physicochemical parameters.

Aptitude level

Aptitude for biology

Drinking water production

Watering animals

Study sites

Crenon

Potamon

Crenon

Potamon

Crenon

Potamon

Sampling stations

L1

L2

L3

L4

L1

L2

L3

L4

L1

L2

L3

L4

O2 (%)

65,63

57,52

54,51

61,63

65,63

57,52

54,51

61,63

//

pH (UC)

6,46

6,48

6,4

6,36

//

SS (mg/L)

10,92

22,69

11

9

10,92

22,69

11

9

Turbidity (FTU)

12,66

22,2

14,98

13,69

12,66

22,2

14,98

13,69

NH4+ (mg/L NH4+)

0,41

0,66

0,38

0,36

0,41

0,66

0,38

0,36

NO2- (mg/L NO2-)

0,02

0,01

0,01

0,01

0,25

0,47

0,32

0,14

0,02

0,01

0,01

0,01

NO3- (mg/L NO3-)

0,25

0,47

0,32

0,14

//

0,25

0,47

0,32

0,14

PO43- (mg/L PO43-)

1,04

0,35

0,69

0,51

//

Quality class

Good

Good

Very good

3.3. Taxonomic Composition of Benthic Macroinvertebrates
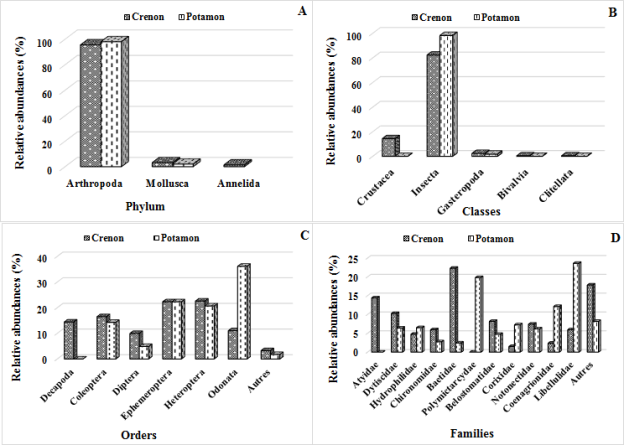
A total of 2,890 benthic macroinvertebrates were recorded in the Lobo River, belonging to three phyla: Arthropoda, Mollusca, and Annelida. These organisms were distributed across 5 classes, 10 orders, 38 families, and 86 genera/species. In the crenon, 673 individuals were collected, composed of 95.51% Arthropods, 3.14% Mollusks, and 1.35% Annelids (Figure 3A). Of the 2,217 individuals collected in the potamon, 98.01% were Arthropods and 1.99% were Mollusks. The class Insecta was the most abundant in the crenon with a relative abundance of 82.31%, followed by Crustacea (14.41%) and Gastropoda (2.38%) (Figure 3B). In the potamon, only Insects (98.24%) and Gastropods (1.76%) were recorded.
Of the 10 orders of BMIs recorded in the stream, Heteroptera were the most abundant at 22.59%; followed by Ephemeroptera (22.29%), Coleoptera (16.49%), Decapoda (14.41%), Odonata (10.99%), and Diptera (9.56%); the other orders accounted for 3.29% of cumulative relative abundance (Figure 3C). In the potamon, Odonata were the most abundant (36.13%), followed by Ephemeroptera (22.28%), Heteroptera (20.66%), Coleoptera (14.30%), and Diptera (4.87%), while other orders accounted for 1.76% of cumulative relative abundance.
Regarding families, Baetidae (22.29%) were most abundant in the crenon, followed by the Atyidae (14.41%), Dytiscidae (10.25%), Belostomatidae (8.17%), Notonectidae (7.43%), Libellulidae (5.94%), and Chironomidae (5.94%) (Figure 3D). In the potamon, the most abundant was Libellulidae at 23.59%, followed by Polymictarcidae (19.80%), Coenagrionidae (12.13%), Hydrophilidae (6.50%), Dytiscidae (6.41%), and Notonectidae (6.18%).
Figure 3. Distribution of the relative abundance of benthic macroinvertebrates identified in the Lobo River during the study period. A. Phylum; B. Classes; C. Orders; D. Families. Note: Only families representing more than 5% of relative abundance are shown.
3.4. Sampling Success
The highest (87.9%) and lowest (82.06%) sampling success rates were obtained at L3 and L1, respectively, using the Bootstrap estimator (Table 2). Across seasons, the highest success rate (91.28%) was obtained during the SDS and the lowest (88.37%) during the LDS using the same estimator.
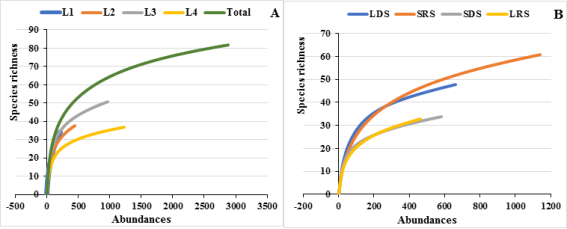
The trend in species richness as a function of BMI abundance indicates that the stream has been sampled almost exhaustively; the plateau suggests that the data are approaching the actual species richness of the habitat (Figure 4A). The L3 curve lies above the other curves, indicating greater species richness at this station. The L1 curve has a slope nearly identical to that of L3, but its species richness is lower, indicating that additional sampling effort is required. Analysis of the seasonal species rarity curves (Figure 4B) shows that the SRS curve tends to reach the saturation plateau. This curve lies above the others, indicating higher species richness compared to other seasons.
Table 2. Sampling success using non-parametric estimators of species richness at stations and across seasons.

Nonparametric estimators

Stations

Seasons

L1

L2

L3

L4

LDS

LRS

SRS

SDS

S

35

38

51

37

48

33

61

34

ACE

46,6 (75,11)

47,16 (80,58)

61,5 (82,93)

44,81 (82,57)

68,5 (70,07)

88 (37,5)

79,21 (77,01)

52 (65,38)

ICE

58,46 (59,87)

64,64 (58,79)

66,11 (77,14)

48,78 (75,85)

63,6 (75,47)

59,56 (55,41)

99,19 (61,5)

48,55 (70,03)

Chao 1

44,71 (78,28)

46,98 (80,89)

61,99 (82,27)

46,33 (79,86)

61,18 (78,46)

55,45 (59,51)

86,48 (70,54)

42,98 (79,11)

Chao 2

54,73 (63,95)

55,54 (68,42)

66,69 (76,47)

44,62 (82,92)

59,48 (80,7)

37 (89,19)

87,77 (69,5)

35,77 (95,05)

Jack 1

52,54 (66,62)

55,54 (68,42)

66,69 (76,47)

48,08 (76,96)

61,5 (78,05)

41,5 (79,52)

85 (71,76)

40,5 (83,95)

Jack 2

63,19 (55,39)

65,41 (58,1)

75,65 (67,42)

52,8 (70,08)

67,5 (71,11)

41,5 (79,52)

97,6 (62,5)

40,5 (83,95)

Bootstrap

42,65 (82,06)

45,81 (82,95)

58,02 (87,9)

42,17 (87,74)

54,32 (88,37)

37,25 (88,59)

71,89 (84,85)

37,25 (91,28)

MM Means

67,85 (51,58)

65,59 (57,94)

63,96 (79,74)

45,79 (80,8)

65,78 (72,97)

50,53 (65,31)

95,31 (64)

44,52 (76,37)

Legend: LDS. Long Dry Season; LRS. Long Rainy Season; SRS. Short Rainy Season; SDS. Short Dry Season; S. Observed species richness; the capture success rate is given in parentheses. The maximum and minimum sampling success rates are indicated by the numbers in bold.
Figure 4. Specific accumulation curves showing the increase in specific abundance as a function of sampling effort at stations and seasons.
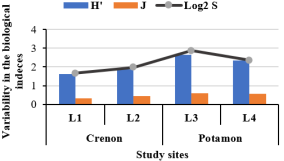
The Shannon-Weaver index (H’) ranged from 0 bits/ind (L1) to 3.21 bits/ind (L2) in the crenon and averaged 1.80 ± 0.17 bits/ind (Figure 5). In the potamon, it ranged from 0.24 bits/ind. (L4) to 4.04 bits/ind. (L3) and averaged 2.61 ± 0.18 bits/ind. This index differed significantly between L1 and L3 (ANOVA test, p = 0.00). Pielou’s J-index of equitability fluctuated between 0.81 and 5.91 (L2) in the crenon, with a mean of 0.39 ± 0.06, and from 0.18 to 0.82 (L4), with a mean of 0.59 ± 0.04, in the potamon (Figure 5). A significant difference was observed between L1 and L3 (ANOVA test, p = 0.04).
Figure 5. Variation in the Shannon-Weaver diversity index, Pielou’s evenness, and Log2 S at the different study sites; S. species.
3.5. Bioindicator Species
IndVal showed that at the 5% threshold, the following species are potentially indicator: Caridina africana and Phyllomacromia bifasciata (L1), Micronecta sp., Tramea transmarina (L3), Canas macateei (L4), and Notonecta sp. (SRS) (Table 3). No bioindicator species were identified at station L2 or during the LDS, SDS, and LRS.
3.6. Principal Component Analysis (PCA)
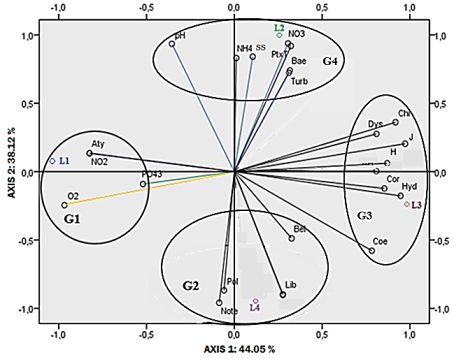
The PCA showed that the first two dimensions explain 78.64% of the variation observed in the aquatic macroinvertebrate community (Figure 6). The negative portion of axis 1 (G1) is correlated with dissolved oxygen, NO2-, PO43-, and organisms of the Atyidae family; waters with these characteristics are found at L1. The negative part of axis 2 (G2) is correlated with Belostomatidae, Polymictarcyidae, Noteridae, and Libellulidae, which are found predominantly at L4. The positive part of axis 1 (G3) is correlated with Dytiscidae, Chironomidae, Corixidae, and Coenagrionidae, which were more abundant at L3. The positive part of axis 2 (G4) is correlated with pH, NH4+, SS, turbidity, and L2, where Baetidae were predominantly recorded.
Table 3. Indicator values for benthic macroinvertebrate taxa of the crenon and potamon of the Lobo River during the study period.

Taxa

Sites

Stations/ season

Specificity (%)

Loyalty (%)

Indicative Value (%)

pvalue

Caridina africana

Crenon

L1

100

75.00

86.60

0.036

Phyllomacromia bifasciata

L1

100

75.00

86.60

0.036

Micronecta sp.

Potamon

L3

80.70

100

89.80

0.014

Tramea transmarina

L3

100

75.00

86.60

0.026

Canas macateei

L4

87.50

75.00

81.00

0.044

Notonecta sp.

//

SRS

100

75.00

86.60

0.036

Figure 6. Principal Component Analysis performed on the families of benthic macroinvertebrates collected at the stations during the study.

Acronyms: G1. Group 1; G2. Group 2; G3. Group 3; G4. Group 4; Cor. Corixidae; Hydr. Hydraenidae; Coe. Coenagrionidae; Cana. Canidae; Lib. Libellulidae; Dys. Dytiscidae; Hyd. Hydrophilidae; Note. Noteridae; Bae. Baetidae; Poly. Polymictarcyidae; Bel. Belostomatidae; H. Shannon and Weaver; J. Pielou’s evenness.
4. Discussion
4.1. Physicochimical Parameters
The saturation of dissolved oxygen in the water was lower in the potamon. Indeed, the demand for dissolved oxygen to break down organic matter at this site is likely high due to direct sunlight on the water surface and the decomposition of submerged trees following the construction of the Mekin Dam. According to Sambraus et al. , dissolved oxygen levels in water are lower in waters exposed to sunlight, and physical phenomena that contribute to water warming can further reduce these levels. Nwaha et al. , Menbohan et al. , and Dzavi observed low oxygen levels in a watercourse that had received a large amount of decomposing organic matter in the same ecological zone.
The values for pH, TSS, turbidity, NH4+, NO2-, and NO3- were low throughout the study and did not differ significantly between the crenon and the potamon. The water is therefore considered to be of good physicochemical quality owing to the forested nature of the Lobo River. According to Rodier et al. , Betsi and Melle Epounde , in a healthy stream, the pH is slightly acidic to basic, ranging between 6 and 9 pH units, SS levels are low, the water is not very turbid, and nutrients are present in low concentrations. Low nutrient concentrations were reported by Gwos Nhiomock and Nwaha et al., in the humid forest ecological zone. These parameters fall into the “good” quality class for biological assessement, drinking water production, and livestock watering . These parameters differ from those obtained by Dzavi in the Nyong watershed. Orthophosphate levels were higher in the crenon at L1, which could be explained by the use of detergents for domestic activities at the station. According to CEAEQ , phosphorus in natural waters comes mainly from the use of detergents, however waters can also become enriched with orthophosphates from the soils they flow through and from leached rocks.
4.2. Benthic Macroinvertebrates
The aquatic fauna is characterized by the presence of crustaceans of the family Atyidae, specifically Caridina africana in the crenon (14.41%), and their absence in the potamon. With an indicator value of 86.60%, this species was 100% specific and 75% faithful to L1. The presence of dense canopy cover, biodegradable plant material, a sandy-silty substrate, and low water mineralization in the crenon may explain this abundance. According to Tachet et al. , crustaceans are often found in the leaf litter, which serves as food and shelter from predators. Betsi identified Caridina africana as a bioindicator at sites with similar characteristics. The order Odonata was less abundant in the crenon (10.99%) than in the potamon (33.13%). Similarly, the family Libellulidae was less abundant in the crenon (5.94%) than in the potamon (23.59%). These low abundances are likely linked to the near absence of macrophytes in the crenon due to the presence of canopy cover. Dzavi, Schriever et al. and Milot noted that odonates tend to thrive in sites with high macrophyte potential, as these provide favorable egg-laying sites and conditions for the rapid development of their larvae . The odonate Phyllomacromia bifasciata was 100% specific and 75% faithful to L1 (IndVal = 86.60%, p = 0.036). The L1 site indeed offers favorable environmental conditions, as this species prefers sandy-silty sediments and leaf litter .
The species richness obtained at each station was lower than the theoretical species richness estimated using non-parametric estimators. However, the species accumulation curves at each station reveal that sampling efforts were sufficient to discover the majority of species present at those sites. According to Longino and Wandji et al., as sampling effort increases in a given habitat, a saturation threshold is reached, and species richness changes little with the addition of new species . Thus, the species recorded at each station is representative of the crenon and potamon of the Lobo River and generally indicates a satisfactory sampling effort (87.90%, L3, and 91.28%, SDS); however, additional effort would have been needed at all stations to reach 100%.
The Shannon-Weaver index across all stations was low suggesting low overall diversity. According to Simboura and Zenetos, a habitat with a Shannon-Weaver index between 1.5 and 3 bits/ind. is considered poor and moderately polluted . This result differs from that of Nwaha et al. , who obtained diversity values greater than 3 bits/ind. in the forested part of the rainforest zone, and is similar to those obtained by Lactio et al. in the urban part of the same ecological zone.
The PCA analysis reveals a predominance of pollution-sensitive taxa from the family Atyidae in the crenon (L1), while pollution-sensitive taxa from the family Polymictarcyidae were more abundant in the potamon (L4). The dominance of Polymictarcyidae could be explained by the abundance of large woody debris at this site, as these organisms are burrowers found in large rivers that dig tunnels in their substrates . Allouko and Kouame Affoue report the presence of Polymictarcyidae in the Ahgien lagoon and the Sassandra River basin in Côte d’Ivoire, respectively, both of which are subject to the same seasonal variations as the Lobo River .
5. Conclusion
Based on the studies conducted in the crenon and potamon of the Lobo River, it appears that the waters of the crenon are slightly more oxygenated and turbid, with slightly higher pH, nitrogen forms, and orthophosphate values than those of the potamon. The levels of these variables fall within the “good quality” class, favorable for the development of aquatic organisms, the production of drinking water, and animal watering. In terms of fauna, the crenon is characterized by the presence of the indicator species Caridina africana and Phyllomacromia bifasciata, which are absent from the potamon. The potamon is characterized by the presence of Polymictarcyidae, which are absent from the crenon. Libellulidae present at both sites, are less abundant in the crenon due canopy cover. Micronecta sp., Tramea transmarina, and Canas macateei are identified as bioindicators of the potamon, and Notonecta sp. as a bioindicator of the short rain season. The Shannon-Weaver diversity index indicates low diversity across sites, with communities comprising both pollution-sensitive organisms (Atyidae and Polymictarcyidae) and pollution-tolerant organisms (Libellulidae and Belostomatidae), as revealed by PCA.
Abbreviations

BMI

Benthic Macroinvertebrate

SS

Suspended Solid

PCA

Principal Component Analysis

LDR

Long Dry Season

LRS

Long Rainy Season

SDS

Small Dry Season

SRS

Small Rainy Season

Acknowledgments
The authors would like to thank: the village Chief of Mekin, M. ZE MVODO Celestin, and his mother for their welcome, hospitality, and guidance in the field; Mr. Hilaire, the canoeist, for facilitating access to the sampling sites; Mr. NOUTADIE for his assistance with laboratory analyses; and Mr. SEGUE Willy for mapping the study area.
Author Contributions
Boudem Tsane Cecile Rita: Conceptualization, Data curation, Formal Analysis, Methodology, Resources, Software, Visualization, Writing – original draft, Writing – review & editing
Nonga Tang Brillant: Data curation, Investigation, Methodology
Zebaze Togouet Serge Hubert: Conceptualization, Project administration, Resources, Supervision; Validation, Writing – review & editing
Data Availability Statement
The data is available from the corresponding author upon reasonable request.
Conflicts of Interest
The authors declare no conflicts of interest.
Appendix
Table A1. SEQ-Eau Grid (MEDD and AE, 2003).

Aptitude level

Blue

Green

Yellow

Orange

Red

Aptitude Index

80

60

40

20

Biology

Dissolved oxygen (%)

90

70

50

30

20

NH4+ (mg/L NH4+)

0.5

1.5

4

8

10

NO2- (mg/L NO2-)

0.03

0.3

0.5

1

2

NO3- (mg/L NO3-)

2

>2

PO43- (mg/L PO43-)

0.1

0.5

1

2

>2

pH (UC)

8

8.5

9

9.5

>9.5

SS (mg/L)

25

50

100

150

>150

Turbidity (FTU)

15

35

70

100

>100

Drinking Water Production

Dissolved oxygen (%)

70

50

30

20

NH4+ (mg/L NH4+)

0.5

1.5

4

6

NO3- (mg/L NO3-)

50

>50

SS (mg/L)

2

50

2000

5000

>5000

Turbidity (FTU)

1

35

1500

3750

>3750

Color (Pt.Co)

15

20

100

200

>200

Transparency (cm)

600

100

10

5

< 5

Watering animals

NO2- (mg/L NO2-)

0.1

30

>30

NO3- (mg/L NO3-)

50

450

>450

Assessment

Very good

Good

Critical

Bad

Very bad

References
[1] UNESCO PHI, Plan strategique du Programme hydrologique intergouvernemental de l’UNESCO: la science pour un monde où la securite de l’eau est assuree dans un environnement en mutation, neuvième phase 2022-2029. Available from:
[2] UNESCO, Rapport mondial des Nations Unies sur la mise en valeur des ressources. Available from:
[3] Zalewski, M. (2015). Ecohydrology and Hydrologic Engineering: Regulation of Hydrology-Biota Interactions for Sustainability. Journal of Hydrologic Engineering. Available from:
[4] Touzin, D. (2008). Utilisation des macroinvertebres benthiques pour evaluer la degradation de la qualite de l’eau des rivières au Quebec. These d’ingenieur agronome, Canada.
[5] Gwos Nhiomock, S. R. (2024). Bioecologie des macroinvertebres benthiques dans quelques cours d’eau de la Region de l’Est Cameroun. These de Doctorat Ph/D, Universite de Yaounde I, Cameroun.
[6] Harissou, Biodiversite des macroinvertebres benthiques des cours d’eau côtiers dans la zone de Kribi (region du Sud Cameroun). These de Doctorat Ph/D, Universite de Yaounde I, Cameroun, 2025.
[7] Lactio, N. L. Foto Menbohan, S. Edoa Owona, D. F. Dzavi, J. Zamboa, B. G. Zemo Temgoua, M. A. and Tchouta, G. U. (2026). Ecological health status of some watercourses in the Mfoundi Watershed, Yaounde (Central Cameroon): Structure of the benthic macroinvertebrate community and water quality. Hydrobiological Research, 4(1), 1-13,
[8] Barbour, M. T. Gerritsen J. Snyder, B. D. and James B. (1999). Stribling, Rapid Bioassessment Protocols for Use in Streams and Wadeable Rivers: Periphyton, Benthic Macroinvertebrates and Fish, Second Edition. EPA 841-B-99-002. U.S. Environmental Protection Agency; Office of Water; Washington, D. C.
[9] Nwaha, M. Biram a Ngon, E. B. Dzavi, J. Mbongue, S. R. and Melle Epounde, A. C. (2026). Distribution of Benthic Macroinvertebrates in Some Rivers of the Ntem Basin in Southern Cameroon. Ecological Evolutionary Biology, 11(1), 111.
[10] Moisan, J. and Pelletier, L. (2008). Guide de surveillance biologique basee sur les macroinvertebres benthiques d’eau douce du Quebec – Cours d’eau peu profonds à substrat grossier, 1st ed. Quebec.
[11] Dion, M. (2009). Le suivi de l’integrite ecosystemique sur le territoire quebecois : emplacement et avancement sur l’echiquier environnemental international. in Centre universitaire de formation en environnement. Quebec, Canada.: Universite de Sherbrooke.
[12] Moanono, P. G. T. (2012). Structure des communautes des macroinvertebres benthiques de quelques mangroves du littoral camerounais : influence des facteurs environnementaux. These de Doctorat Ph/D, Universite de Yaounde I, Cameroun.
[13] Mamert, O. Ernest, K. Alain, N. P. Arfao T. A. Nectaire Lie, N. T. Simeon, T. Emmanuel Cedric, M. and Serge Hubert, Z. T. (2020). Effect of Bridge Construction Works on the Structure of Macroinvertebrates of Two Forest Streams in the Coastal Zone of Cameroon,” Journal of Ecology Natural Resources, 4(7).
[14] Foto Menbohan, S. Dzavi, J. Kenfack Nzongang, C. Biram à Ngon, E. B. and Ntchantcho, R. (2019). Impact of the anthropogenic activities on the diversity and structure of benthic macroinvertebrates in tropical forest stream. International Journal of Progressive Sciences and Technologies, 15(1), 280-292.
[15] Foto Menbohan, S. Nwaha, M. Biram a Ngon, E. B. Dzavi, J. Boudem, R. C. Sob Nangou, P. B. and Nyame Mbia, D. L. (2021). Water quality and benthic macroinvertebrates of tropical forest stream in south-west region, Cameroon. International Journal of Progressive Sciences and Technologies, 25(1), 183-192.
[16] Foto Menbohan, S. Harissou, and Ajeagah G. A. (2022). Biodiversite des macroinvertebres benthiques de quelques cours d’eau cotiers de la region du Sud Cameroun, 3(15).
[17] Biram a Ngon, E. B. Ndjama, J. Chinche Belenfe, S. Dzavi, J. Nwaha, M. Nyame Mbia, D. L. Melle Epoundi, C. Betsi, W. C. and Foto Menbohan, S. (2024). Ecological Influence of Organic Pollution on the Distribution of Benthic Macroinvertebrates in Some Control Forest Watercourses in Cameroon. European, Journal of Theoretical and Applied Science, 2(2), 597-604.
[18] Betsi, W. C. N. (2025). Structure du peuplement des macroinvertebres benthiques de cours d’eau en sol volcanique du Moungo (Region du Littoral, Cameroun), et influence des facteurs abiotiques. These de Doctorat Ph/D, Yaounde I, Cameroun.
[19] Nwaha, M. (2023). Influence de quelques facteurs environnementaux sur la distribution des macroinvertebres benthiques de quelques cours d’eau du departement de la Mvila, region du Sud Cameroun. These de Doctorat Ph/D, Universite de Yaounde I, Cameroun.
[20] Dzavi, J. (2024). Etat ecologique de quelques cours d’eau du bassin du Nyong au Cameroun: diversite des macroinvertebres benthiques et des hyphomycetes aquatiques, decomposition de la litière et physico-chimie des eaux. These de doctorat Ph/D, Universite de Yaounde I, Cameroun.
[21] Nchuaji Tang, Suh, E. C. Nchinda, V. and Ajebesone Ngome, F. (2022). Cartographie des acteurs et des pratiques de l’agroecologie au Cameroun, Institut de Recherche Agricole pour le Developpement. in IRAD. Cameroun.
[22] Olivry, J. (1986). Fleuves et rivieres du Cameroun. Office de la recherche scientifique et technique d’outre-mer. in Monographies hydroliques ORSTOM, no. 9.
[23] APHA (American Public Health Association). (1998). Standard method for examination of water and wastewater., 20th edition. Washington. DC.
[24] Rodier, J. Legube, B. Marlet, N. and Brunet, R. (2009). L’analyse de l’eau, Dunod. Paris, France.
[25] Usseglio-Polatera, P. Wasson, J. and Archaimbault, V. (2009). Protocole experimental d’echantillonnage des « macro- invertebres » en cours d’eau profond. Appui scientifique a la Mise en œuvre de la Directive Cadre Europeenne sur l’Eau.
[26] CCME (Conseil Canadien des Ministres de l’Environnement). (2011). Manuel des protocoles d’echantillonnage pour l’analyse de la qualite de l’eau au Canada. Available from:
[27] Durand, J. and Leveque, C. (1981). Flore et faune aquatiques de l’Afrique Sahelo-soudanienne, ORSTOM. Paris.
[28] De Moor I. and Day, J. (2002). Guides to the Freshwater Invertebrates of Southern Africa, Volume 6 : Arachnida & Mollusca. Chapter 3: Mollusca. Water Research Commission, Pretoria, South Africa, TT 182/02.
[29] De Moor, I. Day, J. and De Moor, F. (2003a). Guides to the Freshwater Invertebrates of Southern Africa, Volume 7 : Insecta I. Ephemeroptera, Odonata & Plecoptera, Pretoria, South Africa, Water Research Commission TT 207/03, 2003a.
[30] De Moor, I. Day, J. and De Moor, F. (2003b). Guides to the Freshwater Invertebrates of Southern Africa, Volume 8 : Insecta II. Hemiptera, Megaloptera, Neuroptera, Tricoptera & Lepidoptera, Pretoria, South Africa, Prepared for the Water Research Commission, WRC TT214/03.
[31] Martin P. and Aït Boughrous, A. (2012). Guide taxonomique des oligochetes dulçaquicoles du Maghreb, NUR 910., vol. 12. in Abc Taxa, vol. 12. Bruxelles, Belgique.
[32] Tachet, H. Richoux, P. Bournaud, M. and Usseglio-Polatera, P. (2006). Invertebres d’eau douce : systematique. Biologie et ecologie, CNRS. Paris.
[33] Robert, K. C. Estimates: Statistical Estimation of Species Richness and Shared Species from Samples. User’s Guide and Application. Available from:
[34] Dufrene, M. and Legendre, P. (1997). Species assemblages and indicator species: the need for a flexible asymmetrical approach. Ecological Monographs, 67, 345-366.
[35] De Caceres, M. and Legendre, P. (2009). Associations between species and groups of sites: indices and statistical inference,” Ecology. Available from:
[36] R Core Team, A language and environment for statistical computing. (2015). Vienna, Austria.
[37] IBM Corp, IBM SPSS Statistics for Windows. (2011). IBM Corp, Armonk, New York.
[38] Harmmer, O. Harper, D. and Ryan, P. (2014). PAST: Paleontological Statistics Software Package for Education and Data Analysis. Palaeontologia Electronica, 4(1), 1-9.
[39] Sambraus, F. Remen, M. Olsen, R. E. Hansen, T. J. Waagbø, R. Torgersen, T. Lock, E. J. Imsland, A. Fraser, T. W. K. and Fjelldal, P. G. (2018). Changes in water temperature and oxygen: the effect of triploidy on performance and metabolism in large farmed Atlantic salmon. Aquaculture Environment Interactions, 10, 157-172.
[40] Melle Epounde, A.-C. (2025). Diversite des macroinvertebres benthiques des cours d’eau de trois zones inondables à Yaounde (Ezazou, Ngoa-ekelle et Ahala) et importance des variables physico-chimiques. These de doctorat Ph/D, Universite de Yaounde I, Cameroun.
[41] MEDD et AE (Ministere de l’Environnement et du Developpement Durable et Agence de l’Eau). (2003). Systeme d’evaluation de la qualite de l’eau des cours d’eau : grilles d’evaluation, vol. 2. in Seq-Eau, Agences de l’Eau, vol. 2.
[42] CEAEQ (Centre D’expertise En Analyse Environnementale Du Quebec). (2016). Determination des orthophosphates dans l’eau : methode colorimetrique automatisee à l’acide ascorbique. in MA. 303 – P 1.1, Rev. 2, Ministere du Developpement durable, de l’Environnement et de la Lutte contre les changements climatiques.
[43] Pestana, I. A. Meneguelli-Souza, A. C. Gomes, M. A. C. Almeida M. G. Suzuki, M. S. Vitoria, A. P. and Souza, C. M. M. (2018). Effects of a combined use of macronutrients nitrate, ammonium, and phosphate on cadmium absorption by Egeria densa Planch. and its phytoremediation applicability. Aquatic Ecology, 52(1), 51-64.
[44] Schriever, T. A. Bogan, T. Boersma, M. Cañedo-Argüelles, K. S. Jaeger, M. Olden, K. L. and Lytle, D. A. (2015). Hydrology shapes taxonomic and functional structure of desert stream invertebrate communities. Freshwater Science, 34(2)
[45] Milot, S. (2020). Suivi de la sante biologique du ruisseau de la Chute. in Federation des lacs de Val-des-Monts.
[46] Djene Kouakou, R. (2020). Diversite des macro-invertebres et leur utilisation dans l’evaluation de la qualite ecologique des ecosystèmes aquatiques urbains de Daloa (centre Ouest, Côte d’Ivoire). These de Doctorat, Universite Jean Lorougnon Guede, Côte d’Ivoire.
[47] Longino, J. (2000). What to do with the data, Smithonian Institution Press. in In Agosti, D. Majer, J. D. Alonso, l. E. Schultz, t. r., (eds.). Ants: standard methods for measuring and monitoring biodiversity. Washington, DC.
[48] Wandji, A. C. Kekeunou, S. Nzike, M. M. Noutchoum, A. S. and Fomena, A. (2019). Grasshopper (Orthoptera: Acrididea) assemblages in forests and savanna areas in Center, West and South-west regions of Cameroon. Journal of Insect Biodiversity, 12(1), 17-32.
[49] Simboura, N. and Zenetos, A. (2002). Benthic indicators to use in ecological quality classification of Mediterranean soft bottoms marine ecosystems, including a new biotic index. Mediterranean Marine Science, 3(2), 77-111.
[50] Usseglio-Polatera P. and Bournaud, M. (1989). Les Tricopteres et les Ephemeropteres comme indicateurs des changements environnementaux du Rhone à Lyon au cours des vingt-cinq dernières annees, Recherche et Gestion des Rivieres Regulees, 4(3), 249-262.
[51] Allouko, J.-R. (2019). Diversite des communautes de macroinvertebres et contribution à l’evaluation de la qualite des eaux de la lagune Aghien (Sud-est, Cote d’Ivoire). These de Doctorat, Universite Jean Lorougnon Guede, Côte d’Ivoire.
[52] Kouame Affoue, H. (2025). Diversite des macroinvertebres aquatiques et qualite ecologique des lacs Buyo et Dohou, dans le bassin du fleuve Sassandra (Ouest, Cote d’Ivoire). These de Doctorat, Universite Jean Lorougnon Guede, Cote d’Ivoire.
Cite This Article
  • APA Style

    Rita, B. T. C., Brillant, N. T., Hubert, Z. T. S. (2026). Physicochemical Characteristics and Macroinvertebrate Communities of the Crenon and Potamon of the Lobo River in the Rainforest Zone of Cameroon. Ecology and Evolutionary Biology, 11(3), 79-91. https://doi.org/10.11648/j.eeb.20261103.14

    Copy | Download

    ACS Style

    Rita, B. T. C.; Brillant, N. T.; Hubert, Z. T. S. Physicochemical Characteristics and Macroinvertebrate Communities of the Crenon and Potamon of the Lobo River in the Rainforest Zone of Cameroon. Ecol. Evol. Biol. 2026, 11(3), 79-91. doi: 10.11648/j.eeb.20261103.14

    Copy | Download

    AMA Style

    Rita BTC, Brillant NT, Hubert ZTS. Physicochemical Characteristics and Macroinvertebrate Communities of the Crenon and Potamon of the Lobo River in the Rainforest Zone of Cameroon. Ecol Evol Biol. 2026;11(3):79-91. doi: 10.11648/j.eeb.20261103.14

    Copy | Download

  • @article{10.11648/j.eeb.20261103.14,
      author = {Boudem Tsane Cecile Rita and Nonga Tang Brillant and Zebaze Togouet Serge Hubert},
      title = {Physicochemical Characteristics and Macroinvertebrate Communities of the Crenon and Potamon of the Lobo River in the Rainforest Zone of Cameroon},
      journal = {Ecology and Evolutionary Biology},
      volume = {11},
      number = {3},
      pages = {79-91},
      doi = {10.11648/j.eeb.20261103.14},
      url = {https://doi.org/10.11648/j.eeb.20261103.14},
      eprint = {https://article.sciencepublishinggroup.com/pdf/10.11648.j.eeb.20261103.14},
      abstract = {A study of the physicochemical water quality and the diversity of Benthic Macroinvertebrates (BMIs) in the Lobo River was conducted to characterize its upper and lower reaches. Sampling was carried out between May 2020 to May 2021 across four stations (two in the crenon and two in the potamon), using standard methods for physicochemical analyses. BMIs were collected with a 30-cm square, 400-µm mesh dip net over a 100-meter stretch at each station, following the multi-habitat method. Physicochemical parameters were generally low and homogeneous between the crenon and potamon (p > 0.05), with recorded values for dissolved oxygen (61.23 ± 4.37%), turbidity (17.43 ± 2.15 FTU), and suspended solids (16.81 ± 2.29 mg/L); nitrogen forms (0.54 ± 0.08 mg/L NH4+; 0.36 ± 0.18 mg/L NO3-) and orthophosphates (0.85 ± 0.37 mg/L PO43-) being higher in the crenon (L2), whereas nitrites were lower at that zone (0.012 ± 0.004 mg/L NO2-). A total of 86 BMIs species belonging to 3 phyla, 5 classes, 10 orders, and 38 families were recorded. Key bioindicators recorded were: Caridina nilotica and Phyllomacromia bifasciata in the crenon; Micronecta sp., Tramea transmarina, and Canas macateei in the potamon. The Shannon-Weaver diversity index indicated sites with low diversity encompassing both pollution-sensitive (Atyidae and Polymictarcyidae) and pollution-tolerant (Libellulidae and Belostomatidae) organisms, as revealed by Principal Component Analysis (PCA).},
     year = {2026}
    }
    

    Copy | Download

  • TY  - JOUR
    T1  - Physicochemical Characteristics and Macroinvertebrate Communities of the Crenon and Potamon of the Lobo River in the Rainforest Zone of Cameroon
    AU  - Boudem Tsane Cecile Rita
    AU  - Nonga Tang Brillant
    AU  - Zebaze Togouet Serge Hubert
    Y1  - 2026/08/22
    PY  - 2026
    N1  - https://doi.org/10.11648/j.eeb.20261103.14
    DO  - 10.11648/j.eeb.20261103.14
    T2  - Ecology and Evolutionary Biology
    JF  - Ecology and Evolutionary Biology
    JO  - Ecology and Evolutionary Biology
    SP  - 79
    EP  - 91
    PB  - Science Publishing Group
    SN  - 2575-3762
    UR  - https://doi.org/10.11648/j.eeb.20261103.14
    AB  - A study of the physicochemical water quality and the diversity of Benthic Macroinvertebrates (BMIs) in the Lobo River was conducted to characterize its upper and lower reaches. Sampling was carried out between May 2020 to May 2021 across four stations (two in the crenon and two in the potamon), using standard methods for physicochemical analyses. BMIs were collected with a 30-cm square, 400-µm mesh dip net over a 100-meter stretch at each station, following the multi-habitat method. Physicochemical parameters were generally low and homogeneous between the crenon and potamon (p > 0.05), with recorded values for dissolved oxygen (61.23 ± 4.37%), turbidity (17.43 ± 2.15 FTU), and suspended solids (16.81 ± 2.29 mg/L); nitrogen forms (0.54 ± 0.08 mg/L NH4+; 0.36 ± 0.18 mg/L NO3-) and orthophosphates (0.85 ± 0.37 mg/L PO43-) being higher in the crenon (L2), whereas nitrites were lower at that zone (0.012 ± 0.004 mg/L NO2-). A total of 86 BMIs species belonging to 3 phyla, 5 classes, 10 orders, and 38 families were recorded. Key bioindicators recorded were: Caridina nilotica and Phyllomacromia bifasciata in the crenon; Micronecta sp., Tramea transmarina, and Canas macateei in the potamon. The Shannon-Weaver diversity index indicated sites with low diversity encompassing both pollution-sensitive (Atyidae and Polymictarcyidae) and pollution-tolerant (Libellulidae and Belostomatidae) organisms, as revealed by Principal Component Analysis (PCA).
    VL  - 11
    IS  - 3
    ER  - 

    Copy | Download

Author Information
  • Abstract
  • Keywords
  • Document Sections

    1. 1. Introduction
    2. 2. Materials and Methods
    3. 3. Results
    4. 4. Discussion
    5. 5. Conclusion
    Show Full Outline
  • Abbreviations
  • Acknowledgments
  • Author Contributions
  • Data Availability Statement
  • Conflicts of Interest
  • Appendix
  • References
  • Cite This Article
  • Author Information