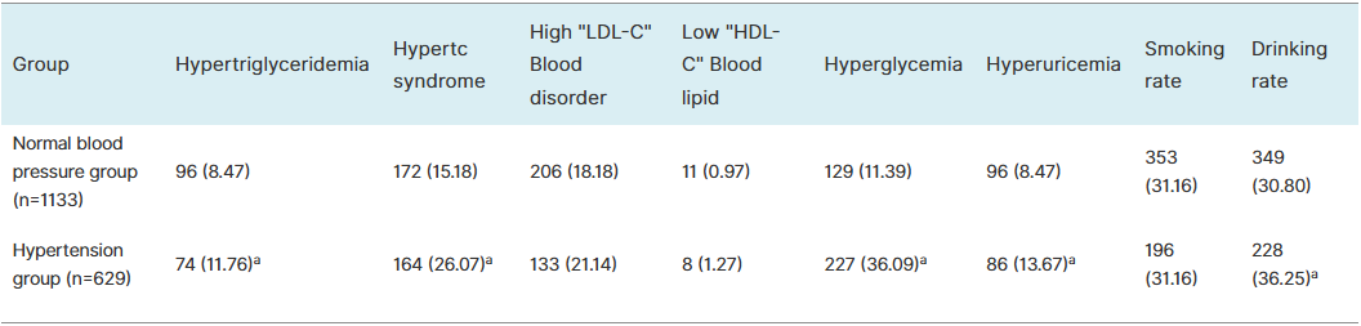
Objective To perform a survey on the current prevalence of hypertension in company employees, so as to improve the awareness rate, treatment rate, and control rate of hypertension, and also to provide theoretical basis for health promotion for all employees. Methods A total of 1762 employees from a company in Wuhu participated in this study. Parameters including height, body mass, blood pressure, blood lipid, blood glucose, and uric acid were measured. Data were collected and statistically analyzed. Results Among the 1762 employees, 629 had hypertension with an overall prevalence rate of 35.70%. The prevalence of hypertension was significantly higher in males than that in females (39.43% vs. 29.17%, P<0.05). And the prevalence rate of hypertension increased with age in both genders. The overall awareness rate, treatment rate, and control rate of hypertension were 69.95%, 56.44% and 29.73%, respectively; these rate were generally lower in males (69.46%, 53.17% and 28.73%) compared with those in females (71.12%, 64.17% and 32.09%), and the difference in treatment rate was statistically significant between males and females (P<0.05). Based on the diagnostic criteria of hypertension, participants were divided into the hypertension group (n=629) and the normotension group (n=1133). The mean age, SBP, DBP, heart rate, body mass index, rate of alcohol use, as well as the detection rates of hypercholesterolemia, hypertriglyceridemia, hyperglycemia, and hyperuricemia in the hypertension group were significantly higher than those in the normotension group (all P<0.05). Conclusion The prevalence rate of hypertension is high, and the awareness rate, treatment rate, and control rate of hypertension are generally low in company employees. It is important to strengthen health education and health knowledge promotion among employees, raise their awareness of hypertension prevention and treatment, and urge them to change their unhealthy eating habit and lifestyle, which may contribute to health promotion for all.
| Published in | European Journal of Preventive Medicine (Volume 13, Issue 5) |
| DOI | 10.11648/j.ejpm.20251305.12 |
| Page(s) | 98-104 |
| Creative Commons |
This is an Open Access article, distributed under the terms of the Creative Commons Attribution 4.0 International License (http://creativecommons.org/licenses/by/4.0/), which permits unrestricted use, distribution and reproduction in any medium or format, provided the original work is properly cited. |
| Copyright |
Copyright © The Author(s), 2025. Published by Science Publishing Group |
Hypertension, Awareness Rate, Treatment Rate, Control Rate
Age (years) | Male | Female | Total | |||
|---|---|---|---|---|---|---|
Case | Prevalence rate (%) | Case | Prevalence rate (%) | Case | Prevalence rate (%) | |
<30 | 3 | 7.32 | 0 | 0.00 | 3 | 6.52 |
30~39 | 52 | 20.63 | 5 | 5.05 | 57 | 16.24 |
40~49 | 112 | 30.27 | 34 | 13.33 | 146 | 23.36 |
50~59 | 89 | 51.74 | 47 | 40.87 | 136 | 47.39 |
>60 | 186 | 65.03 | 101 | 60.48 | 287 | 63.36 |
Total | 442 | 39.43 | 187 | 29.17 | 629 | 35.70 |
Gender | SBP (mmHg) | DBP (mmHg) | Heart rate (beats/min) | BMI (kg/m2) |
|---|---|---|---|---|
Male (n=1121) | 124.23±18.11 | 79.98±10.81 | 75.59±9.26 | 24.70±3.07 |
Famale (n=641) | 121.23±17.31a | 75.67±9.65a | 75.93±9.11 | 23.41±3.49a |
Age (years) | Male | Female | ||
|---|---|---|---|---|
SBP (mmHg) | DBP (mmHg) | SBP (mmHg) | DBP (mmHg) | |
<30 | 116.51±10.45 | 77.93±6.95 | 108.00±8.37 | 72.00±7.58 |
30~39 | 118.57±15.37 | 78.56±10.30 | 111.57±10.75 | 71.87±7.80 |
40~49 | 120.64±15.08 | 80.22±10.97 | 115.89±14.39 | 74.98±9.28 |
50~59 | 125.36±17.40 | 82.16±11.39 | 125.17±19.15 | 78.87±10.78 |
>60 | 134.29±20.82 | 79.91±10.95 | 132.79±16.34 | 76.87±9.59 |
Group | Age (years) | SBP (mmHg) | DBP (mmHg) | Heart rate (beats/min) | BMI (kg/m2) |
|---|---|---|---|---|---|
Normal blood pressure group (n=1133) | 46.37±11.72 | 114.64±11.11 | 74.37±7.70 | 74.58±8.45 | 23.62±3.18 |
Hypertension group (n=629) | 57.97±14.08a | 138.44±17.58a | 85.69±11.22a | 77.75±10.11a | 25.34±3.19a |
Age (years) | Normal blood pressure group (n=1133) | Blood pressure group (n=629) | ||
|---|---|---|---|---|
SBP (mmHg) | DBP (mmHg) | SBP (mmHg) | DBP (mmHg) | |
<30 | 114.77±10.33 | 76.30±6.32 | 127.33±4.62a | 91.33±2.31a |
30~39 | 112.75±10.10 | 73.97±7.74 | 136.40±17.70a | 90.63±9.41a |
40~49 | 113.51±10.72 | 74.38±7.94 | 135.74±14.33a | 90.25±9.15a |
50~59 | 115.10±11.72 | 74.99±7.54 | 136.59±17.19a | 87.34±11.13a |
>60 | 120.81±11.48b | 74.00±7.34 | 141.21±18.94ab | 81.56±11.14a |
BMI grade | Normal blood pressure group (n=1133) | Hypertension group (n=629) | ||
|---|---|---|---|---|
SBP (mmHg) | DBP (mmHg) | SBP (mmHg) | DBP (mmHg) | |
Emaciated | 110.13±12.23 | 73.39±8.02 | 149.75±21.11c | 82.25±14.63c |
Normal | 112.82±11.04 | 72.77±7.72 | 139.37±16.89ac | 84.76±10.55c |
Overweight | 117.02±10.59ab | 76.37±7.30b | 137.86±17.80ac | 86.58±11.52c |
Obesity | 117.95±10.85ab | 76.93±6.36ab | 137.15±17.51ac | 85.19±11.03c |
BMI | Body Mass Index |
SBP | Systolic Blood Pressure |
DBP | Diastolic Blood Pressure |
LDL-C | Low-Density Lipoprotein Cholesterol |
HDL-C | High-Density Lipoprotein Cholesterol |
| [1] | China Obesity Working Group Guidelines for the Prevention and Control of Overweight and Obesity in Chinese Adults (Excerpt) [J] Chinese Journal of Nutrition, 2004, 26(1): 1-4. |
| [2] | The Revision Committee of the Chinese Hypertension Prevention and Control Guidelines Chinese Guidelines for Hypertension Prevention and Treatment 2010 [J] Chinese Journal of Cardiovascular Diseases, 2011, 39(7): 579-616. |
| [3] | Diabetes Society of the Chinese Medical Association Chinese Guidelines for the Prevention and Treatment of Type 2 Diabetes Mellitus (2010 Edition) [J] Chinese Journal of Diabetes, 2012, 20(1): S1-S37. |
| [4] | Joint Committee for the Formulation of Guidelines for the Prevention and Treatment of Dyslipidemia in Chinese Adults Guidelines for the Prevention and Treatment of Dyslipidemia in Chinese Adults [J] Chinese Journal of Cardiovascular Diseases, 2007, 35(5): 390-419. |
| [5] | Lu Zaiying, Zhong Nanshan. Internal Medicine [M] 7th edition. Beijing: People's Medical Publishing House, 2010: 830-834. |
| [6] | Zhang Xianchuan, Shao Yongqiang. Epidemiological Investigation on the Current Situation and Related Factors of Hypertension among Urban Residents in Wenzhou City [J] Shanghai Journal of Preventive Medicine, 2012, 24(5): 225-228. |
| [7] | Ruan Danjie, Yang Zhengqiang. Epidemiological Investigation and Risk Factor Analysis of Hypertension in Huairou District, Beijing [J] Beijing Medical Science, 2010, 32(7): 516-518. |
| [8] | Yu Zhenqiu. The pathogenesis, diagnosis and treatment of Hyperglycemia in women [J]. Chinese Community Physicians, 2008, 24(13): 24. |
| [9] | Liu Yulian, Zhou Haiyan, Cui Meizi, et al. The Epidemiological status of hypertension and Its Related risk factors in Dehui Area, Jilin Province [J] Journal of Jilin University (Medical Science), 2012, 38(5): 1021-1027. |
| [10] | Li Zhichao, Wang Weiwen, Zhuang Leixue, et al. Epidemiological Study on Hypertension Combined with Cardiovascular Risk Factors among Urban Residents in Chengdu [J] West China Medical Journal, 2014, 29(7): 1201-1204. |
| [11] | Zhang Hongyu, Li Min, Yang Fang. Epidemiological Investigation and Risk Factor Analysis of Hypertension in Jilin Urban Area [J] Chinese and Foreign Medical Studies, 2014, 12(21): 76-78. |
| [12] | Duan Xiufang, Wu Xigui, Gu Dongfeng. The distribution of systolic and diastolic hypertension in adults in China [J] Journal of Hyperhypotension, 2005, 13(8): 500-503. |
| [13] |
Yi Yanjing, Huang Xiaobo, Liu Ya, et al. Epidemiological Study on Hypertension among Middle-aged and Elderly People in Chengdu Area [J] Chinese Journal of Hypertension, 2010, 18(5): 469-473.
https://doi.org/10.16439/j.cnki.1673-7245 . May 24, 2010. |
| [14] | Shao Yongqiang, Wang Jian, Chen Wei, et al. Epidemiological Investigation on the Current Situation and Risk Factors of Hypertension among Residents in 10 Communities of Wenzhou City [J] Chinese Journal of Preventive Medicine, 2010, 11(12): 1270-1273. |
| [15] | EGAN BM, ZHAO YM, AXON RN. US trends in prevalence, awareness, treatment, and control of hypertension, 1988-2008 [J]. JAMA, 2010, 303(20): 2043-2050. |
| [16] | Jiang Liqing, Liang Yanmin, Liu Xiaochen, et al. Epidemiological Investigation and Risk Factor Analysis of Hypertension in Rural Areas of Cangzhou [J] Chinese Journal of Gerontology, 2014, 34(7): 1903-1904. |
| [17] | Pan Xiaojin, Lin Gang, Li Jian, et al. Epidemiological Investigation of Hypertension and Its Main Risk Factors in Rural Areas of Dongtai, Jiangsu Province [J] Modern Preventive Medicine, 2007, 34(22): 4243-4245. |
APA Style
Lianhua, Z. (2025). A Survey on the Current Prevalence of Hypertension in Company Employees. European Journal of Preventive Medicine, 13(5), 98-104. https://doi.org/10.11648/j.ejpm.20251305.12
ACS Style
Lianhua, Z. A Survey on the Current Prevalence of Hypertension in Company Employees. Eur. J. Prev. Med. 2025, 13(5), 98-104. doi: 10.11648/j.ejpm.20251305.12
@article{10.11648/j.ejpm.20251305.12,
  author = {Zhang Lianhua},
  title = {A Survey on the Current Prevalence of Hypertension in Company Employees
},
  journal = {European Journal of Preventive Medicine},
  volume = {13},
  number = {5},
  pages = {98-104},
  doi = {10.11648/j.ejpm.20251305.12},
  url = {https://doi.org/10.11648/j.ejpm.20251305.12},
  eprint = {https://article.sciencepublishinggroup.com/pdf/10.11648.j.ejpm.20251305.12},
  abstract = {Objective To perform a survey on the current prevalence of hypertension in company employees, so as to improve the awareness rate, treatment rate, and control rate of hypertension, and also to provide theoretical basis for health promotion for all employees. Methods A total of 1762 employees from a company in Wuhu participated in this study. Parameters including height, body mass, blood pressure, blood lipid, blood glucose, and uric acid were measured. Data were collected and statistically analyzed. Results Among the 1762 employees, 629 had hypertension with an overall prevalence rate of 35.70%. The prevalence of hypertension was significantly higher in males than that in females (39.43% vs. 29.17%, PConclusion The prevalence rate of hypertension is high, and the awareness rate, treatment rate, and control rate of hypertension are generally low in company employees. It is important to strengthen health education and health knowledge promotion among employees, raise their awareness of hypertension prevention and treatment, and urge them to change their unhealthy eating habit and lifestyle, which may contribute to health promotion for all.
},
 year = {2025}
}
TY  - JOUR
T1  - A Survey on the Current Prevalence of Hypertension in Company Employees

AU  - Zhang Lianhua
Y1  - 2025/09/19
PY  - 2025
N1  - https://doi.org/10.11648/j.ejpm.20251305.12
DO  - 10.11648/j.ejpm.20251305.12
T2  - European Journal of Preventive Medicine
JF  - European Journal of Preventive Medicine
JO  - European Journal of Preventive Medicine
SP  - 98
EP  - 104
PB  - Science Publishing Group
SN  - 2330-8230
UR  - https://doi.org/10.11648/j.ejpm.20251305.12
AB  - Objective To perform a survey on the current prevalence of hypertension in company employees, so as to improve the awareness rate, treatment rate, and control rate of hypertension, and also to provide theoretical basis for health promotion for all employees. Methods A total of 1762 employees from a company in Wuhu participated in this study. Parameters including height, body mass, blood pressure, blood lipid, blood glucose, and uric acid were measured. Data were collected and statistically analyzed. Results Among the 1762 employees, 629 had hypertension with an overall prevalence rate of 35.70%. The prevalence of hypertension was significantly higher in males than that in females (39.43% vs. 29.17%, PConclusion The prevalence rate of hypertension is high, and the awareness rate, treatment rate, and control rate of hypertension are generally low in company employees. It is important to strengthen health education and health knowledge promotion among employees, raise their awareness of hypertension prevention and treatment, and urge them to change their unhealthy eating habit and lifestyle, which may contribute to health promotion for all.

VL  - 13
IS  - 5
ER  -
Employee Health Management Center, Wuhu Electricity Generating Limited Liability Company, Wuhu, China
Information

