Research Article | | Peer-Reviewed

Effects of Implementing E-Procurement on Organizational Performance: The Case of African Union

Received: 14 February 2026     Accepted: 2 March 2026     Published: 10 March 2026
Views:       Downloads:
Abstract

This study examined the effect of e-procurement implementation on organizational performance in the African Union. A descriptive and explanatory research design employing both quantitative and qualitative approaches was adopted. The study targeted 230 employees, from which 146 respondents were selected using simple random sampling. Primary data were collected through structured questionnaires and analyzed using descriptive and inferential statistical techniques with SPSS version 26. Validity and reliability tests were conducted to ensure data quality. The findings revealed a statistically significant positive relationship between e-procurement practices and organizational performance. Regression results further confirmed that e-procurement dimensions significantly predict organizational performance. Among the components, e-tendering emerged as the most dominant practice, while e-sourcing, e- payment, and efficiency also demonstrated positive effects on performance outcomes. Overall, the study concludes that effective implementation of e-procurement enhances organizational performance. The study recommends strengthening e-procurement policies, improving stakeholder participation, and creating a supportive institutional environment to sustain performance improvement.

Published in Innovation Business (Volume 1, Issue 1)
DOI 10.11648/j.ib.20260101.15
Page(s) 55-77
Creative Commons

This is an Open Access article, distributed under the terms of the Creative Commons Attribution 4.0 International License (http://creativecommons.org/licenses/by/4.0/), which permits unrestricted use, distribution and reproduction in any medium or format, provided the original work is properly cited.

Copyright

Copyright © The Author(s), 2026. Published by Science Publishing Group

Keywords

Implementing, E-Procurement, E-Sourcing, E-Tendering, Efficiency, E-Payment, Organizational Performance

1. Introduction
1.1. Background of the Study
Significant changes in the operational condition of an organization's performance have been facilitated by the introduction of electronic procurement as a purchasing method. It is clear from that e-procurement has changed how businesses function. E-procurement, a system of organizational purchasing that relies on a specific information technology and is regarded as the input side of supply chain management, has been established in the current phase of procurement development. The performance of commercial organizations is being developed and improved through the extensive integration of technology such as electronic procurement, in addition to other aspects .
Electronic procurement as the process of obtaining products, services, and information from different businesses via the internet. Electronic procurement is the process of buying products and services online for a company's daily operations and automating the entire process with the ultimate goal of saving money .
In this study, the researcher was identify the extent and content of implementation of e- procurement and explore its contributions in improving organizational performance at different levels. Therefore, in this study to identify the effect of implementation of E- procurement on organizational performance, in the case of Africa union that needs to create a strong inventory management practice for improving organizational performance.
1.2. Statement of the Problem
The procurement department plays a critical role in enhancing organizational efficiency and effectiveness. To address modern operational challenges, organizations increasingly adopt information and communication technology (ICT) to improve procurement processes, reduce operational costs, shorten lead times, enhance transparency, and strengthen supplier relationships. Electronic procurement facilitates online communication, bidding, and automated purchasing processes, thereby improving supply chain coordination and overall organizational performance .
Previous studies indicate that successful e-procurement implementation depends on factors such as implementation cost, management support, user training, system integration, and adequate IT infrastructure. Empirical findings further show that e-procurement adoption improves procurement and financial performance by reducing transaction costs, minimizing unauthorized purchasing, and enabling access to competitive suppliers. However, implementation challenges such as system incompatibility, limited standardization, and user resistance remain significant barriers .
The factors that influence e-procurement adoption in retail, conducting a study of supermarkets managed by retail chains in Kenya, and discovered that change is met with a lot of opposition. A research on Electronic-Procurement and organizational performance: case study of Nakumatti Supermarket in Kampal and the research established the impact of electronic tendering, the relevancy of electronic auctioning and the relationship between electronic procurement and organizational performance. The findings of this study revealed that embracement of electronic procurement contributes to the organization in different ways and that E-tendering contributes organizational performance inform of increasing Profit margins, obtaining products and services of quality cost effectiveness and better service delivery, electronic auctioning is a well-known practice at Nakumatti supermarket and has always been practiced which was indicated by the majority of the respondents in the study who strongly agreed., have lower adoption rates and in his study employed descriptive survey research design .
Although existing studies confirm the positive relationship between e-procurement and organizational performance, limited empirical evidence exists within international and UN-related institutions in developing countries, particularly in Africa and Ethiopia, revealing methodological and contextual research gaps . Therefore, this study examines the effect of e-procurement implementation on organizational performance in the African Union using regression, correlation, and ANOVA analyses.
1.3. Research Question
1) What is the effect of implementation of e-procurement in terms of e-sourcing on organizational performance in the case of Africa union?
2) What is the effect of implementation of e-procurement in terms of e-tendering on organizational performance in the case of Africa union?
3) What is the major contribution of implementing e-procurement in terms improving Efficiency on organizational performance in the case of Africa union?
4) What is major contribution of implementing e-procurement in terms of fulfilling e-payment on organizational performance in the case of Africa union?
5) What is the relationship between implementation of e-procurement and organizational performance in the case of Africa union?
1.4. Objectives of the Study
1.4.1. General Objective
The major objective of this study was to assess the effect of implementation of E- procurement on organizational performance in the case of Africa union.
1.4.2. Gsah Specific Objectives
The specific objectives of this study was
1) To identify the effect of implementation of E- procurement in terms of E-sourcing on organizational performance in the case of Africa union.
2) To investigate the effect of implementation of E- procurement in terms of E-tendering on organizational performance in the case of Africa union.
3) To assess the major contribution of implementation of E- procurement in terms fulfilling Efficiency on organizational performance in the case of Africa union.
4) To identify major contribution of implementation of E- procurement in terms of fulfilling E-payment on organizational performance in the case of Africa union
5) To identify the relationship between implementation of E- procurement and organizational performance in the case of Africa union.
1.5. Significance of the Study
This study examines the effect of e-procurement implementation on organizational performance in the African Union. E-procurement has gained increasing attention among researchers and practitioners as an effective approach for improving operational efficiency, reducing procurement costs, and enhancing service delivery. The findings of this study identify key e-procurement practices that contribute to organizational performance improvement.
The study contributes to existing literature by providing empirical evidence from an international organization context that has received limited research attention. The results are expected to support organizational decision-makers in strengthening e-procurement implementation and serve as a reference for future studies in similar institutional settings.
1.6. Scope of the Study
This study is limited to the African Union due to accessibility and feasibility constraints. It focuses on examining the effect of e-procurement implementation on organizational performance using e-sourcing, e-tendering, e-payment, and procurement efficiency as independent variables. Organizational performance is measured using cost saving, service quality, lead time, and transportation improvement indicators.
2. Litrature Review
2.1. Theoretical Review of E- procurement
Electronic procurement originated in the 1970s through early electronic data transmission systems such as punch cards and data phones. In the mid-1980s, Electronic Data Interchange (EDI) enabled electronic transfer of purchase orders between buyers and sellers . With the expansion of the internet in the 1990s, e-procurement evolved through intranet and internet technologies, improving communication and data exchange efficiency. User-friendly browsers further enhanced adoption across public and private sectors .
Theoretical perspectives explain organizational performance through effective internal processes . Organizational efficiency depends on operational effectiveness . This study evaluates the benefits of e-procurement on performance, particularly efficiency improvements demonstrated in empirical studies . The framework focuses on e-sourcing, e-tendering, and e-payment and their influence on organizational efficiency.
2.1.1. Concept and Definition of E- procurement
E-procurement refers to the application of ICT and internet-based systems to manage procurement activities electronically . It covers the entire procurement cycle from need identification to payment and contract management through digital platforms . Unlike traditional methods, e-procurement relies on integrated internet, intranet, and extranet systems to improve efficiency and reduce administrative costs.
Successful implementation integrates internal workflows with supplier systems, improving coordination and supply chain collaboration . Web-based platforms enhance transaction accuracy, speed, and cost efficiency while strengthening inter-organizational relationships . Strategic purchasing emphasizes long-term supplier relationships, performance monitoring, and measurable indicators to improve financial outcomes .
2.1.2. E- procurement Components
1) E-sourcing
E-sourcing uses digital platforms to identify, evaluate, and select suppliers . It includes tools such as RFI, RFP, and RFQ to facilitate competitive supplier selection . Online negotiations and reverse auctions enhance efficiency and transparency . Effective e-sourcing reduces procurement cycle time, strengthens collaboration, and improves performance .
2) E-tendering
E-tendering involves electronic invitation, submission, evaluation, and awarding of bids . It replaces manual tendering systems, reducing paperwork and administrative inefficiencies . Electronic documentation improves contract management and decision-making .
Organizations adopt e-tendering to reduce costs, shorten sourcing cycles, and enhance communication . Despite challenges such as resistance to change and limited technical skills, e-tendering enhances transparency, accountability, and process accuracy while reducing administrative costs .
3) Efficiency
Efficiency refers to achieving maximum output with minimum resources . E-procurement enhances efficiency by integrating supply chain activities into unified platforms, improving coordination and stakeholder satisfaction. It reduces costs, strengthens quality control, and improves profitability and growth.
Digital systems facilitate real-time exchange of demand forecasts, pricing, and inventory data, enhancing decision- making and logistics coordination . Improved distribution systems reduce delays and operational waste . Standardized electronic procedures further enhance accountability and process control . Globally, e-procurement adoption has improved effectiveness while reducing supply chain costs .
4) E-payment
E-payment enables electronic financial transactions within procurement systems . It connects transaction networks among organizations and suppliers, improving speed and reliability. Compared to traditional payment methods, e- payment reduces transaction risks and processing time . Faster and secure payments enhance service delivery and overall organizational performance .
2.1.3. Benefits of E-Procurement
E-procurement improves flexibility, speed, and accuracy while reducing manual errors and operational waste . Automation enhances efficiency and regulatory compliance through standardized procedures . Real-time procurement data strengthens managerial decision-making and financial control.
Electronic platforms improve negotiation transparency, often resulting in cost reductions . Automation reduces manpower requirements and administrative workload . E-procurement also minimizes corruption and unauthorized spending by increasing transparency and traceability .
Additional benefits include cost savings, enhanced supplier competition, improved ICT capacity, and strengthened long-term competitiveness .
2.1.4. Organization’s Performance and Its Indicators
Organizational performance measures the extent to which goals are achieved across financial and non-financial dimensions . Because no universal measurement exists, studies use both financial and operational indicators for comprehensive assessment .
Common procurement performance indicators include cost savings, supplier quality, delivery reliability, pricing efficiency, and inventory management effectiveness. The relevance of indicators varies across industries and over time.
1) Cost saving
Cost saving occurs when procurement secures lower prices through supplier negotiation, alternative sourcing, or transportation improvements. These savings reflect improved purchasing efficiency.
2) Product Quality
Service quality enhances competitiveness and customer satisfaction, contributing to sustainable performance . Organizational performance also includes customer satisfaction, innovation, and employee relations .
3) Lead time
Lead time is the period between order placement and delivery . It includes information processing and order fulfillment stages. Improved coordination and technology adoption reduce lead time and enhance responsiveness .
4) Transportation Improvements
Where the cost of transporting item from the vendor to the production facilities, the unit cost of the item will when a purchasing department negotiates with a carrier or numbers of carriers to reduce be reduced.This cost saving can be used as measurement of effectiveness.
2.2. Empirical Review
E-procurement and Organizational Performance
Organizations increasingly adopt e-procurement as a core e-business strategy . Digital procurement systems reduce transaction costs, expand sourcing opportunities, and strengthen supply chain coordination.
E-procurement improves B2B purchasing efficiency and supports informed decision-making . Empirical evidence shows reduced operational costs, improved collaboration, and enhanced workflow efficiency . Benefits include shorter order cycles, lower inventory levels, and reduced administrative expenses . These benefits may be tangible (cost savings), soft (time savings), or intangible (transparency and control) . Additionally, electronic procurement systems reduce time-to-market, minimize material and transaction costs, and improve inventory management practices within organizations .
Automation strengthens budgetary control, minimizes errors, and improves information management . E- procurement integrates organizational functions and reduces unauthorized purchasing . Early supplier involvement further enhances efficiency .
Although African studies highlight the growing importance of e-procurement , many focus on adoption factors rather than performance impact. Evidence shows improved supply chain integration and information sharing . E-tendering enhances transparency and accountability while improving documentation quality and security .
Empirical evidence from developing country contexts also demonstrates that institutional readiness, technological infrastructure, and management commitment significantly influence the performance outcomes of e-procurement systems. Study found that organizations that align e-procurement implementation with strategic objectives experience higher levels of efficiency, transparency, and cost control. The study further highlights that without adequate monitoring mechanisms and continuous system improvement, the expected performance gains may not be fully realized. These findings reinforce the importance of examining not only adoption factors but also the performance implications of e-procurement implementation.
2.3. Research Gap
Existing literature provides inconsistent findings regarding the relationship between e-procurement and organizational performance. In Ethiopia, limited research examines performance outcomes in public institutions. Previous studies identified challenges such as weak system integration, limited training, and insufficient competitive procurement practices, negatively affecting logistics performance.
No study has specifically examined the effect of e-procurement implementation on organizational performance within the African Union. Therefore, this study addresses methodological and contextual gaps by providing empirical evidence in this setting.
2.4 Conceptual Framework
The following figure shows, the conceptual framework of this study that developed based on the research questions, works of literature and assumed relationship. It limited on components of E- procurement implementation used as the independent variable namely such as E-sourcing, E-tendering, Efficiency, E-payment and associating with organizational performance metrics, namely; Cost saving, service Quality, Lead time and Transportation Improvements used as a dependent variable.
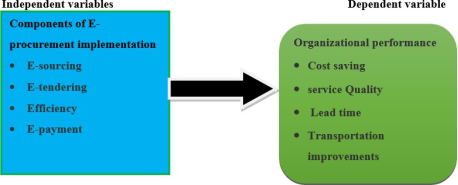
Figure 1. Conceptual Framework on the Study Source: from Literature Review.
3. Research Methodology
3.1. Description of Area of the Study
The study was conducted at the African Union, established in 2001 in Addis Ababa and officially launched in 2002 to promote African unity, cooperation, and policy coordination among member states. The organization has adopted e- procurement systems to enhance procurement efficiency, reduce operational costs, and improve service delivery. The African Union was selected as the study area due to its ongoing implementation of e-procurement practices and institutional experience with electronic procurement systems.
3.2. Research Design
Both descriptive and explanatory research designs were employed for the purpose of the study. Descriptive research design would be employed because is an efficient way of gathering data to help address a research questions and one can collect unbiased data and develop sensible decision based on analyzed results. Explanatory research design was also help to clarify the relationship between two aspects of a situation or phenomena .
3.3. Research Approach
The researcher used a quantitative research approach in this study to test hypotheses. Quantitative research approach is based on numerical and statistical data, and it is a convenient approach to manage a large amount of data which can be measured in a numerical way . The goal of the quantitative approach is testing hypotheses.
3.4. Target Population
The target population is the total number of subjects targeted by the study, or the group of elements to which the researcher wants to make a conclusion . Accordingly, the target area for this study was Africa union. In addition, the research will also use secondary data such interviewing respondents, reports indicating achievements,
misbehaving or any issues related with procurement and organizational performance of Africa union will in order to triangulate and support the primary data.
As per the information of Africa union human resource directorate there are a total of around 230 employees with permanent agreements. It is too small for a sample to be drawn from the given population. Therefore, the total populations of the study will 230 employees of Africa union.
3.5. Sample Size and Sampling Techniques
The study population consisted of 230 African Union employees. Using Yamane’s sampling formula at a 95% confidence level and 5% margin of error, a sample size of 146 respondents was determined. Participants with at least six months of work experience were selected through simple random sampling to ensure equal probability of selection and representative participation across organizational units.
Determining an appropriate sample size is essential to ensure representativeness and statistical validity of research findings. According to , sample size determination techniques such as Yamane’s formula provide a scientifically justified approach for minimizing sampling error while maintaining a desired confidence level. The author emphasizes that an adequate sample improves the reliability of regression and correlation analyses by ensuring that the selected respondents accurately reflect the characteristics of the target population. In organizational studies, particularly those involving performance measurement, the use of established sampling formulas strengthens the generalizability and credibility of the findings.
3.6. Source of Data
Even though, there are two types of source of data, primary and secondary source of data, the researcher was used primary source of data for the entire analysis of this study. Therefore, the information was collected through questionnaire from the selected sample of respondents and the data collected from the respondents through questionnaires was used as primary data.
3.7. Data Collection Tools/Instrument
Data were collected using structured close-ended questionnaires administered to employees of the African Union across relevant departments, including procurement, finance, marketing, warehouse, and management. The questionnaire enabled efficient collection of quantitative data within a limited time frame while ensuring respondent confidentiality. In addition, key informant interviews were conducted to supplement and triangulate the quantitative findings.
3.8. Validity and Reliability of the Study
3.8.1. Validity
Instrument validity was ensured through expert review. Furthermore, subject experts were consulted to review and evaluate the clarity, relevance, and adequacy of the questionnaire items before data collection was conducted .
3.8.2. Reliability
Reliability was assessed using Cronbach’s Alpha coefficients exceeding 0.70.
3.8.3. Test for Assumptions
Prior to regression analysis, key assumptions were tested, including linearity, normality, and multicollinearity. Linearity was examined using scatterplots to confirm a linear relationship between e-procurement implementation and organizational performance. Normality of residuals was assessed through skewness and kurtosis measures, while multicollinearity among independent variables was evaluated using Variance Inflation Factor (VIF) and tolerance values. For Normality test multiple regressions assume that the residuals are normally distributed. This assumption was tested by using Skewness and kurtosis [6]. All assumptions were satisfied before conducting regression analysis.
3.9. Methods of Data Analysis
After all the data will be collected through questionnaires, its completeness is verified, coded, and entered the computer using SPSS. Means that the data will be analyzed by using application software packages named as Statistical Package for Social Sciences (SPSS) version 26 through descriptive and inferential statistics.
3.9.1. Descriptive Statistical Analysis
To display the collected data in a brief and meaningful way data presentation and interpretation was made by using percentage, mean and standard deviation in table form.
3.9.2. Inferential Statistical Analysis
In Inferential statistical analysis, correlation and multiple linear regression analysis will be used to determine the relationship between the independent variables (implementation of E- procurement) and dependent variable (organizational performance); and to test the effect of implementation of E- procurement and organizational performance. Finally, the results will be presented using tables and every table will be accompanied by result interpretation.
3.9.3. Correlation Analysis
Correlation analysis used to determine the degree of the relationship existing between two or more variables. The correlation coefficient (r) is a measure of the degree of co-variability of the variables or it measures the strength and the direction of a linear association between independent variables and dependent variables. Therefore, Pearson correlation was used to show the relationship of variables namely: implementation of E- procurement and organizational performance of Africa union. As of statistical estimate, r is inevitability subject to some error and would be testing its reliability by conducting some test of significance. While computing a correlation, the level of significance should be set at 95% with an alpha value of 0.05.
3.9.4. Multiple Regressions
Multiple regression analysis was employed to examine the effect of e-procurement implementation on organizational performance at the African Union. Organizational performance was treated as the dependent variable, while e- sourcing, e-tendering, efficiency, and e-payment were considered independent variables. The regression model used to assess the relationship is expressed as:
Y=β₀+β₁X₁+ β₂X₂+β₃X₃+β₄X₄+ε
where Y represents organizational performance, X₁–X₄ denote e-procurement components, and ε represents the error term.
3.10. Ethical Consideration
Ethics are the norms or values for behavior that distinguish between right and wrong. It helps to determine the difference between acceptable and intolerable behaviors. Ethics is particularly significant components throughout the research procedures and if failed to be taken into account, it can lead to misinterpretation or even invalid conclusions. Hence, in this paper did not go under any form of bias or change, and the researcher respected the code address issues such as honesty, objectivity, respect for intellectual property, social responsibility, confidentiality, non-discrimination. Besides, Respondent was informed about the objective and purpose of the study and their consent was obtained for better participation in this study, and their identity would be kept confidential.
4. Data Analysis and Interpretation
4.1. Response Rate
To achieve the aim of study 146 valid questionnaires were distributed to the employees of African Union. Among the 146 questionnaires survey forms distributed, 5 were not returned and/or declined to participate. 2of the returned questionnaires were deemed invalid, and the final number of valid questionnaires was 139 usable questionnaires available for analysis.
Table 1. Response rate.

Response rate

Number of Replies

Not Returned and/or Declined to Participate

Missed and outliers

Total

Frequency

139

5

2

146

Percentage

95.2

3.4

1.4

100

Source: Researcher SPSS output, 2024
The overall response rate of 95.2% (139 responses/146 questionnaires), which is the valid number to run all required analysis. After the response rate was determined the demographic character of respondents was analyzed as follows:
4.2. Respondents General Information
As depicted in the table below, when the researcher see the gender division of the respondents, the majority of the respondents were males; i.e. (73) 52.5% representing the bigger part of the sample group. However (66) 47.5% of the respondents were females. This study was mainly aimed at those respondents who work in African Union.
Table 2. Respondents General Information.

Variable

Category

Frequency

Percent (%)

Cumulative%

Gender

Male

73

52.5

52.5

Female

66

47.5

100

Age of the respondents

25-35

25

18.0

18.0

35-45

84

60.4

78.4

above 45

30

21.6

100.0

Level of education

Diploma and below degree

65

46.8

46.8

masters

65

46.8

93.5

PhD& above

9

6.5

100.0

Year of Experience of the respondents

2-5 years

11

7.9

7.9

6-10 years

55

39.6

47.5

Above 10 years

73

52.5

100.0

Source: Researcher SPSS output, 2024
In this demographic profile the service year of the respondents in stayed in African Union as well as in their current position ensures that validity of questionnaire responses that respondents stay enough in African Union as well as in their implementation of electronic procurement for improving the performance of the organization and to give valid response on the items described on the questionnaire
4.3. Test of Reliability and Validity
4.3.1. Test of Reliability
The reliability of variables in this study is within the acceptable ranges (between 0.798 and 0.921).
Table 3. Test of reliability.

Variable

Cronbach’s Alpha

No. of item

E-sourcing

.833

5

E-tendering

.753

4

Efficiency

.721

4

E-payment

.846

6

Organizational performance

.935

18

Source: Researcher SPSS output, 2024
The reliability of all the items were acceptable and very good
4.3.2. Test of Validity
In this study, Content validity was measured. Content validity address to what extent the appropriate content is representing in questionnaires. To check either the measurement items describe variables or not the researcher takes feedback from the advisor and managers of the African Union. Creation-related validity was also used; since the questionnaire is adopted from standardized questionnaires.
4.4. Implementation of Electronic Procurement in African Union
Based on the data collected from the respondents, the extent of implementation of electronic procurement in African Union presented as follow. Here, variables of electronic procurement were E-sourcing, E-tendering, Efficiency and E-payment. As induced before. The distributed questionnaires developed via five-point Likert scale; 1- Not at all; 2- Rarely; 3- Occasionally; 4- Often; 5 - Extensively.
Accordingly, analysis of the data was done using means and standard deviations, the recorded means were interpreted as follows: 1-1.49 = Not at all; 1.5-2.49 = rarely; 2.5-3.49 = occasionally; 3.5-4.49 = Often; 4.5-5.0 = Extensively (Lady, 2016).
4.4.1. E-sourcing in African Union
Overall, the data collected from respondents were used to determine the extent levels of electronic procurement were E-sourcing, E-tendering, Efficiency and E-payment as well level of African Union performance via descriptive statistics: mean and standard deviation. Specifically In this section, the level of practicing E-sourcing in African Union was determined through descriptive statistics as follow:
Table 4. E-sourcing in African Union.

Metrics of E-sourcing

N

Mean

Std. Deviation

e- sourcing implementation of E- procurement has impacted organizational

performance

139

3.51

1.446

The organization enabled strong internet application for E- procurement

139

3.68

1.251

The organization support tool that facilitates E- procurement through the use of online negotiations, online auctions, reverse auctions, and similar tools

139

3.49

1.466

Indicate the extent to which e-sourcing improved the relationship with suppliers in terms of transparency and trust

139

2.57

1.345

E-sourcing has enabled the organization to select the most appropriate supplier

139

3.43

1.430

Grand mean

139

3.1971

1.07595

Source: Researcher SPSS output, 2024
As depicted E-sourcing practices in the African Union are frequently supported through strong internet infrastructure and electronic procurement systems, contributing to improved organizational performance, while improvements in supplier relationships and transparency are only moderately practiced.
4.4.2. E-tendering in African Union
In this section, the study sought to disclose the level of practicing E-tendering in African union. The results are shown in the below table.
Table 5. E-tendering in African union.

Metrics of E-tendering

N

Mean

Std. Deviation

E-tendering has impacted my organization's efficiency in terms of managing supplier’s bids

139

3.46

1.557

E-tendering has helped my organization in reducing its costs and run sustainably

139

3.69

1.393

E-tendering has helped my organization to reduce the time to procure

139

3.88

1.213

The E-tendering process has helped my organization to gain full audit and process intelligence

139

3.64

1.399

Grand mean

139

3.6673

1.05783

Source: Researcher SPSS output, 2024
As presented E-tendering practices in the African Union are frequently applied to reduce procurement time, lower costs, and improve audit transparency, while their role in managing suppliers’ bids is moderately practiced.
4.4.3. Efficiency in African Union
Under this section of discussion, the level of practicing Efficiency in African union was discussed as follow.
Table 6. Efficiency in African union.

Metrics of Efficiency

N

Mean

Std. Deviation

The organization achieved e- procurement of efficiency in terms of cost reduction

139

2.73

1.166

The organization E-Procurement has the power to results in efficiency, satisfaction, and improved performance.

139

3.46

1.500

Because of e-procurement the organization has improved the quality of its services offered by building more confidence and security

139

3.18

1.519

The organization e- procurement has built customer loyalty, and boost performance

139

3.40

1.040

Grand mean

139

3.29

.79945

Source: Researcher SPSS output, 2024
As a result, E-procurement practices in the African Union moderately contribute to organizational efficiency, customer satisfaction, service quality improvement, and performance enhancement, while cost reduction benefits are only occasionally realized.
4.4.4. E-payment in African Union
Under this section of discussion, the level of practicing E-payment in African union was discussed as follow.
Table 7. E-payment in African union.

Metrics of E-payment

N

Mean

Std. Deviation

E-payments has impact on the efficiency of my organization in terms of costs saving

139

2.48

1.010

E-payments affect my organization's efficiency in terms of time saving

139

2.45

1.058

There is a certainty of payment when my organization process electronic transaction

139

3.68

1.252

Electronic payment offers my Organization a competitive advantage

139

3.35

1.439

E-payments has impact on the efficiency of my organization in terms of offering more confidence and security

139

3.70

1.255

There are minimized risks of fraud when our customers choose to use electronic payment methods

139

4.06

.961

Grand mean

139

3.2866

.88261

Source: Researcher SPSS output, 2024
As a result, electronic payment practices in the African Union are mainly applied to enhance transaction security, reduce fraud risk, and ensure payment certainty, while their contribution to cost and time efficiency is only moderately realized.
4.4.5. Metrics of Organizational Performance of African Union
In this part of the study, the degree of organizational performance level of African union presented as follow: Here, variables of organizational performance were cost saving, service quality, lead time and transportation improvement.
Table 8. Metrics of organizational performance of African union.

Metrics of organizational performance of African union

N

Mean

Std. Deviation

Cost saving

Organizational performance can be measured in terms of reduced operational cost

139

4.06

.980

E- procurement has reduced cost by reducing the need of printing and posting multiple copies

139

3.71

1.254

E-procurement has shown growth of the organization in value added activity

139

3.40

1.453

E-procurement has reduced direct procurement costs such as material, labor, overhead costs

139

3.68

1.251

E-procurement has enabled the organization achieve economies of scale in procurement activities

139

4.08

.948

Overall mean

139

3.7856

1.00855

Service quality

Increment of product/service procurement

139

2.83

1.468

The organization reduced Customer complaint after implementing e- procurement has increased service quality

139

3.66

1.254

The organization offers reliable service to customers after e-procurement implementation

139

3.50

1.481

Overall mean

139

3.3333

1.09970

Lead time

E-procurement has shortened the time required to fulfill requests

139

1.86

1.327

E-procurement has facilitated in getting the products and services from suppliers in a shorter time

139

3.41

1.423

E-procurement practice has enhanced giving real time response to user departments

139

3.40

1.526

Guaranteed real time response to and from market is a measure of organizational performance

139

1.99

1.302

Streamlined internal process by using e-procurement system is a measure of organizational performance

139

3.55

1.480

Overall mean

139

2.8403

1.02042

Transportation improvement

The organization has reduced cost of transporting items from the supplier to the AU facilities due to early reservation in e-procurement

139

3.66

1.254

The organization minimized transportation cost because of E-procurement implementation

139

3.45

1.455

The organization procurement department negotiates well with a carrier or number of carriers to get competitive advantage

139

2.04

1.242

The organization has reduced the lead time for shipment of procured items after implementation of e-procurement

139

4.03

.932

E-procurement has enabled the organization to optimize transportation routes and modes

139

2.01

1.231

Overall mean

139

3.0360

.82611

Grand mean of organizational performance

139

3.2488

.91368

Source: Researcher SPSS output, 2024
The results indicate that e-procurement implementation has moderately improved organizational performance within the African Union. Respondents agreed that e-procurement enabled economies of scale (M = 4.08, SD = 0.948), reduced operational costs (M = 4.06, SD = 0.980), and shortened procurement lead time (M = 4.03, SD = 0.932). Improvements were also observed in cost reduction through minimized printing and posting expenses (M = 3.70, SD
= 1.254), enhanced service quality through reduced customer complaints, and lower transportation costs due to early reservation practices (M = 3.66, SD = 1.254).
Furthermore, streamlined internal processes (M = 3.55, SD = 1.480), improved service reliability (M = 3.50, SD = 1.481), reduced transportation costs (M = 3.45, SD = 1.455), and faster acquisition of goods and services (M = 3.41, SD = 1.423) were moderately practiced. However, lower mean scores were recorded for procurement negotiation efficiency, transportation route optimization, real-time market responsiveness, and request fulfillment speed (M < 3.00), indicating areas requiring further improvement.
The use of correlation analysis in organizational research enables scholars to determine the strength and direction of relationships between operational practices and performance outcomes. As noted by , correlation techniques are particularly useful in examining associations among procurement dimensions and financial or non-financial performance indicators. The author further explains that understanding such relationships provides a foundation for more advanced inferential analyses such as regression modeling. Therefore, correlation analysis in this study serves as an important preliminary step in identifying whether e-procurement components are statistically associated with organizational performance metrics.
4.5. Correlation Analysis
In addition to describing the shape of variable distributions, another important task of this study was to examine and describe the degree of co-variability of the variables.
Correlations are perhaps the most basic and most useful measure of relationship between two or more variables. The degree of the correlation coefficient defines the strength of the correlation . When r
= (+) 1, it indicates a perfect positive correlation and when it is (–) 1, it indicates a perfect negative correlation. The value of ‘r’ nearer to +1 or –1 indicates a high degree of correlation between the two variables. A result between 0.1 and 0.3 indicates weak relationship, whereas a result between 0.4 and 0.6, and 0.7 and 0.9 implies respectively moderate and strong relationships among variables.
4.5.1. Correlation Between Electronic Banking Service Quality and Customer Satisfaction
The findings for this analysis were shown in the following correlation matrix table as follows.
Table 9. Correlation between electronic procurement and metrics of organizational performance.

Cost saving

Service Quality

Lead time

Transportation improvement

E-sourcing

Pearson Correlation

.822**

.894**

.948**

.868**

Sig. (2-tailed)

.000

.000

.000

.000

N

139

139

139

139

E-tendering

Pearson Correlation

.406**

.426**

.425**

.360**

Sig. (2-tailed)

.000

.000

.000

.000

N

139

139

139

139

Efficiency

Pearson Correlation

.510**

.560**

.718**

.696**

Sig. (2-tailed)

.000

.000

.000

.000

N

139

139

139

139

E-payment

Pearson Correlation

.925**

.867**

.841**

.892**

Sig. (2-tailed)

.000

.000

.000

.000

N

139

139

139

139

**. Correlation is significant at the 0.01 level (2-tailed).

Source: Researcher SPSS output, 2024
Overall, the findings reveal strong and moderate positive significant relationships between electronic procurement practices and organizational performance metrics at the African Union.
4.5.2. Correlation Between Inventory Management and Overall of Performance the Organization
The above correlation analysis carried out to shows the relationship between electronic procurement elements (: E- sourcing, E-tendering, Efficiency and E-payment) and metrics of organizational performance (Cost saving, Service Quality, Lead time and Transportation improvement) each other’s in particular
Here, the researcher carried out a correlation analysis to test the relationship between set of electronic procurement elements and overall organizational performance African union. Accordingly, the findings for this analysis were shown in the following correlation matrix table as follow.
Table 10. Correlation between electronic procurement and overall of electronic procurement and metrics of organizational performance.

E-sourcing

E-tendering

Efficiency

E-payment

organizational performance

E-sourcing

Pearson Correlation

1

.461**

.642**

.894**

.957**

Sig. (2-tailed)

.000

.000

.000

.000

N

139

139

139

139

139

E-tendering

Pearson Correlation

.461**

1

.582**

.372**

.440**

Sig. (2-tailed)

.000

.000

.000

.000

N

139

139

139

139

139

Efficiency

Pearson Correlation

.642**

.582**

1

.634**

.667**

Sig. (2-tailed)

.000

.000

.000

.000

N

139

139

139

139

139

E-payment

Pearson Correlation

.894**

.372**

.634**

1

.953**

Sig. (2-tailed)

.000

.000

.000

.000

N

139

139

139

139

139

organizational performance

Pearson Correlation

.957**

.440**

.667**

.953**

1

Sig. (2-tailed)

.000

.000

.000

.000

N

139

139

139

139

139

**. Correlation is significant at the 0.01 level (2-tailed).
Source: Researcher SPSS output, 2024
To sum up, the correlation analysis shows that there was statistically a strong, and moderate positive significant relationship between set of Electronic procurement mentioned in the model and overall organizational performance of African union.
4.6. Diagnostic Tests of Assumptions of Classical Linear Regression Model
The five MLRM tests for normality, homoscedasticity, multicollinearity, autocorrelation, and linearity, which might be accomplished and designated beneath, need to first be examined earlier than using the regression evaluation. A number of assumptions need to be met earlier than performing regression analysis with confidence. The important assumptions that had been examined in this section are; impartial variables shouldn’t be too strongly correlated to one another (Multicollinearity), the cost of residuals to be independent of each other (Autocorrelation), the residuals must be on average dispensed (Normality), linearity and Homoscedasticity. The subsequent exams had been done to test whether the statistics suits the assumptions of linear regression so that you can conclude the analysis consequences had been legitimate and reliable.
4.6.1. Normality Test
This check is used to decide whether the data are disbursed usually or not. Normality assumption has to be fulfilled if you want to conduct hypothesis check (Brook, 2008). There are one-of-a-kind methods to test the normality assumption. In line with Gujarati (2004), in checking out the normality assumption, tests of normality may be considered: (1) histogram of residuals and (2) everyday possibility plot (NPP) which is a graphical device. On this study, due to their simplicity, each of them was applied for checking out the normality assumption as shown underneath.
1) Histogram of Residuals: the Histogram should be symmetric along the centre 0.
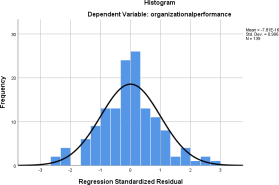
Figure 2. Standard P-P and histogram plot displaying the regression of standardized residuals in a normal distribution. SPSS output 2024 – Source.
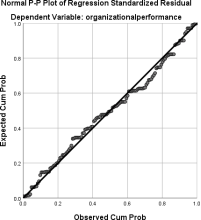
Figure 3. plots the cumulative probability of independent variables (in this case we would specify a normal distribution).
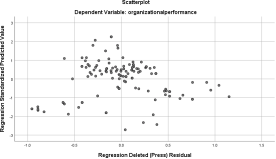
As shown in Figure 2, the histogram indicates that the residuals are approximately normally distributed around zero. This suggests that most of the values cluster around the center of the distribution, with the tallest bars located near the mean.
2) Normal Probability Plot
As a result, beneath indicated that residuals from the studies version regression are about usually distributed, because a directly line offers the impact to suit the facts fairly well also, this check suggests the residuals' ordinary distribution around a median of 0.
If the data are normally distributed then the actual cumulative probability will be similar to the anticipated cumulative opportunity and we can get a directly diagonal line. The P-P plot need to be aligned with the diagonal line, in addition to the factors of everyday P-P plot ought to be located in a fairly straight diagonal line going from backside left to top right. In this case the dots are drawn towards the diagonal line, indicating that assumption of normality is met.
4.6.2. Linearity
Linearity test targets to determine the connection among the unbiased variables and the structured variable linear or no longer. Linearity way that the predictor variables inside the regression have a immediately line courting with the final results variable.
Source: 2024 output of the SPSS

Download: Download full-size image

Figure 4. Linearity test.Linearity test.
To test linearity, see Figure 4 scatter plots.
When a diagonal line is drawn from the left backside to right pinnacle corners the points are aligned along the diagonal line shows linearity among established and impartial variables. Figure 4 suggests linearity between structured and unbiased variables so the assumption for regression check is glad.
4.6.3. Homoscedasticity
Homoscedasticity explains whether the residuals are distributed evenly, typically cluster at certain values at the same time as scattering drastically at different values, or are both neither calmly allotted nor extensively spread. There are factors similarly disbursed above and below the x-axis and to the left and proper of 0 on the y-axis if the information resembles a shotgun blast rather than a cone or fan shape, the records is homoscedastic.
SPSS output 2024 – Source

Download: Download full-size image

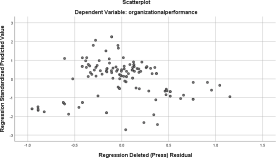
Figure 5. scatter plot of regression for standardized predicted value against the residual.
As proven in discern above, the unfold of residuals randomly distributed suggests equality of variances or homogeneity of variances. Which means that it keeps the same in the linear mode.. This suggests no violation of homoscedasticity.
4.6.4. Autocorrelation
The cost of residuals is assumed to be independent of each other (or uncorrelated). We need take a look at the version précis container's regression output so as to check this assumption. To take a look at the validity of the perception that our residuals are independent, the Durbin-Watson statistic changed into carried out (or uncorrelated). This value must range between zero and four. The value of a Durbin-Watson statistic must be close to 2 for no autocorrelation assumption. A cost of two indicates no autocorrelation. A fee of closer to 0 shows high-quality autocorrelation. A fee towards four shows bad autocorrelation (Legendre, 1993).
Table 11. Autocorrelation test Model Summaryb. Autocorrelation test Model Summaryb. Autocorrelation test Model Summaryb.

Model

R

R Square

Adjusted R Square

Std. Error of the Estimate

Durbin-Watson

1

.902a

.813

.812

.39630

1.557

Predictors: (Constant), average E-procurement
Dependent Variable: organizational performance Source: Researcher SPSS output, 2024
For that reason, the above Table 13 shows that Durbin-Watson price of 1.557 which is a rating close to 2. Hence it may be concluded that there may be no Autocorrelation hassle as the Durbin-Watson statistic showed the value close to 2.
4.6.5. Multicollinearity
If there may be a substantial association among or greater predictors in a regression model, multicollinearity is proven. Multicollinearity bears a trouble most effective for more than one regression because it exists in more than predictors. Collinearity diagnostic may be accomplished with the use of SPSS, and one among that's the Variance Inflating aspect (VIF). The VIF factors whether a predictor has robust linear dating with the alternative predictor(s). despite the fact that there are not any difficult and rapid regulations approximately what price of the VIF need to be a purpose for difficulty, (Alin, 2010), shows that value more than 0.1 and much less than 10 is right and he suggest that there is no Multicollinearity in the regression model.
Table 12. Multicollinearity Test.

Model

Unstandardized Coefficients

Standardized Coefficients

t

Sig.

Collinearity Statistics

B

Std. Error

Beta

Tolerance

VIF

1

(Constant)

.119

.072

1.662

.000

E-sourcing

.427

.033

.502

12.924

.000

.181

5.535

E-tendering

.009

.018

.010

.498

.000

.624

1.603

Efficiency

.041

.028

.036

1.459

.000

.456

2.194

E-payment

.494

.039

.477

12.510

.000

.187

5.334

a. Dependent Variable: organizational performance
Source: Researcher SPSS output, 2024
4.6.7. Electronic Banking Service Quality Effects on Metrics of Customer Satisfaction
Under this section, linear regression was employed to determine how much the independent variables (Electronic procurement) explain the dependent variable which is metrics of organizational performance (Cost saving, Service Quality, Lead time and Transportation improvement). Accordingly, the result of the regression was presented in the table as follows:
©Recap that: Model 1 infers- Electronic procurement effects on Cost saving
Model 2 infers- Electronic procurement effects on Service Quality
Model 3 infers- Electronic procurement effects on Lead time
Model 4 infers- Electronic procurement effects on Transportation improvement
Table 13. Regression analysis model summaries between Electronic procurement and metrics of organizational performance.

Model Summaryb

Model

R

R Square

Adjusted R Square

Std. Error of the Estimate

1

.740a

.683

.679

.35020

a. Predictors: (Constant), E-payment, E-tendering, Efficiency, E-sourcing

b. Dependent Variable: cost saving

Model Summaryb

Model

R

R Square

Adjusted R Square

Std. Error of the Estimate

1

.709a

.627

.622

.46393

a. Predictors: (Constant), E-payment, E-tendering, Efficiency, E-sourcing

b. Dependent Variable: service Quality

Model Summaryb

Model

R

R Square

Adjusted R Square

Std. Error of the Estimate

1

.764a

.728

.726

.27722

a. Predictors: (Constant), E-payment, E-tendering, Efficiency, E-sourcing

b. Dependent Variable: Lead time

Model Summaryb

Model

R

R Square

Adjusted R Square

Std. Error of the Estimate

1

.721a

.648

.643

.32683

a. Predictors: (Constant), E-payment, E-tendering, Efficiency, E-sourcing

b. Dependent Variable: transportation improvement

Source: Researcher SPSS output, 2024
The model summary results show strong positive relationships between e-procurement practices and organizational performance indicators at the African Union. The multiple correlation coefficients (R) of 0.740, 0.709, 0.764, and 0.721 indicate a strong association between e-procurement and cost saving, service quality, lead time, and transportation improvement, respectively.
The coefficients of determination (R²) reveal that e-procurement practices explain 68.3% of the variation in cost saving, 62.7% in service quality, 72.8% in lead time, and 64.8% in transportation improvement. Similarly, the adjusted R² values indicate that the combined predictor variables account for 67.9%, 62.2%, 72.6%, and 64.3% of the respective performance outcomes, confirming the strong predictive power of the models.
Table 14. ANOVA model fit ANOVAa.

Model

Sum of Squares

df

Mean Square

F

Sig.

1

Regression

123.938

4

30.984

252.651

.000b

Residual

16.433

134

.123

Total

140.371

138

a. Dependent Variable: cost saving

b. Predictors: (Constant), E-payment, E-tendering, Efficiency, E-sourcing

ANOVAa

Model

Sum of Squares

df

Mean Square

F

Sig.

1

Regression

138.047

4

34.512

160.345

.000b

Residual

28.841

134

.215

Total

166.889

138

a. Dependent Variable: service Quality

b. Predictors: (Constant), E-payment, E-tendering, Efficiency, E-sourcing

ANOVAa

Model

Sum of Squares

df

Mean Square

F

Sig.

1

Regression

133.396

4

33.349

433.944

.000b

Residual

10.298

134

.077

Total

143.694

138

a. Dependent Variable: Lead time

b. Predictors: (Constant), E-payment, E-tendering, Efficiency, E-sourcing

ANOVAa

Model

Sum of Squares

df

Mean Square

F

Sig.

1

Regression

79.866

4

19.967

186.916

.000b

Residual

14.314

134

.107

Total

94.180

138

a. Dependent Variable: transportation improvement

b. Predictors: (Constant), E-payment, E-tendering, Efficiency, E-sourcing

Source: Researcher SPSS output, 2024
The ANOVA results indicate that the regression models are statistically significant in predicting organizational performance indicators at the African Union. Electronic procurement practices significantly predict cost saving (F = 252.651, p <.001), service quality (F = 160.345, p <.001), lead time (F = 433.944, p <.001), and transportation improvement (F = 186.916, p <.001). These findings confirm that the regression models provide a good fit to the data.
Table 15. Regression coefficients.

Model

Unstandardized Coefficients

Standardized Coefficients

t

Sig.

B

Std. Error

Beta

1

(Constant)

.845

.505

1.677

.000

E-sourcing

.382

.050

.463

7.64

.000

E-tendering

.210

.065

.300

3.231

.001

Efficiency

.132

.039

.140

3.385

.000

E-payment

.376

.088

.364

1.033

.000

a. Dependent Variable: cost saving

Model

Unstandardized Coefficients

Standardized Coefficients

t

Sig.

B

Std. Error

Beta

1

(Constant)

.811

.703

1.154

.000

E-sourcing

.543

.069

.400

7.869

.000

E-tendering

.095

.086

.582

6.885

.000

Efficiency

.076

.047

.073

1.615

.003

E-payment

.476

.103

.382

4.608

.000

a. Dependent Variable: service quality

Model

Unstandardized Coefficients

Standardized Coefficients

t

Sig.

B

Std. Error

Beta

1

(Constant)

.584

.404

1.445

.000

E-sourcing

.270

.040

.287

6.75

.000

E-tendering

.020

.056

.021

.357

.000

Efficiency

.224

.044

.254

5.09

.000

E-payment

.463

.071

.461

6.521

.000

a. Dependent Variable: Lead time

Model

Unstandardized Coefficients

Standardized Coefficients

t

Sig.

B

Std. Error

Beta

1

(Constant)

.385

.132

2.917

.000

E-sourcing

0.255

.061

.333

4.198

.000

E-tendering

0.089

.033

.114

2.674

.003

Efficiency

0.219

.052

.221

4.211

.000

E-payment

0.434

.073

.455

5.945

.000

a. Dependent Variable: transportation improvement

Source: Researcher SPSS output, 2024
The results confirm that improvements in e-sourcing, e-tendering, efficiency, and e-payment lead to measurable improvements in cost saving, service quality, lead time reduction, and transportation performance within the African Union.
4.6.8. Electronic Procurement Effects on Overall Organizational Performance
Under this section, linear regression was employed to determine how much the independent variables (electronic procurement) explain the dependent variable which is metrics of organizational performance (Cost saving, Service Quality, Lead time and Transportation improvement). Accordingly, the result of the regression was presented in the table as follows:
Table 16. Regression analysis model summary between electronic procurement and overall organizational performances Model Summaryb.

Model

R

R Square

Adjusted R Square

Std. Error of the Estimate

1

.782a

.763

.762

.17728

Predictors: (Constant), E-payment, E-tendering, Efficiency, E-sourcing
Dependent Variable: organizational performance
Source: Researcher SPSS output, 2024
The model summary results indicate a strong relationship between e-procurement components and overall organizational performance of the African Union.
Table 17. ANOVA model fit ANOVAa.

Model

Sum of Squares

df

Mean Square

F

Sig.

1

Regression

110.992

4

27.748

382.853

.000b

Residual

4.212

134

.031

Total

115.203

138

Dependent Variable: organizational performance
Predictors: (Constant), E-payment, E-tendering, Efficiency, E-sourcing
Source: Researcher SPSS output, 2024
This study sum up that the regression model is a good fit of the data.
Table 18. Regression coefficients Coefficientsa.

Model

Unstandardized Coefficients

Standardized Coefficients

t

Sig.

Collinearity Statistics

B

Std. Error

Beta

Tolerance

VIF

1

(Constant)

.719

.072

9.986

000

E-sourcing

.427

.033

.502

12.924

.000

.181

5.535

E-tendering

.009

.018

.010

.498

.000

.624

1.603

Efficiency

.041

.028

.036

1.459

.000

.456

2.194

E-payment

.494

.039

.477

12.510

.000

.187

5.334

Dependent Variable: organizational performance
Source: Researcher SPSS output, 2024
The results indicate that increases in e-procurement practices are positively associated with improvements in organizational performance, with e-payment and e-sourcing exerting the greatest practical impact.
4.7. Hypotheses Result Discussion
From the summary result tables, basic research question stated in chapter one, or hypotheses which were developed in chapter two were tested. The result from this study is summarized in as follows.
Table 19. Summary of result.

Path

Hypothesis

Type of Hypothesis

B

P <0.05

Remark

ES→CS

H1a

Null Hypothesis

.382

000**

Rejected

ET→CS

H1b

Null Hypothesis

.210

001**

Rejected

E→CS

H1c

Null Hypothesis

.132

.000**

Rejected

EP→CS

H1d

Null Hypothesis

.376

000**

Rejected

ES→SQ

H1e

Null Hypothesis

.543

000**

Rejected

ET→SQ

H2a

Null Hypothesis

.095

.000**

Rejected

E→SQ

H2b

Null Hypothesis

.076

.003**

Rejected

EP→SQ

H2c

Null Hypothesis

.476

.000**

Rejected

ES→LT

H2d

Null Hypothesis

.270

.000**

Rejected

ET→LT

H2e

Null Hypothesis

.020

.000**

Rejected

E→LT

H3a

Null Hypothesis

.224

.000**

Rejected

EP→LT

H4b

Null Hypothesis

.463

.000**

Rejected

ES→TI

H4c

Null Hypothesis

0.255

.000**

Rejected

ET→TI

H4d

Null Hypothesis

0.089

.002**

Rejected

E→TI

H4de

Null Hypothesis

0.219

000**

Rejected

EP→TI

H5a

Null Hypothesis

0.434

.000**

Rejected

Overall summary of results

ES→OP

Null Hypothesis

.427

.000**

Rejected

ET→OP

Null Hypothesis

.009

.000**

Rejected

E→OP

Null Hypothesis

.041

.000**

Rejected

EP→OP

Null Hypothesis

.494

.000**

Rejected

Source: Researcher SPSS output, 2024
4.8. Interview Responses
Key informant interviews with procurement managers and senior staff were conducted to complement employee survey responses. The interviews revealed that although the African Union has made progress in implementing e- procurement, challenges remain, including limited technical skills, high system implementation costs, and poor internet connectivity. Respondents emphasized the need for continuous employee training, improved technological infrastructure, effective information management systems, and strengthened monitoring mechanisms to enhance e- procurement efficiency and organizational performance. Senior staff further noted that e-procurement supports faster market access and operational efficiency through reduced cost and time requirements.
The study highlights that successful business-to-business e-procurement implementation depends on addressing challenges such as lack of system integration and standardization, immature e-procurement market services, end- user resistance, and difficulties integrating e-commerce systems, while minimizing unauthorized purchasing practices.
5. Summary, Conclusion, and Recommendation
5.1. Summary
This study examined the effect of e-procurement implementation on organizational performance in the African Union. Descriptive statistical results indicate that e-procurement practices, including e-sourcing (M = 3.20), e- tendering (M = 3.67), efficiency (M = 3.29), and e-payment (M = 3.29), were moderately practiced, with an overall organizational performance mean score of 3.25.
Pearson correlation analysis revealed positive relationships between e-procurement practices and organizational performance. E-sourcing and e-payment demonstrated strong positive associations with overall organizational performance (r =.957, p <.01), while efficiency (r =.667, p <.01) and e-tendering (r =.440, p <.01) showed moderate positive relationships.
Multiple regression analysis further confirmed that e-procurement components significantly predict organizational performance. The model demonstrated strong explanatory power (R =.782), with 76.3% of the variation in organizational performance explained by e-procurement practices (R² =.763; Adjusted R² =.762). The ANOVA results also confirmed the overall model significance (F = 382.853, p <.001).
Regression coefficient results indicated that e-sourcing (β =.502) and e-payment (β =.477) were the strongest contributors to organizational performance, whereas efficiency (β =.036) and e-tendering (β =.010) showed comparatively smaller effects. Overall, the findings confirm that effective implementation of e-procurement practices significantly improves cost saving, service quality, lead time, and transportation performance within the African Union.
5.2. Conclusions
The findings indicate that e-tendering is the most dominant e-procurement practice in the African Union, followed by efficiency, e-payment, and e-sourcing. The study confirms a positive and statistically significant relationship between e-procurement implementation and organizational performance, implying that improvements in these practices enhance performance outcomes. However, limited employee awareness, unclear communication of procurement policies, and insufficient institutional support constrain full performance improvement. Overall, all e-procurement dimensions were positively correlated with organizational performance, demonstrating their significant contribution to organizational effectiveness.
5.3. Recommendations
Based on the study findings, the following recommendations are proposed to enhance the effectiveness of e- procurement implementation and improve organizational performance within the African Union:
1) Strengthen e-procurement governance and policies:
The organization should regularly review and update procurement policies and regulatory frameworks to ensure effective implementation, transparency, and compliance with procurement procedures.
2) Enhance training and awareness programs:
Continuous capacity-building initiatives should be provided for employees and suppliers to improve technical skills, system utilization, and awareness of e-procurement objectives and procedures.
3) Improve supplier integration and e-sourcing practices:
Expanding supplier participation through electronic platforms and providing secure access to supplier portals can improve competition, supplier selection, and procurement efficiency.
4) Increase system automation and accessibility:
The organization should strengthen automated procurement processes covering requisition, tendering, contract management, invoicing, and payment to improve operational efficiency and reduce procurement delays.
5) Strengthen financial control and reporting mechanisms:
Effective electronic invoicing and reporting systems should be implemented to enhance accountability, transparency, and timely financial information management.
6) Promote management commitment and stakeholder involvement:
Top management should lead e-procurement implementation efforts while encouraging employee participation and collaboration with internal and external stakeholders.
7) Establish monitoring and evaluation mechanisms:
Regular performance assessment, employee feedback systems, and continuous monitoring should be adopted to evaluate e-procurement implementation and support ongoing improvement.
5.4. Limitations and Future Research Directions
Despite its contributions, this study has several limitations. First, the research was conducted only within the African Union, which may limit the generalizability of the findings to other organizations or institutional contexts. In addition, the study relied on a relatively limited sample size and primary data sources, which may not fully capture broader organizational or stakeholder perspectives.
Future studies are encouraged to include larger and more diverse samples drawn from multiple departments, institutions, and external stakeholders to enhance generalizability. Further research may also incorporate additional e- procurement dimensions and organizational performance indicators using both primary and secondary data sources. Moreover, future investigations could examine mediating or moderating variables to provide deeper insight into the relationship between e-procurement implementation and organizational performance.
Abbreviations

AU

African Union

ANOVA

Analysis of Variance

B2B

Business-to-Business

EDI

Electronic Data Interchange

ERP

Enterprise Resource Planning

ICT

Information and Communication Technology

IT

Information Technology

KII

Key Informant Interview

OAU

Organization of African Unity

PO

Purchase Order

RFI

Request for Information

RFP

Request for Proposal

RFQ

Request for Quotation

SPSS

Statistical Package for Social Sciences

VIF

Variance Inflation Factor

Author Contributions
Belayihun Shewangzaw: Conceptualization, Data curation, Formal analysis, Investigation, Methodology, Project administration, Visualization, Writing – original draft
Amana Omer: Supervision, Validation, Writing – review & editing, Resources, Methodology
Abrham Aydagn: Software, Formal analysis, Investigation, Validation, Writing – review & editing
Conflicts of Interest
The authors declare no conflicts of interest.
References
[1] Ahmed, S., & Yaacob, M. R. (2021). Validity and Reliability of an Instrument to Measure Sustainable Performance in Manufacturing Firms. Nasrul Aiman Bin Abd Aziz Web designer, 293.
[2] Angeles, R., & Nath, R. (2007). Business‐to‐business e‐procurement: success factors and challenges to implementation. Supply Chain Management: An International Journal, 12(2), 104-115.
[3] Azanlerigu, J. A., & Akay, E. (2015). Prospects and challenges of e-procurement in some selected public institutions in Ghana. Prospects, 7(29), 61-76.
[4] Bag, S., Wood, L. C., Mangla, S. K., & Luthra, S. (2020). Procurement 4.0 and its implications on business process performance in a circular economy. Resources, conservation and recycling, 152, 104502.
[5] Barngetuny, D. C., & Kimutai, G. (2015). Effects of e-procurement on supply chain management performance in Elgeyo-Marakwet County. International Academic Journal of Procurement and Supply Chain Management, 1(5), 99- 120.
[6] Blanca, M. J., Arnau, J., López-Montiel, D., Bono, R., & Bendayan, R. (2013). Skewness and kurtosis in real data samples. Methodology.
[7] Chan, A. P., & Owusu, E. K. (2022). Evolution of electronic procurement: contemporary review of adoption and implementation strategies. Buildings, 12(2), 198.
[8] Chandrasekar Subramaniam, M. J. S. (2002). A study of the value and impact of B2B e-commerce: the case of web- based procurement. International journal of electronic commerce, 6(4), 19-40.
[9] Chen, Y., Bretschneider, S., Stritch, J. M., Darnall, N., & Hsueh, L. (2022). E-procurement system adoption in local governments: the role of procurement complexity and organizational structure. Public Management Review, 24(6), 903-925.
[10] Creswell, J. W. (2014). A concise introduction to mixed methods research. SAGE publications.
[11] Delebo, D. (2022). Factors Affecting Procurement Performance: A case of Public Sectors in SNNPRS, Ethiopia (Doctoral dissertation).
[12] Desmond, b. P. (2022). The effects of e-procurement practices on supply chain performance: the moderating role of supplier integration (doctoral dissertation, kwame nkrumah university of science and technology, kumasi).
[13] Engelbrecht-Wiggans, R., & Katok, E. (2006). E-sourcing in procurement: Theory and behavior in reverse auctions with noncompetitive contracts. Management Science, 52(4), 581-596.
[14] Faheem, M., & Siddiqui, D. A. (2019). The impact of e-procurement practices on supply chain performance: A case of B2B procurement in Pakistani industry. Available at SSRN 3510616.
[15] Gholampur, S. (2018). E-Procurement Adoption Impacts on Organisations “Performance and Maturity”: An Exploratory Case Study. Bangor University (United Kingdom).
[16] Halilu, I. D. (2016). Electronic procurement and organizational performance, a case study of Roofings Uganda Ltd. Ibem, E. O., & Laryea, S. (2017). E-tendering in the South African construction industry. International Journal of Construction Management, 17(4), 310-328.
[17] Kimberlin, C. L., & Winterstein, A. G. (2008). Validity and reliability of measurement instruments used in research. American journal of health-system pharmacy, 65(23), 2276-2284.
[18] Kothari, C. R. (2004). Research methodology: Methods and techniques. New Age International.
[19] Kumar, R. (2011). RESEARCH METHODOLOGY a step-by-step guide for beginners 3rd ed.
[20] Leonard, S. R. (2000). Electronic procurement. E-business: Key Issues, App Paul T. Kidd.
[21] Okoye, M. M., & Chinyere, N. (2007). E-procurement, Internal Customer Service And External Customers–A Study of Effects And Interdependencies.
[22] Ongola, A. A. (2017). Factors affecting effective implementation of e-procurement in supermarkets’ supply chain management in Nairobi and its environs, Kenya (Doctoral dissertation, Kca University).
[23] Oppong, W. A. (2020). Electronic procurement and organizational performance among commercial state corporations. Journal DOI, 10, 22501991.
[24] Orori, J. M. (2011). Factors that influence the introduction of e-procurement in retail industry: A survey of retail chain supermarkets in Kenya. Unpublished research, Jomo Kenyatta University of Agriculture and Technology.
[25] Osmonbekov, T., Bello, D. C., & Gilliland, D. I. (2002). Adoption of electronic commerce tools in business procurement: enhanced buying center structure and processes. Journal of Business & Industrial Marketing, 17(2/3), 151-166.
[26] Mahdillou, H., & Akbary, J. (2014). E-procurement adoption, its benefits and costs.
[27] Mapendo, d., mutuku, f., & musau, c. (2020). Impact of electronic procurement practices on organinazion performance (doctoral dissertation).
[28] Marei, A. (2022). The effect of e-procurement on financial performance: Moderating the role of competitive pressure. Uncertain Supply Chain Management, 10(3), 855-866.
[29] Matunga, D. A., Nyanamba, S. O., & Okibo, W. (2013). The effect of e-procurement practices on effective procurement in public hospitals: A case of Kisii level 5 hospital. American International Journal of Contemporary Research, 3(8), 103-111.
[30] Mburu, D. K. (2011). The Role of E-Procurement in Enhancing Efficiency in Telecommunication Industry (A Case Study of Safaricom Limited Company-Kenya). Jomo Kenyatta University of Agriculture and Technology.
[31] Mélon, L., & Spruk, R. (2020). The impact of e-procurement on institutional quality. Journal of Public Procurement, 20(4), 333-375.
[32] Metoh, I. K. (2011). Factors Affecting implementation of Electronic Procurement System in the Public Sector.
[33] Mwongela, S. M. (2014). E-procurement adoption and supply chain performance among commercial banks in Nairobi, Kenya (Doctoral dissertation, University of Nairobi).
[34] Ndiiri, F. K. (2016). E-procurement implementation and performance of County governments in Kenya (Doctoral dissertation, University of Nairobi).
[35] Neef, D. (2001). E-Procurement: From strategy to implementation. FT press.
[36] Ng’ang’a, S. K. (2017). The impact of E-procurement on the Operational Performance of Parastatals in the Ministry of Energy and Petroleum in Kenya (Doctoral dissertation, University of Nairobi).
[37] Njoroge, K. K. (2010). Factors Influencing E-Procurement Practices in Construction Industry in Kenya. Jomo Kenyatta University of Agriculture and Technology.
[38] Nyangau, R. M., Kibuine, M., & Ouko, R. A. (2019). Cost of e-procurement system and performance of Nairobi County: A case of City Hall. International Academic Journal of Procurement and Supply Chain Management, 3(1), 164-179.
[39] Rankin, J. H., Chen, Y., & Christian, A. J. (2006). E-procurement in the Atlantic Canadian AEC industry. Journal of Information Technology in Construction (ITcon), 11(6), 75-87.
[40] Rotich, G., Muma, B., & Micheni, E. (2016). E-sourcing, e-maintenance and public procurement performance: A case of Kericho County-Kenya. Science Research, 4(2), 37.
[41] Saastamoinen, J., Tammi, T., & Reijonen, H. (2018). E-procurement and SME involvement in public procurement of innovations: an exploratory study. International Journal of Procurement Management, 11(4), 420-442.
[42] Sharabati, M., Sulaiman, A., & Mohd Salleh, N. A. (2015). End user satisfaction and individual performance assessments in e-procurement systems.
[43] Smart, A. F. (2010). E-procurement and its impact on supply management–evidence from industrial case studies. International Journal of Logistics: Research and Applications, 13(6), 423-440.
[44] Tayebwa, B. (2012). Electronic-Procurement and organizational performance: case study of Nakumatti Supermarket in Kampala, Uganda.
[45] Teklu, d. (2020). Factors affecting the adoption of e-procurement in public organizations: the case of addis ababa city roads authority (doctoral dissertation, st. Mary’s university).
Cite This Article
  • APA Style

    Shewangzaw, B., Omer, A., Aydagn, A. (2026). Effects of Implementing E-Procurement on Organizational Performance: The Case of African Union. Innovation Business, 1(1), 55-77. https://doi.org/10.11648/j.ib.20260101.15

    Copy | Download

    ACS Style

    Shewangzaw, B.; Omer, A.; Aydagn, A. Effects of Implementing E-Procurement on Organizational Performance: The Case of African Union. Innov. Bus. 2026, 1(1), 55-77. doi: 10.11648/j.ib.20260101.15

    Copy | Download

    AMA Style

    Shewangzaw B, Omer A, Aydagn A. Effects of Implementing E-Procurement on Organizational Performance: The Case of African Union. Innov Bus. 2026;1(1):55-77. doi: 10.11648/j.ib.20260101.15

    Copy | Download

  • @article{10.11648/j.ib.20260101.15,
      author = {Belayihun Shewangzaw and Amana Omer and Abrham Aydagn},
      title = {Effects of Implementing E-Procurement on Organizational Performance: The Case of African Union},
      journal = {Innovation Business},
      volume = {1},
      number = {1},
      pages = {55-77},
      doi = {10.11648/j.ib.20260101.15},
      url = {https://doi.org/10.11648/j.ib.20260101.15},
      eprint = {https://article.sciencepublishinggroup.com/pdf/10.11648.j.ib.20260101.15},
      abstract = {This study examined the effect of e-procurement implementation on organizational performance in the African Union. A descriptive and explanatory research design employing both quantitative and qualitative approaches was adopted. The study targeted 230 employees, from which 146 respondents were selected using simple random sampling. Primary data were collected through structured questionnaires and analyzed using descriptive and inferential statistical techniques with SPSS version 26. Validity and reliability tests were conducted to ensure data quality. The findings revealed a statistically significant positive relationship between e-procurement practices and organizational performance. Regression results further confirmed that e-procurement dimensions significantly predict organizational performance. Among the components, e-tendering emerged as the most dominant practice, while e-sourcing, e- payment, and efficiency also demonstrated positive effects on performance outcomes. Overall, the study concludes that effective implementation of e-procurement enhances organizational performance. The study recommends strengthening e-procurement policies, improving stakeholder participation, and creating a supportive institutional environment to sustain performance improvement.},
     year = {2026}
    }
    

    Copy | Download

  • TY  - JOUR
    T1  - Effects of Implementing E-Procurement on Organizational Performance: The Case of African Union
    AU  - Belayihun Shewangzaw
    AU  - Amana Omer
    AU  - Abrham Aydagn
    Y1  - 2026/03/10
    PY  - 2026
    N1  - https://doi.org/10.11648/j.ib.20260101.15
    DO  - 10.11648/j.ib.20260101.15
    T2  - Innovation Business
    JF  - Innovation Business
    JO  - Innovation Business
    SP  - 55
    EP  - 77
    PB  - Science Publishing Group
    UR  - https://doi.org/10.11648/j.ib.20260101.15
    AB  - This study examined the effect of e-procurement implementation on organizational performance in the African Union. A descriptive and explanatory research design employing both quantitative and qualitative approaches was adopted. The study targeted 230 employees, from which 146 respondents were selected using simple random sampling. Primary data were collected through structured questionnaires and analyzed using descriptive and inferential statistical techniques with SPSS version 26. Validity and reliability tests were conducted to ensure data quality. The findings revealed a statistically significant positive relationship between e-procurement practices and organizational performance. Regression results further confirmed that e-procurement dimensions significantly predict organizational performance. Among the components, e-tendering emerged as the most dominant practice, while e-sourcing, e- payment, and efficiency also demonstrated positive effects on performance outcomes. Overall, the study concludes that effective implementation of e-procurement enhances organizational performance. The study recommends strengthening e-procurement policies, improving stakeholder participation, and creating a supportive institutional environment to sustain performance improvement.
    VL  - 1
    IS  - 1
    ER  - 

    Copy | Download

Author Information
  • Abstract
  • Keywords
  • Document Sections

    1. 1. Introduction
    2. 2. Litrature Review
    3. 3. Research Methodology
    4. 4. Data Analysis and Interpretation
    5. 5. Summary, Conclusion, and Recommendation
    Show Full Outline
  • Abbreviations
  • Author Contributions
  • Conflicts of Interest
  • References
  • Cite This Article
  • Author Information