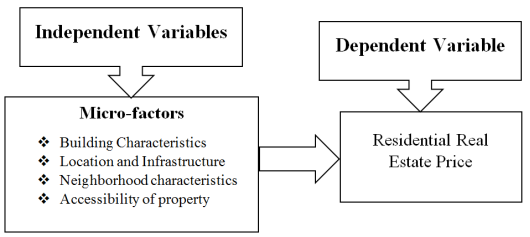
The Ethiopian real estate industry has grown in the previous two decades, especially in the capital city of the country and regional capitals, including Bahir Dar. Real estate prices have doubled and even tripled in a few years because of different factors. Thus, the purpose of this study is to analyse the factors affecting residential real estate prices in Ethiopia, particularly in Bahir Dar City. For this purpose, the study used both purposive and stratified random sampling techniques. Descriptive and inferential statistics were used to analyze the data, and the ordinary least squares method was used to identify the factors that influence residential real estate prices. The hedonic regression model result reveals that R2 statistics (0.880) indicate that 88% of the variation in residential real estate prices can be explained by variation in the independent variables. Hedonic regression model results revealed that plot size, floor area, number of rooms, age of the house, external wall finishing material, ceiling finishing material, the direction of the house, distance of the property from the main road, and involvement of brokers in the transaction process, were major micro-factors that had a significant effect on residential real estate prices at the 5% level of significance. Furthermore, the interview results show that the challenges faced by real estate developers mostly include loans and aid issues, high-interest rates, mortgage restrictions, the financial capacity of real estate companies, delays in plan approvals, and rising costs of construction materials are among the major challenges affecting investment in real estate. The study suggests that the municipality of Bahir Dar City should provide an adequate supply of land to real estate developers, improve infrastructure development, and federal and regional governments should provide the credit lending mechanism by lowering interest rate especially for low-income class.
| Published in | International Journal of Business and Economics Research (Volume 13, Issue 3) |
| DOI | 10.11648/j.ijber.20241303.11 |
| Page(s) | 46-63 |
| Creative Commons |
This is an Open Access article, distributed under the terms of the Creative Commons Attribution 4.0 International License (http://creativecommons.org/licenses/by/4.0/), which permits unrestricted use, distribution and reproduction in any medium or format, provided the original work is properly cited. |
| Copyright |
Copyright © The Author(s), 2024. Published by Science Publishing Group |
Hedonic Regression Model, Micro-Factors, Property Prices, Residential Real Estate
Real Estate Company Name | Type of Real Estate Development | Investment status | Site(s) | Total transacted properties | Sample size = (NJ/N)*n |
|---|---|---|---|---|---|
ACAPULIKO | Residential | Operational | Dagmawi Minilik | 110 | 49=(110/300)*134 |
MULUGETA | Residential | Operational | Dagmawi Minilik | 190 | 85=(190/300)*134 |
Total | 300 | 134 |
Short name | Variable name | Data Type | Measurement | Description of variable | Expected sign |
|---|---|---|---|---|---|
Log_ RREP | Residential real estate price | Numerical | Scale | Defined as natural logarithm of residential real estate price. It is a continuous variable measured in Ethiopian Birr. | Dependent variable |
Log_ GPA | Gross plot area | Numerical | Scale | Log-transformed value of gross plot area. It is a continuous variable measured in square meter | (+) |
Log_ FLA | Floor area | Numerical | Scale | Log-transformed value of floor area. It is a continuous variable measured in square meter | (+) |
Log_ NR | Number of rooms | Numerical | Scale | Log-transformed value of the number of rooms. It is a continuous variable measured in numbers. | (+) |
Log_ AH | Age of the house | Numerical | Scale | Log-transformed value of the age of house. It is measured in years | (-) |
FFM | Floor finishing material | Categorical | Ordinal | It is a categorical variable based on the quality of material Ceramic tile=1, Cement screed=2 | (+) |
EWFM | External wall finishing material | Categorical | Ordinal | It is a categorical variable based on the quality of material 1=Quartz paint, 2= Plastered, 3=Granit paint | (+) |
BR | Broker/Agent | Dummy | Nominal | It is a dummy variable 1= indicates transaction is facilitated by brokers and 0= indicates transaction is held without involvement of brokers | (+) |
CFM | Ceiling finish material | Categorical | Ordinal | It is a categorical variable based on the quality of material 1=Gypsum, 2= Plastic | (+) |
DH | Direction aspect of the house | Dummy | Nominal | It is a dummy variable 1= East aspect, 0= Non- East aspect | (-) |
Log_ DMR | Distance of property from the main road | Numerical | Scale | Log-transformed value of distance from the property to the main road. It is a continuous variable measured in meter | (-) |
LG | Land Grade | Categorical | Ordinal | It is a categorical variable 1= First grade, 2=Second grade, 3= Third grade, 4= Fourth grade | (+) |
RT | Accessible Road Type | Categorical | Ordinal | It is a categorical variable 1= Asphalt, 2= Cobblestone, 3= Gravel, 4= Earthen | (+) |
Descriptive Statistics | |||||
|---|---|---|---|---|---|
Continuous variable | N | Minimum | Maximum | Mean | Std. Deviation |
Residential Real Estate Sales Price in birr | 103 | 1,200,000 | 12,500,000 | 4,567,106.80 | 283,2045.367 |
Gross plot area in square meters (m2) | 103 | 200 | 500 | 295.94 | 61.813 |
Floor area in square meters (m2) | 103 | 100 | 250 | 123.08 | 24.324 |
Age of the house | 103 | 1 | 15 | 5.13 | 3.824 |
Number of rooms | 103 | 3 | 5 | 4.17 | .772 |
Distance from the property to the main road in meter | 103 | 234 | 817 | 543.95 | 144.213 |
Valid N (listwise) | 103 | ||||
Categorical variable | Frequency | Percent | |
|---|---|---|---|
Broker involvement in the transaction process | No | 19 | 18 |
Yes | 84 | 82 | |
Total | 103 | 100 | |
External wall finishing materials | Quartz paint | 87 | 86 |
Plastered with cement | 16 | 14 | |
Total | 103 | 100 | |
Floor finishing materials | Ceramic tile | 88 | 86 |
Cement screed | 15 | 14 | |
Total | 103 | 100 | |
Ceiling finishing materials | Gypsum | 89 | 87 |
Plastic | 14 | 13 | |
Total | 103 | 100 | |
Direction of the house | East Aspect | 66 | 64 |
Non-East Aspect | 37 | 36 | |
Total | 103 | 100 | |
Land Grade | Grade_ 1 | 32 | 31 |
Grade_ 2 | 53 | 52 | |
Grade_ 3 | 18 | 17 | |
Total | 103 | 100 | |
Accessible Road Type | Asphalt | 8 | 7.8 |
Cobblestone | 8 | 7.8 | |
Gravel road | 33 | 32 | |
Earthen | 54 | 52.4 | |
Total | 103 | 100 |
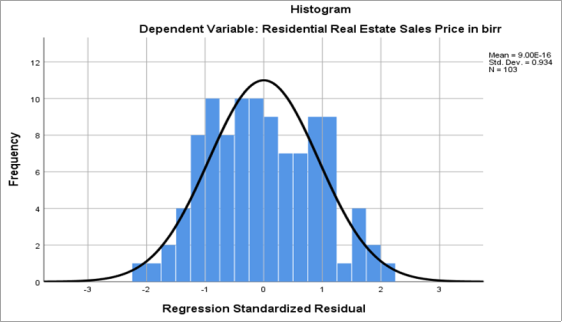
Tests of Normality | ||||||
|---|---|---|---|---|---|---|
Kolmogorov-Smirnova | Shapiro-Wilk | |||||
Statistic | Df | Sig. | Statistic | Df | Sig. | |
Unstandardized Residual | .054 | 103 | .200* | .992 | 103 | .899 |
Model | Collinearity Statistics | ||
|---|---|---|---|
Tolerance | VIF | ||
1 | (Constant) | ||
Broker involvement in the transaction process | 0.711 | 1.407 | |
External wall finishing material | 0.477 | 2.095 | |
Floor finishing material | 0.586 | 1.706 | |
Ceiling finishing material | 0.739 | 1.353 | |
Direction of the house (East=1 Non-East=0) | 0.753 | 1.328 | |
Land grade | 0.685 | 1.460 | |
Accessible road type | 0.865 | 1.156 | |
Log_ floor area in square meter | 0.262 | 3.814 | |
Log_ Gross plot area in square meter | 0.292 | 3.427 | |
Log_ Age of the house in years | 0.392 | 2.548 | |
Log_ Number of rooms | 0.605 | 1.654 | |
Log_ Distance from property to the main road in meter | 0.555 | 1.800 | |
Dependent Variable: Log_ Residential Real Estate Price | |||
Model Summaryb | ||||||||||
|---|---|---|---|---|---|---|---|---|---|---|
Model | R | R Square | Adjusted R Square | Std. Error of the Estimate | Change Statistics | Durbin-Watson | ||||
R Square Change | F Change | df1 | df2 | Sig. F Change | ||||||
1 | .938a | .880 | .864 | .01557 | .880 | 55.175 | 12 | 90 | .000 | 1.835 |
Predicators: (Constant), Direction of the house (East=1 Non-East=0), Log_ Distance of the property from the main road in meter, External wall finishing material, Ceiling finishing material, Accessible road type, Log_ Number of Rooms, Land grade, Floor finishing material, Log_ Gross plot area in square meter, Log_ Age of the House in years, Broker involvement in the transaction process, Log_ Floor Area in square meter | ||||||||||
Dependent Variable: Log_ Residential Real Estate Price | ||||||||||
ANOVAa | ||||||
|---|---|---|---|---|---|---|
Model | Sum of Squares | Df | Mean Square | F | Sig. | |
1 | Regression | .161 | 12 | .013 | 55.175 | .000b |
Residual | .022 | 90 | .000 | |||
Total | .182 | 102 | ||||
Dependent Variable: Log_ Residential Real Estate Price | ||||||
Predicators: (Constant), Direction of the house (East=1 Non-East=0), Log_ Distance of the property from the main road in meter, External wall finishing material, Ceiling finishing material, Accessible road type, Log_ Number of Rooms, Land grade, Floor finishing material, Log_ Gross plot area in square meter, Log_ Age of the house in years, Broker involvement in the transaction process, Log_ Floor Area in square meter | ||||||
Coefficientsa | ||||||
|---|---|---|---|---|---|---|
Model | Unstandardized Coefficients | Standardized Coefficients | T | Sig. | ||
B | Std. Error | Beta | ||||
1 | ( Constant) | 14.539 | .450 | 32.320 | .000 | |
Broker involvement in the transaction process | .468 | .202 | .126 | 2.320 | .023* | |
External wall finishing material | .383 | .183 | .138 | 2.089 | .040* | |
Floor finishing material | .035 | .025 | .083 | 1.391 | .168 | |
Ceiling finishing material | .023 | .023 | .054 | 1.008 | .013* | |
Direction of the house (East=1 Non-East=0) | .456 | .160 | .150 | .285 | .036* | |
Land grade | -.009 | .011 | -.048 | -.865 | .389 | |
Accessible road type | -.001 | .008 | -.005 | -.094 | .925 | |
Log_ Floor Area in square meter | .601 | .175 | .307 | 3.441 | .001* | |
Log_ Gross plot size in square meter | .335 | .110 | .258 | 3.052 | .003* | |
Log_ Age of the House in years | -.187 | .054 | -.250 | -3.434 | .001* | |
Log_ Number of rooms | .148 | .066 | .131 | 2.240 | .028* | |
Log_ Distance of the property from the main road in meter | -.097 | .031 | -.191 | -3.115 | .002* | |
Dependent Variable: Log_ Residential Real Estate Price * Statistically significant at 0.05 | ||||||
S.N | Hypothesis | Sig (P-Value) | Level of Significance | Conclusion |
|---|---|---|---|---|
1 | H1: There is significant relationship between age of the house and prices of residential real estate property | 0.001 | 0.05 | Accepted |
2 | H2: There is significant relationship between number of rooms and prices of residential real estate property | 0.028 | 0.05 | Accepted |
3 | H3: There is significant relationship between floor area and prices of residential real estate property | 0.001 | 0.05 | Accepted |
4 | H4: There is significant relationship between proximity to the main road and prices of residential real estate property | 0.002 | 0.05 | Accepted |
5 | H5: There is significant relationship between gross plot area and prices of residential real estate property | 0.003 | 0.05 | Accepted |
6 | H6: There is significant relationship between broker involvement in the transaction and prices of residential real estate property | 0.023 | 0.05 | Accepted |
7 | H7: There is significant relationship between external wall finishing materials and prices of residential real estate property | 0.040 | 0.05 | Accepted |
8 | H8: There is significant relationship between floor finishing materials and prices of residential real estate property | 0.168 | 0.05 | Reject |
9 | H9: There is significant relationship between ceiling finishing materials and prices of residential real estate property | 0.013 | 0.05 | Accepted |
10 | H10: There is significant relationship between direction of the house and prices of residential real estate property | 0.036 | 0.05 | Accepted |
11 | H11: There is significant relationship between land grade and prices of residential real estate property | 0.389 | 0.05 | Reject |
12 | H12: There is significant relationship between accessible road type and prices of residential real estate property | 0.925 | 0.05 | Reject |
ANOVA | Analysis of Variance |
ANRS | Amhara National Regional State |
CBD | Central Business District |
ETB | Ethiopian Birr |
LOG | Logarithm |
MoUDC | Minster of Urban Development and Construction |
OLS | Ordinary Least Square |
SPSS | Statistical Package Software for Social Science |
| [1] | AQUBAMICHEAL, K. 2009. Factors affecting the real estate market: the case of Addis Ababa city. Unpublished M. SC, Addis Ababa University, Ethiopia. |
| [2] | ASSEFA, E. 2017. PERCEPTION ON FACTORS AFFECTING REAL ESTATE PRICE IN ADDIS ABABA CITY ADMINISTRATION. St. Mary's University. |
| [3] | BOROWIECKI, K. J. 2009. The determinants of house prices and construction: an empirical investigation of the Swiss housing economy. International Real Estate Review, 12, 193-220. |
| [4] | CORTESI, G. 2003. Mastering real estate principles, Dearborn Real Estate. |
| [5] | CRESWELL, J. W., PLANO CLARK, V. L., GUTMANN, M. L. & HANSON, W. E. 2003. Advanced mixed methods research designs. Handbook of mixed methods in social and behavioral research, 209, 209-240. |
| [6] | DENSCOMBE, M. 2008. Communities of practice: A research paradigm for the mixed methods approach. Journal of mixed methods research, 2, 270-283. |
| [7] | DUENWALD, C. 2000. Property Prices and Speculative Bubbles: Evidence from Hong Kong SAR. IMF Working Papers, 2000. |
| [8] | DURBIN, J. & WATSON, G. S. 1971. Testing for serial correlation in least squares regression. III. Biometrika, 58, 1-19. |
| [9] | DZANGMAH, H. T. 2012. Prospects and challenges of rental housing in greater Accra region. |
| [10] | FIDELL, L. S. & TABACHNICK, B. G. 2003. Preparatory data analysis. Handbook of psychology: Research methods in psychology, 2, 115-141. |
| [11] | GILBERT, A. 2003. Rental housing: An essential option for the urban poor in developing countries, Un-habitat. |
| [12] | HARVEY, J. & HARVEY, J. 1981. The Pricing of Land and Land Resources. The Economics of Real Property, 30-42. |
| [13] | HESSELING, R. 1994. Displacement: A review of the empirical literature. Crime prevention studies, 3, 97-230. |
| [14] | HILBERS, P., LEI, Q. & STAUSHOLM ZACHO, L. 2001. Real estate market developments and financial sector soundness. |
| [15] | IMAN, A. H. M. 2006. Basic Aspects of Property Market Research, Penerbit UTM. |
| [16] | KAMAU, M. G. 2011. Our Whole Life Is Our Whole Responsibility, Lulu. com. |
| [17] | KNEESHAW-PRICE, S. H., SAELENS, B. E., SALLIS, J. F., FRANK, L. D., GREMBOWSKI, D. E., HANNON, P. A., SMITH, N. L. & CHAN, K. G. 2015. Neighborhood crime-related safety and its relation to children’s physical activity. Journal of Urban Health, 92, 472-489. |
| [18] | KOTHARI, C. 2017. Research methodology methods and techniques by CR Kothari. Published by New Age International (P) Ltd., Publishers, 91. |
| [19] | MANKIW, N. G. 1998. Principles of Economics: Wall Street Journal Edition, Harcourt College. |
| [20] | MASLOW, A. H. 1943. Conflict, frustration, and the theory of threat. The Journal of Abnormal and Social Psychology, 38, 81. |
| [21] | MATHENGE, R. W. 2017. Effects of Money Supply on Residential Real Estate Pricing in Nairobi County. University of Nairobi. |
| [22] | MAVRODIY, A. 2005. Factor analysis of real estate prices. Kyiv: National University. |
| [23] | MILES, M. B. & HUBERMAN, A. M. 1994. Qualitative data analysis: An expanded sourcebook, sage. |
| [24] | NANCE, C. P. 2003. Modern real estate practice in Texas, Dearborn Real Estate. |
| [25] | NEGASH, Z. S. 2010. Modeling Hedonik Real Estate Price for Small Family Houses in Addis Ababa. Division of Building and Real Estate Economics Department of Real Estate and Construction Management Royal Institute of Technology, Stockholm. |
| [26] | OWUSU-ANSAH, A. 2012. Examination of the determinants of housing values in urban Ghana and implications for policy makers. Journal of African Real Estate Research, 2, 58-85. |
| [27] | PAGLIARA, F., PRESTON, J. & SIMMONDS, D. 2010. Residential location choice: models and applications, Springer Science & Business Media. |
| [28] | PALLANT, J. 2020. SPSS survival manual: A step by step guide to data analysis using IBM SPSS, McGraw-Hill education (UK). |
| [29] | SHAPIRO, S. S. & WILK, M. B. 1965. An analysis of variance test for normality (complete samples). Biometrika, 52, 591-611. |
| [30] | SCHOBER, P., BOER, C. & SCHWARTE, L. A. 2018. Correlation coefficients: appropriate use and interpretation. Anesthesia & analgesia, 126, 1763-1768. |
| [31] | SEBSBE, G., MUHDIN, M. & SOLOMON, A. 2017. Rental house price determinants and affordability in Hawassa City, Ethiopia. Journal of Poverty, Investment and Development, 39, 42-52. |
| [32] | SETH, A. & RAGAB, A. 2012. Macroeconomic vulnerability in developing countries: Approaches and issues. |
| [33] | SHRESTHA, N. 2020. Detecting multicollinearity in regression analysis. American Journal of Applied Mathematics and Statistics, 8, 39-42. |
| [34] | TESFAYE, A. 2007. Problems and prospects of housing development in Ethiopia. Property Management, 25, 27-53. |
| [35] | WANDELER, D. Lessons from rental housing. International Symposium on Architecture and Housing Rights, held at the School for Architecture and Design, King Mongkut’s University of Technology Thonburi, Bangkok, 2006. |
| [36] | YAMANE, T. 1967. Problems to accompany" Statistics, an introductory analysis", Harper & Row. |
| [37] | ZENEBE, S. 2006. The Process and Determinants of Residential House Market in Addis Ababa. Addis Ababa University. |
APA Style
Mekuria, T. M., Yimam, S. H., Negashi, Y. T. (2024). Determinants of Residential Real Estate Property Prices in Ethiopia: The Case of Bahir Dar City. International Journal of Business and Economics Research, 13(3), 46-63. https://doi.org/10.11648/j.ijber.20241303.11
ACS Style
Mekuria, T. M.; Yimam, S. H.; Negashi, Y. T. Determinants of Residential Real Estate Property Prices in Ethiopia: The Case of Bahir Dar City. Int. J. Bus. Econ. Res. 2024, 13(3), 46-63. doi: 10.11648/j.ijber.20241303.11
AMA Style
Mekuria TM, Yimam SH, Negashi YT. Determinants of Residential Real Estate Property Prices in Ethiopia: The Case of Bahir Dar City. Int J Bus Econ Res. 2024;13(3):46-63. doi: 10.11648/j.ijber.20241303.11
@article{10.11648/j.ijber.20241303.11,
  author = {Tamirat Mekonnen Mekuria and Seid Hussen Yimam and Yohans Teshome Negashi},
  title = {Determinants of Residential Real Estate Property Prices in Ethiopia: The Case of Bahir Dar City
},
  journal = {International Journal of Business and Economics Research},
  volume = {13},
  number = {3},
  pages = {46-63},
  doi = {10.11648/j.ijber.20241303.11},
  url = {https://doi.org/10.11648/j.ijber.20241303.11},
  eprint = {https://article.sciencepublishinggroup.com/pdf/10.11648.j.ijber.20241303.11},
  abstract = {The Ethiopian real estate industry has grown in the previous two decades, especially in the capital city of the country and regional capitals, including Bahir Dar. Real estate prices have doubled and even tripled in a few years because of different factors. Thus, the purpose of this study is to analyse the factors affecting residential real estate prices in Ethiopia, particularly in Bahir Dar City. For this purpose, the study used both purposive and stratified random sampling techniques. Descriptive and inferential statistics were used to analyze the data, and the ordinary least squares method was used to identify the factors that influence residential real estate prices. The hedonic regression model result reveals that R2 statistics (0.880) indicate that 88% of the variation in residential real estate prices can be explained by variation in the independent variables. Hedonic regression model results revealed that plot size, floor area, number of rooms, age of the house, external wall finishing material, ceiling finishing material, the direction of the house, distance of the property from the main road, and involvement of brokers in the transaction process, were major micro-factors that had a significant effect on residential real estate prices at the 5% level of significance. Furthermore, the interview results show that the challenges faced by real estate developers mostly include loans and aid issues, high-interest rates, mortgage restrictions, the financial capacity of real estate companies, delays in plan approvals, and rising costs of construction materials are among the major challenges affecting investment in real estate. The study suggests that the municipality of Bahir Dar City should provide an adequate supply of land to real estate developers, improve infrastructure development, and federal and regional governments should provide the credit lending mechanism by lowering interest rate especially for low-income class.
},
 year = {2024}
}
TY  - JOUR
T1  - Determinants of Residential Real Estate Property Prices in Ethiopia: The Case of Bahir Dar City

AU  - Tamirat Mekonnen Mekuria
AU  - Seid Hussen Yimam
AU  - Yohans Teshome Negashi
Y1  - 2024/05/24
PY  - 2024
N1  - https://doi.org/10.11648/j.ijber.20241303.11
DO  - 10.11648/j.ijber.20241303.11
T2  - International Journal of Business and Economics Research
JF  - International Journal of Business and Economics Research
JO  - International Journal of Business and Economics Research
SP  - 46
EP  - 63
PB  - Science Publishing Group
SN  - 2328-756X
UR  - https://doi.org/10.11648/j.ijber.20241303.11
AB  - The Ethiopian real estate industry has grown in the previous two decades, especially in the capital city of the country and regional capitals, including Bahir Dar. Real estate prices have doubled and even tripled in a few years because of different factors. Thus, the purpose of this study is to analyse the factors affecting residential real estate prices in Ethiopia, particularly in Bahir Dar City. For this purpose, the study used both purposive and stratified random sampling techniques. Descriptive and inferential statistics were used to analyze the data, and the ordinary least squares method was used to identify the factors that influence residential real estate prices. The hedonic regression model result reveals that R2 statistics (0.880) indicate that 88% of the variation in residential real estate prices can be explained by variation in the independent variables. Hedonic regression model results revealed that plot size, floor area, number of rooms, age of the house, external wall finishing material, ceiling finishing material, the direction of the house, distance of the property from the main road, and involvement of brokers in the transaction process, were major micro-factors that had a significant effect on residential real estate prices at the 5% level of significance. Furthermore, the interview results show that the challenges faced by real estate developers mostly include loans and aid issues, high-interest rates, mortgage restrictions, the financial capacity of real estate companies, delays in plan approvals, and rising costs of construction materials are among the major challenges affecting investment in real estate. The study suggests that the municipality of Bahir Dar City should provide an adequate supply of land to real estate developers, improve infrastructure development, and federal and regional governments should provide the credit lending mechanism by lowering interest rate especially for low-income class.

VL  - 13
IS  - 3
ER  -
Department of Real Property Valuation, Institute of Land Administration, Oda Bultum University, Chiro, Ethiopia
Department of Real Property Valuation, Institute of Land Administration, Bahir Dar University, Bahir Dar, Ethiopia
Department of Real Property Valuation, College of Business and Economics, Dire Dawa University, Dire Dawa, Ethiopia
Information