Understanding the amount and distribution of genetic diversity is crucial in breeding programs. This study aimed to assess the variation in qualitative morphological traits among 17 Arabica coffee genotypes. The traits displayed a wide range of phenotypic variation, with the Shannon-Weaver diversity index ranging from 0.22 to 1.12 with a mean of 0.67. The chi-square test revealed significant differences for most of the traits, suggesting dominant phenotypic variation among the evaluated traits. Path coefficient analysis showed a positive direct effect of angle of insertion of primary branches (0.485), canopy diameter (0.264), overall appearance (0.101), and leaf apex shape (0.014) on branching habit. According to the PCA, leaf shape (-0.41) and fruit color (-0.36) from the first PCA and leaf apex shape (-0.43) from the second PCA were the important variables contributing more to the variations. The genotypes were classified into five clusters and the pairwise generalized squared distance among the clusters showed significant divergence between most of the clusters. In conclusion, the present study confirmed the existence of qualitative morphological trait variation among evaluated South Ethiopian Arabica coffee genotypes. It is recommended that the studied genotypes be properly conserved and utilized for the coffee genetic improvement program through selection and hybridization.
| Published in | International Journal of Biomedical Science and Engineering (Volume 14, Issue 1) |
| DOI | 10.11648/j.ijbse.20261401.11 |
| Page(s) | 1-13 |
| Creative Commons |
This is an Open Access article, distributed under the terms of the Creative Commons Attribution 4.0 International License (http://creativecommons.org/licenses/by/4.0/), which permits unrestricted use, distribution and reproduction in any medium or format, provided the original work is properly cited. |
| Copyright |
Copyright © The Author(s), 2026. Published by Science Publishing Group |
Cluster Analysis, Genetic diversity, Principal Component Analysis, Qualitative Traits, Shannon Diversity Index
Serial No. | Genotypes | Description | Source |
|---|---|---|---|
1 | AW105 | Promising Selection | ARSC |
2 | AW1777 | Promising Selection | ARSC |
3 | AW1995 | Promising Selection | ARSC |
4 | AW3106 | Promising Selection | ARSC |
5 | AW4994 | Promising Selection | ARSC |
6 | AW5994 | Promising Selection | ARSC |
7 | AW7494 | Promising Selection | ARSC |
8 | AW7705 | Promising Selection | ARSC |
9 | AW9622 | Promising Selection | ARSC |
10 | AW9623 | Promising Selection | ARSC |
11 | AW9628 | Promising Selection | ARSC |
12 | AW9641 | Promising Selection | ARSC |
13 | AW9644 | Promising Selection | ARSC |
14 | AW9662 | Promising Selection | ARSC |
15 | Feyate | Released Variety | ARSC |
16 | Angafa | Released Variety | ARSC |
17 | 74112 | Released Variety | JARC |
No. | Traits | Trait Description | Code | No. | Traits | Trait Description | Code |
|---|---|---|---|---|---|---|---|
1 | PH | Very short | 1 | 9 | YSC | Green | 1 |
Short | 3 | Dark brown | 2 | ||||
Tall | 7 | Other | 3 | ||||
very tall | 9 | 10 | OAA | Elongated conical | 1 | ||
2 | BH | Very few branches (primary) | 1 | Pyramidal | 2 | ||
Many branches (primary) with few secondary | 2 | Bushy | 3 | ||||
Many branches (primary) | 3 | 11 | CD | Compact | 1 | ||
Many branches (primary) with many secondary and tertiary | 4 | Intermediate | 2 | ||||
3 | AIPB | Drooping | 1 | Open | 3 | ||
Horizontal | 2 | 12 | FC | Yellow | 1 | ||
Semi erect | 3 | Yellow orange | 2 | ||||
4 | SS | Round | 1 | Orange | 3 | ||
Ovate | 2 | Orange-red | 4 | ||||
Triangular | 3 | Red | 5 | ||||
Deltate (equilaterally triangular) | 4 | Red – purple | 6 | ||||
Trapeziform, | 5 | Purple | 7 | ||||
Other | 6 | Purple-violet | 8 | ||||
5 | YLC | Greenish | 1 | Violet | 9 | ||
Green | 2 | Black | 10 | ||||
Brownish | 3 | Others | 11 | ||||
Reddish | 4 | 13 | FSH | Roundish | 1 | ||
Bronze | 5 | Obovate | 2 | ||||
Others if any | 6 | Ovate | 3 | ||||
6 | LSH | Obovate | 1 | Elliptic | 4 | ||
Ovate | 2 | Oblong | 5 | ||||
Elliptic | 3 | Others | 6 | ||||
Lanceolate | 4 | 14 | PTH | Thin | 3 | ||
Others if any | 5 | Intermediate | 5 | ||||
7 | LASH | Round | 1 | Thick | 7 | ||
Obtuse | 2 | 15 | SSH | Round | 1 | ||
Acute | 3 | Obovate | 2 | ||||
Acuminate | 4 | Ovate | 3 | ||||
Apiculate, spatulate | 5 | Elliptic | 4 | ||||
Others | 6 | Oblong | 5 | ||||
8 | LPC | Green | 1 | Others if any | 6 | ||
Dark brown | 2 | ||||||
Other | 3 |
Trait | Code | Frequency | % contribution | Contribution to Chi-Square | Chi-Sq | ||
|---|---|---|---|---|---|---|---|
Plant height | 3 | Short | 1 | 5.88 | 3.84 | 18.47** | 0.578 |
7 | Tall | 14 | 82.35 | 12.25 | |||
9 | Very tall | 2 | 11.76 | 2.37 | |||
Branching habit | 3 | Many branches (primary) | 9 | 52.94 | 0.03 | 0.06ns | 0.691 |
4 | Many branches (primary) with many secondary and tertiary | 8 | 47.06 | 0.03 | |||
Angle of insertion of primary brunch | 1 | Drooping | 8 | 47.06 | 0.03 | 0.07ns | 0.691 |
2 | Horizontal | 9 | 52.94 | 0.03 | |||
Stipule shape | 3 | Triangular | 11 | 64.71 | 5.02 | 8.94* | 0.808 |
4 | Deltate (equilaterally triangular) | 5 | 29.41 | 0.08 | |||
5 | Trapeziform, | 1 | 5.88 | 3.84 | |||
Young leaf color | 1 | Greenish | 1 | 5.88 | 3.84 | 11.41** | 0.753 |
2 | Green | 4 | 23.53 | 0.49 | |||
5 | Bronze | 12 | 70.59 | 7.08 | |||
Leaf shape | 3 | Elliptic | 15 | 88.24 | 4.97 | 9.94* | 0.362 |
4 | Lanceolate | 2 | 11.76 | 4.97 | |||
Leaf apex shape | 1 | Round | 1 | 5.88 | 3.84 | 5.76* | 0.876 |
4 | Acuminate | 8 | 47.06 | 0.96 | |||
5 | Apiculate, spatulate | 8 | 47.06 | 0.96 | |||
Leaf petiole color | 1 | Green | 16 | 94.12 | 6.62 | 13.24** | 0.224 |
3 | Other | 1 | 5.88 | 6.62 | |||
Young shoot color | 1 | Green | 5 | 29.41 | 1.44 | 2.88ns | 0.606 |
3 | Dark brown | 12 | 70.59 | 1.44 | |||
Overall appearance | 1 | Elongated conical | 2 | 11.76 | 4.97 | 9.94* | 0.362 |
2 | Pyramidal | 15 | 88.24 | 4.97 | |||
Canopy Diameter | 1 | Compact | 2 | 11.76 | 2.37 | 5.76* | 0.924 |
2 | Intermediate | 5 | 29.41 | 0.08 | |||
3 | Open | 10 | 58.82 | 3.31 | |||
Fruit colour | 4 | Orange-red | 1 | 5.88 | 3.84 | 23.06** | 0.444 |
5 | Red | 15 | 88.24 | 15.37 | |||
6 | Red – purple | 1 | 5.88 | 3.84 | |||
Fruit shape | 1 | Roundish | 6 | 35.29 | 0.02 | 7.18* | 0.846 |
2 | Obovate | 10 | 58.82 | 3.31 | |||
3 | Ovate | 1 | 5.88 | 3.84 | |||
Pulp thickness | 4 | Thin | 1 | 5.88 | 3.84 | 8.94* | 0.808 |
5 | Intermediate | 11 | 64.71 | 5.02 | |||
6 | Thick | 5 | 29.41 | 0.08 | |||
Seed shape | 1 | Round | 2 | 11.76 | 1.19 | 10.53* | 1.122 |
2 | Obovate | 10 | 58.82 | 7.78 | |||
3 | Ovate | 3 | 17.65 | 0.37 | |||
4 | Elliptic | 2 | 11.76 | 1.19 |
FC | FS | PT | SS | PH | BH | AIPB | SH | YLC | LS | LAS | LPC | YSC | OA | CD | |
|---|---|---|---|---|---|---|---|---|---|---|---|---|---|---|---|
FC | 1 | -0.601** | -0.314* | -0.208ns | -0.577** | -0.144ns | 0.344* | -0.286* | -0.349* | 0.532** | 0.000ns | 0.000ns | -0.376* | -0.532** | -0.493** |
FS | 1 | 0.412** | 0.560** | 0.174ns | 0.073ns | -0.280* | 0.010ns | 0.370* | -0.452** | 0.267* | -0.309* | 0.346* | 0.13 ns | 0.052ns | |
PT | 1 | 0.632** | 0.182ns | 0.02 ns | -0.241ns | 0.063ns | 0.275 * | -0.158ns | -0.133ns | -0.108ns | 0.278* | 0.158ns | 0.173ns | ||
SS | 1 | 0.120ns | 0.093ns | 0.05 ns | -0.245ns | 0.228ns | -0.352* | 0.264ns | -0.393** | 0.231ns | 0.130ns | 0.066ns | |||
PH | 1 | 0.198ns | -0.397** | 0.000ns | 0.202ns | -0.615** | 0.104ns | 0.000ns | 0.217ns | 0.615** | 0.427** | ||||
BH | 1 | 0.417** | -0.058ns | 0.122ns | -0.344* | 0.203* | -0.236ns | 0.091ns | 0.344* | 0.548** | |||||
AIPB | 1 | -0.335* | -0.362* | -0.022ns | 0.290* | -0.265* | -0.350* | 0.022ns | 0.299* | ||||||
SH | 1 | 0.239ns | 0.358* | -0.622** | 0.662** | 0.228ns | -0.054ns | -0.323* | |||||||
YLC | 1 | -0.138ns | -0.346* | 0.160ns | 0.989** | 0.138ns | 0.030ns | ||||||||
LS | 1 | -0.685** | 0.685** | -0.165ns | -0.433** | -0.509** | |||||||||
LAS | 1 | -0.862** | -0.342* | -0.079ns | 0.146ns | ||||||||||
LPC | 1 | 0.161ns | 0.091ns | -0.169ns | |||||||||||
YSC | 1 | 0.165ns | 0.065ns | ||||||||||||
OA | 1 | 0.772** | |||||||||||||
CD | 1 |
AIPB | LS | LAS | OA | CD | |
|---|---|---|---|---|---|
AIPB | 0.485 | 0.000 | 0.004 | -0.002 | 0.079 |
LS | -0.011 | -0.003 | -0.009 | 0.044 | -0.134 |
LAS | 0.141 | 0.002 | 0.014 | 0.008 | 0.039 |
OA | 0.011 | 0.001 | -0.001 | 0.101 | 0.204 |
CD | 0.145 | 0.001 | 0.002 | -0.078 | 0.264 |
Eigenvectors | |||||
|---|---|---|---|---|---|
PCA1 | PCA2 | PCA3 | PCA4 | PCA5 | |
Fruit colour | -0.36 | -0.2 | -0.12 | 0.17 | -0.03 |
Fruit shape | 0.30 | 0.09 | -0.35 | -0.06 | 0.04 |
Pulp thickness | 0.22 | 0.15 | -0.25 | 0.16 | 0.59 |
Seed shape | 0.26 | -0.04 | -0.38 | 0.24 | 0.38 |
Plant height | 0.31 | 0.10 | 0.22 | -0.42 | -0.01 |
Branching habit | 0.22 | -0.11 | 0.29 | 0.40 | -0.15 |
Angle of insertion of primary branches | -0.05 | -0.34 | 0.18 | 0.52 | 0.04 |
Stipule shape | -0.11 | 0.39 | 0.09 | -0.06 | 0.06 |
Young leaf color | 0.19 | 0.36 | -0.15 | 0.3 | -0.41 |
Leaf shape | -0.41 | 0.18 | 0.02 | 0.2 | 0.21 |
Leaf apex shape | 0.18 | -0.43 | -0.18 | -0.19 | -0.19 |
Leaf petiole color | -0.21 | 0.39 | 0.27 | 0.00 | 0.15 |
Young shoot color | 0.20 | 0.36 | -0.13 | 0.29 | -0.4 |
Overall appearance | 0.30 | 0.06 | 0.41 | -0.02 | 0.20 |
Canopy Diameter | 0.31 | -0.1 | 0.42 | 0.16 | 0.13 |
EV | 4.39 | 3.51 | 2.14 | 1.34 | 1.11 |
PVE | 29.26% | 23.42% | 14.26% | 8.95% | 7.37% |
CPVE | 29.26% | 52.68% | 66.94% | 75.89% | 83.26% |
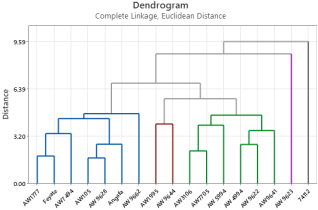
Cluster No. | Number of Genotype | Percent (%) | List of genotype |
|---|---|---|---|
I | 1 | 5.88 | 74112 |
II | 1 | 5.88 | AW9623 |
III | 6 | 35.29 | AW3106, AWAW7705, AW5994, AW4994, AW9622, AW9641 |
IV | 2 | 11.76 | AW1995, AW9644 |
V | 7 | 41.18 | AW1777, Feyate, AW7494, AW105, AW9628, Angafa, AW9662 |
I | II | III | IV | V | |
|---|---|---|---|---|---|
I | 0 | 3.332ns | 4.023* | 8.166* | 7.032* |
II | 0 | 3.135ns | 7.768* | 7.570* | |
III | 0 | 7.290* | 7.501* | ||
IV | 0 | 9.086* | |||
V | 0 |
AIPB | Angle of Insertion of Primary Branch |
BH | Branching Habit |
CD | Canopy Diameter |
D2 | Pairwise Generalized Squared Distance |
DNA | Deoxyribonucleic Acid |
FC | Fruit Colour |
FSH | Fruit Shape |
H' | Shannon Diversity Index |
IPGRI | International Plant Genetic Resources Institute |
LASH | Leaf Apex Shape |
LPC | Leaf Petiole Colour |
LSH | Leaf Shape |
OAA | Overall Appearance |
PCA | Principal Component Analysis |
PH | Plant Height |
PT | Pulp Thickness |
R | Correlation Coefficient |
SS | Stipule Shape |
SSH | Seed Shape |
YLC | Young Leaf Colour |
YSC | Young Shoot Colour |
χ2 | Chi-square |
| [1] | Adem, A., (2009): Agro-morphological characterization of coffee (Coffea arabica L.) landrace collected from Mesela, West Harerge, Ethiopia. M.Sc. Thesis Submitted to Graduate Studies of Hawassa University, Hawassa, Ethiopia. 88 pp. |
| [2] | Ajema, L., & Nigussie, A. (2021): Yield and Yield Advantage of the Component Crops as Affected by Strip Intercropping of Coffee (Coffea arabica L.) with Pineapple (Ananas comosus L.). American Journal of BioScience, 9(4), 116. |
| [3] | Al-Sayed, H. M., Fateh, H. S., Fares, W. M., Attaya, A. S., (2012): Multivariate analysis of sugar yield factors in sugarcane. Am.-Eurasian J. Sustain. Agric. (AEJSA) 6 (1), 44–50. |
| [4] | Ameha, M., (1986): The significance of Ethiopian coffee genetic resources to coffee improvement. In the proceedings of an international symposium on the conservation and utilization of Ethiopian germplasm, pp. 247-253. Addis Ababa, Ethiopia, 13-16 October, 1986. |
| [5] | Asegid, A. (2019): Morphological Characterization of Bale and West Arsi Coffee (Coffea arabica L.) Collections at Gera, Southwest Ethiopia. A thesis Submitted for the Partial Fulfillment of the Degree of Masters of Science in Plant Breeding of Jimma University. PP 1-91. |
| [6] | Atinafu, G., & Mohammed, H. (2017): Agro-Morphological Characterization of Sidama Coffee (Coffea Arabica L.) Germplasm Accession under its Specialty Coffee Growing Area, Awada, Southern Ethiopia. International Journal of Research Studies in Science, Engineering and Technology. 4(12) 11-23. |
| [7] | Bicho, N. C. C., Oliveira, J. F. S., Leitão, A. E., Ramalho J. C. and Lidon, F. C. (2011): Coffee – Origins, Production, Processing and Quality Definition. Livraria Escolar Editora. P. 170, Lisboa, Portugal. |
| [8] | Burkhardt J., Kufa, T., Beining, A., Goldbach, H. E., Fetene, M. (2007): Drought adaptation strategies of Coffea arabica populations along a rainfall gradient in Ethiopia. 21st International Conference on Coffee Science, Montpellier, France, 11–15 September: 1032–1036. |
| [9] | Carvalho, F. G., Sera, G. H., Andreazi, E., Sera, T., de Barista Fonseca, I. C. B., Carducci, C., et al. (2017): Drought tolerance in seedlings of coffee genotypes carrying genes of different species. Coffee Sci. 12, 9–16. |
| [10] | CSA (Central Statistical Authority), (2015): Federal Republic of Ethiopia, Central Statistical Agency, Agricultural Sample Survey Report on Area and Production of Major Crops, 2014/2015, Vol. 1, Statistical Bulletin 578, May 2015, Addis Ababa, 121P. |
| [11] | Davis, A. P., Kiwuka, C., Faruk, A., Mulumba, J., Kalema, J. (2023): A review of the indigenous coffee resources of Uganda and their potential for coffee sector sustainability and development. Frontiers in Plant Science. 1-14. |
| [12] | Davis, A. P. (2011): Psilanthusmannii, the type species of Psilanthus, transferred to Coffea. Nordic Journal of Botany, 29: 471–472. |
| [13] | Davis, A. P., Chadburn, H., Moat, J., O’Sullivan, R.., Hargreaves, S., and Nic Lughadha, E. (2019): High extinction risk for wild coffee species and implications for coffee sector sustainability. Sci. Adv. 5, eaav3473. |
| [14] | Degefa, M. (2021): Phenotypic Classification of Coffee (Coffea arabica L.) Germplasm in Southern Ethiopia. American Journal of Agriculture and Forestry, 9(6), 358. |
| [15] | Desalegn, A. (2018): Genetic Variability and Character Association of Amaro Coffee (Coffea arabica l.) Accessions at Awada, Southern Ethiopia. Thesis Submitted to Graduate Studies of Jimma University, Jimma, Ethiopia. P1-38. |
| [16] | Dewey, D. R., Lu, K. H. (1959): A correlation and path coefficient analysis of components of crested wheat grass seed production. Agro. J. 51: 515-518. |
| [17] | Endale, T., Kufa, T., Nestre, A., Shimber, T., Yilma, A., Ayano, T. (2008): Research on coffee field management. Proceedings of the workshop on four decades of coffee research and development in Ethiopia: A National workshop, Addis Ababa, Ethiopia. pp. 187-195. |
| [18] | Gebreselassie, H., Tesfaye, B., Gedebo, A. (2024): Genetic diversity of Arabica coffee genotypes in south Ethiopia using quantitative agro-morphological traits. Genet Resour Crop Evol 71, 3485–3506. |
| [19] | Hein, L., Gatzweiler, F. (2006): The economic value of coffee (Coffea arabica) genetic resources. Ecol Econ 60: 176–185. |
| [20] | ICO (International Coffee Organization) (2018): Coffee market report. Available at |
| [21] | IPGRI (International Plant Genetic Resources Institute) (1996): Descriptions of coffea spp. and Psilanthus spp. International Plant Genetics Resource Institute, Rome. |
| [22] | Jeffers, J. N. (1967): Two case studies in the application of principal component analysis. Appl. Stat. 16: 225-36. |
| [23] | Kebede, M. and Bellachew, B. (2008). Phenotyoic Diversity in the Hararge Coffee (Coffee arabica L) Germplasm for Quantitative Traits. East African Journal of Sciences, 2, 13-18. |
| [24] | Minter, M., Nielsen, E. S., Blyth, C., Bertola, L. D., Kantar, M. B., Morales, H. E., Orland, C., Segelbacher, G., Leigh, D. M. (2021): What Is Genetic Diversity and Why Does it Matter? Frontiers for Young Minds, 9:.656168 |
| [25] | Montagnon, C. and Bouharmont, P. (1996): Multivariate analysis of phenotypic diversity of Coffea arabica. Genetic. Resour. Crop. Evol. 43: 221 – 227. |
| [26] |
NASA (National Aeronautics and Space Administration) (2023): ArcGIS World Geocoding Service Power data access viewer. Retrieved from
https://power.larc.nasa.gov/data-access-viewer/ Accessed 13 June 2023 |
| [27] | Ndikumana, J. (2022): Agro-morphological Characterization of Arabica Coffee Cultivars in Burundi. A Thesis Submitted in Partial Fulfilment of the Requirements for the degree of Master of Science in Plant Breeding of the Jomo Kenyatta University of Agriculture and Technology. P1-135. |
| [28] |
Rain, R.. (2023): "Shannon Diversity Index Calculator". Available at:
https://www.omnicalculator.com/ecology/shannon-index Accessed: 10 May 2023. |
| [29] | Salgotra, R. K., & Chauhan, B. S. (2023): Genetic Diversity, Conservation, and Utilization of Plant Genetic Resources. Genes, 14(1). |
| [30] | Samper, L, Giovannucci, D., Marques-Vieira, L. (2017): The Powerful Role of Intangibles in the Coffee Value Chain. WIPO Economic Research Working Paper No. 39. Geneva: WIPO. |
| [31] | Sarada K. (2017): Sustainable Coffee Production. Oxford Research Encyclopedia of Environmental Science. 1-3 |
| [32] | Selvakumar, M. and Sreenivasan, M. S. (1989): Studies on morphology and quality of Ethiopian arabica coffee. Journal of Plantation Crops, 16, pp. 321-324. |
| [33] | Shannon, C. E., & Weaver, W. (1949): The Mathematical Theory of Communication. Urbana, IL: The University of Illinois Press, 1-117. |
| [34] | Singh, B. D. (2001): Plant breeding: Principles and Methods. Kalyani Publishers, New Delhi. 896p. |
| [35] | Tatari, M., & Abdollahi, H. (2021): Evaluation of Vegetative and Reproductive Characteristics of Some Quince (Cydonia Oblonga Mill.) Genotypes from Central Regions of Iran. International Journal of Fruit Science, 21(1), 945–954. |
| [36] | Temesgen, B. (2021): Role and economic importance of crop genetic diversity in food security. International Journal of Agricultural Science and Food Technology, 7, 164–169. |
| [37] | Tesfa, M. (2022): Characterization and Estimation of Diversity of Sugarcane (Saccharum officinarum) Genotypes Based on Qualitative Morphological Traits. 1–17. |
| [38] | Tsehaye, Y., Kebebew F. (2002): Morphological diversity and geographic distribution of adaptive traits in finger millet (Eleusine coracana (L.) Gaertn. Subsp. coracana [Poaceae]) populations from Ethiopia. Addis Ababa, Ethiopia. |
| [39] | USDA (The United States Department of Agriculture), (2023): Ethiopia Coffee Annual Report, GAIN Report Number: ET2023-0014, 7p. |
| [40] | Vavilov, N. I. (1951): The origin, variation, immunity and breeding of cultivated plants. (Translated by S. K. Chestitee). Chronica Botonica, 13, 1-366. |
| [41] | Weldemichael, G. (2021): Phenotypic Diversity of Ethiopian Coffee (Coffea arabica L.) Accessions Collected from Gomma District in Jimma Zone for Qualitative Traits. International Journal of Research Studies in Science, Engineering and Technology 7(8): 08-14. |
| [42] | Yigzaw D. (2005): Assessment of cup quality, morphological, biochemical and molecular diversity of Coffea arabica L. genotypes of Ethiopia. PhD. Thesis, University Free State. 197 pp. |
| [43] | Yirga, M. (2021): Phenotypic Characterization of Coffee (Coffea Arabica L.) Germplasm, in Ethiopia. American Journal of BioScience, 9(2), 34. |
| [44] | Zhu, Y., Liang, D., Song, Z., Tan, Y., Guo, X., & Wang, D. (2022): Genetic Diversity Analysis and Core Germplasm Collection Construction of Camellia oleifera Based on Fruit Phenotype and SSR Data. Genes, 13(12). |
APA Style
Gebreselassie, H., Tesfaye, B., Gedebo, A. (2026). Phenotypic Diversity of Arabica Coffee (Coffea Arabica L.) Genotypes for Qualitative Characteristics at Awada, Ethiopia. International Journal of Biomedical Science and Engineering, 14(1), 1-13. https://doi.org/10.11648/j.ijbse.20261401.11
ACS Style
Gebreselassie, H.; Tesfaye, B.; Gedebo, A. Phenotypic Diversity of Arabica Coffee (Coffea Arabica L.) Genotypes for Qualitative Characteristics at Awada, Ethiopia. Int. J. Biomed. Sci. Eng. 2026, 14(1), 1-13. doi: 10.11648/j.ijbse.20261401.11
@article{10.11648/j.ijbse.20261401.11,
  author = {Habtamu Gebreselassie and Bizuayehu Tesfaye and Andargachewu Gedebo},
  title = {Phenotypic Diversity of Arabica Coffee (Coffea Arabica L.) Genotypes for Qualitative Characteristics at Awada, Ethiopia},
  journal = {International Journal of Biomedical Science and Engineering},
  volume = {14},
  number = {1},
  pages = {1-13},
  doi = {10.11648/j.ijbse.20261401.11},
  url = {https://doi.org/10.11648/j.ijbse.20261401.11},
  eprint = {https://article.sciencepublishinggroup.com/pdf/10.11648.j.ijbse.20261401.11},
  abstract = {Understanding the amount and distribution of genetic diversity is crucial in breeding programs. This study aimed to assess the variation in qualitative morphological traits among 17 Arabica coffee genotypes. The traits displayed a wide range of phenotypic variation, with the Shannon-Weaver diversity index ranging from 0.22 to 1.12 with a mean of 0.67. The chi-square test revealed significant differences for most of the traits, suggesting dominant phenotypic variation among the evaluated traits. Path coefficient analysis showed a positive direct effect of angle of insertion of primary branches (0.485), canopy diameter (0.264), overall appearance (0.101), and leaf apex shape (0.014) on branching habit. According to the PCA, leaf shape (-0.41) and fruit color (-0.36) from the first PCA and leaf apex shape (-0.43) from the second PCA were the important variables contributing more to the variations. The genotypes were classified into five clusters and the pairwise generalized squared distance among the clusters showed significant divergence between most of the clusters. In conclusion, the present study confirmed the existence of qualitative morphological trait variation among evaluated South Ethiopian Arabica coffee genotypes. It is recommended that the studied genotypes be properly conserved and utilized for the coffee genetic improvement program through selection and hybridization.},
 year = {2026}
}
TY  - JOUR
T1  - Phenotypic Diversity of Arabica Coffee (Coffea Arabica L.) Genotypes for Qualitative Characteristics at Awada, Ethiopia
AU  - Habtamu Gebreselassie
AU  - Bizuayehu Tesfaye
AU  - Andargachewu Gedebo
Y1  - 2026/01/26
PY  - 2026
N1  - https://doi.org/10.11648/j.ijbse.20261401.11
DO  - 10.11648/j.ijbse.20261401.11
T2  - International Journal of Biomedical Science and Engineering
JF  - International Journal of Biomedical Science and Engineering
JO  - International Journal of Biomedical Science and Engineering
SP  - 1
EP  - 13
PB  - Science Publishing Group
SN  - 2376-7235
UR  - https://doi.org/10.11648/j.ijbse.20261401.11
AB  - Understanding the amount and distribution of genetic diversity is crucial in breeding programs. This study aimed to assess the variation in qualitative morphological traits among 17 Arabica coffee genotypes. The traits displayed a wide range of phenotypic variation, with the Shannon-Weaver diversity index ranging from 0.22 to 1.12 with a mean of 0.67. The chi-square test revealed significant differences for most of the traits, suggesting dominant phenotypic variation among the evaluated traits. Path coefficient analysis showed a positive direct effect of angle of insertion of primary branches (0.485), canopy diameter (0.264), overall appearance (0.101), and leaf apex shape (0.014) on branching habit. According to the PCA, leaf shape (-0.41) and fruit color (-0.36) from the first PCA and leaf apex shape (-0.43) from the second PCA were the important variables contributing more to the variations. The genotypes were classified into five clusters and the pairwise generalized squared distance among the clusters showed significant divergence between most of the clusters. In conclusion, the present study confirmed the existence of qualitative morphological trait variation among evaluated South Ethiopian Arabica coffee genotypes. It is recommended that the studied genotypes be properly conserved and utilized for the coffee genetic improvement program through selection and hybridization.
VL  - 14
IS  - 1
ER  -
Crop Research Directorate, Wondo Genet Center, Wondogenet, Ethiopia;Scool of Plant and Horticultural Science, Hawassa University, Hawassa, Ethiopia
Scool of Plant and Horticultural Science, Hawassa University, Hawassa, Ethiopia
Scool of Plant and Horticultural Science, Hawassa University, Hawassa, Ethiopia
Information