Research Article | | Peer-Reviewed

Research on Influencing Factors and Prediction of Drag Reducing Agent Effectiveness in Oil Pipeline Transportation

Received: 27 February 2025     Accepted: 13 March 2025     Published: 21 March 2025
Views:       Downloads:
Abstract

This study is a comprehensive and in-depth investigation of the performance of drag-reducing agents (DRA) for pipeline oil products. Systematic experiments were conducted using a specially constructed indoor loop experimental device, using drag reduction rate as a metric. During the experimental process, variables such as DRA concentration and Reynolds number were precisely regulated to analyze the mechanism and influence law of these factors on the drag reduction rate. Based on a large amount of experimental data, a drag reduction rate prediction fitting formula is proposed that integrally considers relevant parameters such as drag-reducing agent concentration, Reynolds number, temperature, pipe diameter, and oil properties. The structure of the formula is designed to incorporate the mechanism and influencing factors of the DRA, and specific coefficients are introduced to express the relationship between the drag reduction rate and various aspects. Subsequently, the formula is fitted and validated using indoor experimental data and field data from actual crude oil pipeline transportation. The results show that the proposed fitting formula has high accuracy and reliability under different operating conditions. This formula and the accompanying validation method are expected to be effective tools for predicting drag reduction rates. This study provides a solid theoretical basis and strong technical support for the optimization of the additive amount of DRA in the crude oil pipeline transportation process and the precise regulation of transportation parameters, which is expected to be widely used and deeply promoted in the pipeline transportation link in the field of petroleum industry, and provides a reference example for the subsequent related research and technical improvement.

Published in International Journal of Economy, Energy and Environment (Volume 10, Issue 2)
DOI 10.11648/j.ijeee.20251002.11
Page(s) 17-30
Creative Commons

This is an Open Access article, distributed under the terms of the Creative Commons Attribution 4.0 International License (http://creativecommons.org/licenses/by/4.0/), which permits unrestricted use, distribution and reproduction in any medium or format, provided the original work is properly cited.

Copyright

Copyright © The Author(s), 2025. Published by Science Publishing Group

Keywords

Oil Pipeline Transportation, Drag Reducing Agent, Turbulent, Fluid Flow, Fitting Prediction

1. Introduction
The development and progress of human society cannot be separated from energy, in today's global energy supply system, crude oil as a basic strategic resource, still occupies a major position in the global energy structure , the efficiency and stability of its transportation is directly related to the economic development and energy security of each country and region . Pipeline transportation has become the first choice for long-distance transportation of crude oil due to its significant advantages such as large transportation volume, strong continuity, low loss, and little interference from the external environment . However, the problem of friction resistance due to relative motion between the oil and the pipe wall as well as between the molecular layers within the oil is always present during the flow of crude oil in the pipeline. This problem leads to a large amount of energy wasted on overcoming friction work, seriously reducing the pipeline transportation efficiency. And to a certain extent, it restricts the further improvement of pipeline transportation capacity, and becomes one of the key technical bottlenecks restricting the development of crude oil pipeline transportation . In the face of this major problem, the search has begun for ways to minimize the energy loss of crude oil in pipeline transportation .
The emergence of drag-reducing agents (DRA) technology has opened up a new way to effectively solve this problem , DRA is mainly some polymer or surfactant, adding a small amount of drag reducer in the pipeline can significantly reduce the friction loss of crude oil, increase the pipeline's conveying capacity, without affecting the pipeline conditions and the properties of the oil, compared to adding pumping stations along the pipeline or increasing the operating pressure of pumping stations, the use of DRA can significantly reduce costs . The phenomenon of drag reduction was first introduced by Toms in the mid-20th century, when he found that the addition of low concentrations of polymethylmethacrylate (PMM) polymers could result in a drag reduction of up to 40%, and referred to the materials used in this phenomenon as DRA . Since then, many researchers have continued to invest a great deal of research in this area and have pushed the drag reducer technology towards practical applications. Virk collected experimental data on the reduction of turbulent drag by polymer solutions and published these results in a review paper . The first use of DRA in crude oil pipeline transportation in Alaska in 1979, with the addition of 10% Conoco DRA, showed that the drag reducer could increase the capacity of the crude oil pipeline while reducing the cost to a certain extent .
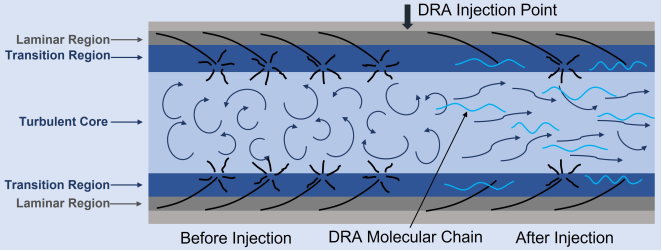
Figure 1. Schematic diagram of turbulent flow in pipeline before and after adding drag reducing agents .
In general, DRA can be mainly classified into three categories according to their composition, molecular mechanism, and action principle , which are high molecular-weight polymer-based DRA, surfactant-based DRA, and fiber-based DRA. Surfactant-based DRA and fiber-based DRA show better performance in shear resistance than high molecular weight polymer-based DRA, however, due to technical constraints and economic costs, high molecular-weight polymer-based DRA is more commonly used in crude oil pipeline transportation . In the research process of DRA, many researchers have explored the drag-reducing mechanism of DRA, however, due to the complexity of the action process of DRA, which involves several fields such as fluid dynamics, polymer chemistry, and rheology, it is difficult to observe the specific behavior of the DRA in fluid due to the limitation of the testing conditions, the drag reducing mechanism has been controversial, and several hypotheses have mainly appeared , such as viscoelasticity hypothesis, pseudoplastic hypothesis, effective slip hypothesis, and turbulent pulsation suppression hypothesis, etc. The turbulence pulsation suppression hypothesis is widely accepted. In turbulent oil, DRA molecules can adsorb onto the surfaces of turbulent eddies, significantly altering and regulating their structural characteristics, motion behaviors, and interaction patterns. By minimizing violent collisions, friction, and energy exchange processes between eddies and between eddies and pipe walls, a significant reduction in fluid friction resistance can be achieved at the macroscopic level, ultimately improving pipeline transportation efficiency .
In-depth research on the influencing factors on the performance of DRA for oil pipeline transportation and the prediction of drag reduction rate is of great theoretical value and practical application significance for accurately grasping the effect of DRA under different working conditions, optimizing the use strategy of drag reducing agents, and promoting the overall progress of crude oil pipeline transportation technology. Numerous researchers have studied the parameters affecting the effectiveness of DRA in crude oil pipeline transportation, and the main influential parameters are DRA concentration , flow rate , pipeline diameter , temperature , and DRA specifications. However, the experiments in the laboratory are limited by the size of the device and other conditions cannot reach the working conditions of pipeline transportation in practical applications, and there is still a need to strengthen the prediction and validation of the effect of DRA in practical applications. Based on this problem, this study designed and constructed a set of specialized indoor loop experimental device, implemented systematic experiments for diesel oil, analyzed the influencing factors of the performance of the DRA in pipeline transportation, and then constructed a drag reduction rate prediction fitting formula with a high degree of accuracy and wide applicability by using the data obtained from the experiments, intending to provide technical support and reference for the practical application of the DRA in the pipeline transportation of crude oil.
2. Experimental Section
2.1. Experimental Principle
The drag reduction rate (DR%), as a core indicator for measuring the performance of DRA, is calculated based on the basic principles and relevant formulas in fluid mechanics . In a steady pipeline flow, according to the Darcy-Weisbach equation, when no DRA is added, there exists the following relationship between the pressure drop in the pipeline ΔP0 and the friction coefficient of the oil λ0, the length of the pipeline L, the flow rate of the oil v0, the inner diameter of the pipeline D, and the density of the oil ρ:
ΔP0=λ0LDρv022(1)
Where the friction coefficient λ0 is a parameter related to the fluid flow state, pipe roughness, etc. For turbulent flow, it can be calculated according to Colebrook-White formula:
1λ0=-2lgε3.7D+2.51Re0λ0(2)
Where ε is the absolute roughness of the inner wall of the pipe, Re0 is the Reynolds number of the oil when no DRA is added, and its calculation formula is:
Re0=ρv0Dμ0(3)
Where μ0 is the dynamic viscosity of the oil when no DRA is added. After adding DRA to the oil, the pressure drop of the pipeline becomes:
ΔPDR=λDRLDρv22(4)
Where λDR is the friction coefficient after adding DRA and v is the flow rate of the oil. Similarly, the Reynolds number of the oil Re after adding DRA is:
Re=ρvDμ(5)
Since the length of the pipe L, the density of the oil ρ, and the inner diameter of the pipe D remain constant during the experiment, and the flow rates of the oil before and after the addition of the DRA are approximately equal under the same conditions (i.e., v0v), the formula for the calculation of the drag reduction rate can be simplified as follows:
DR%=ΔP0-ΔPDRΔP0=1-λDRλ0(6)
By measuring the flow rate and the pressure drop ΔP0 and ΔPDR in the pipeline before and after the addition of the DRA, and combining with a series of equations mentioned above, important parameters such as the drag reduction rate, Reynolds number, and coefficient of friction can be calculated, to comprehensively evaluate the influence of the DRA on the flow characteristics of oil, and to thoroughly study the performance and mechanism of the DRA. In the experimental process, it is necessary to strictly control the experimental conditions, such as the temperature, pressure, flow rate of the oil and the added concentration of the DRA, etc., to ensure the accuracy and comparability of the experimental data, and to lay the foundation for the subsequent analysis of the data and the establishment of the fitting formula for the prediction of the drag reduction rate.
2.2. Experimental Apparatus
The indoor loop experimental device used in this study is shown in Figure 2. The main components of the experimental system are gas supply and pressurization module, pipeline test module, valve control module, heating and insulation module, sensor test module, liquid return and circulation module, acquisition and control module and safety protection module.
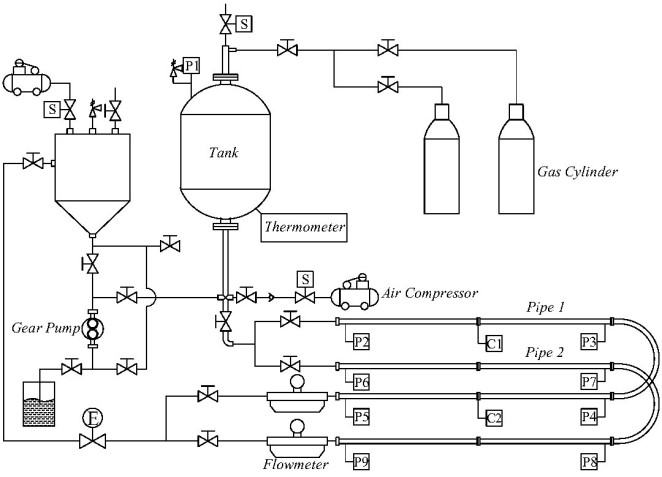
Figure 2. Schematic diagram of experimental apparatus.
The gas supply and pressurization module is mainly composed of gas cylinders, high-flow pressure reducers, and related pipelines, which is used to provide a stable pressure gas supply to the tank, so that the test fluid flows into the test pipeline at a stable speed, with a maximum gas supply rate of 100 L/min and a maximum gas supply pressure of 1.6 MPa. The pipeline test module is mainly composed of the main flow pipeline and supporting pipelines, there are two test pipelines, Pipe 1 inner diameter of 12.7 mm, and Pipe 2 inner diameter of 25 mm, the length of the straight section of the two pipelines is 12 m, the pipeline rotary section of the rotary radius of 0.5 m. The valve control module mainly consists of various high-precision pressure-resistant manual valves and electric valves. The electric valves are controlled by computer application programs, which can realize the control of valves safely and efficiently. The heating and insulation module is mainly composed of heating and related temperature acquisition and control devices, as well as insulation materials. Heating and insulation measures are added to the entire storage tank and pipeline to control the temperature stability of the test fluid during the experimental process. The sensor test module mainly includes differential pressure sensor, pressure sensor, temperature sensor, and mass flow meter, differential pressure and pressure test point are set in the pipeline flow stability section, differential pressure sensor range is 100 kPa; the range of the pressure sensor is 2 MPa, and the accuracy is 0.1%, the pipeline pressure sensor is set at both ends of the straight section of the pipeline and at the midpoint, and the pressure sensor is also set on the storage tank for monitoring the test pressure; the temperature sensor is PT100, mainly used to measure the temperature of the test medium in the tank and pipeline, which can be directly displayed or transmitted to the computer application program for acquisition and control; the mass flow meter was used to test the flow rate during the experiment with a range of 6000 kg/h and an accuracy of 0.1%. The liquid return and circulation module mainly consists of return tank, return pump, and related pipelines and brackets, return tank is made of metal, used to receive the test fluid in the pipeline and circulate the test fluid, the return pump is a gear pump that can be remotely controlled and adjusted, with a discharge capacity of 2 m3/h, inlet and outlet diameters of 25 mm, and a maximum pressure of 1 MPa, the return pump can be used to realize the reciprocation of the test fluid between the tank and the return tank. The acquisition and control module mainly consists of related acquisition systems, control systems, and electrical appliances. The differential pressure, pressure, flow rate, temperature, and other signals of the entire experimental device are collected through the acquisition module and transmitted to the computer through signals. These data are stored and analyzed through application programs, and relevant controls are carried out. The safety protection module is mainly composed of gas alarms, safety valves, and other related alarm devices. Since the test fluid has a certain volatility, the experimental space, especially the test fluid circulation area, needs to be equipped with gas alarms to ensure the safety of the experiment, and the pressurized storage tank has a large volume, so the safety valve has been added additionally.
2.3. Experimental Procedure
To investigate the effects of DRA concentration, Reynolds number, and other parameters on the drag reduction rate, experiments with eight Reynolds numbers and six DRA concentrations were carried out using diesel fuel as the test fluid in Pipe 1, and experiments with six Reynolds numbers were carried out in Pipe 2, respectively. While investigating the effects of these parameters on the drag reduction rate, the experimental data were combined with field data from actual crude oil pipeline transportation and used to construct a fitting formula for the drag reduction rate prediction.
When conducting experiments, diesel oil is used as the test fluid, which flows through the pipeline at a preset temperature and flow rate, and the pressure drop inside the pipeline is measured. Then, DRA is added to the fluid at the required concentration, and the experiment is conducted and the pressure drop is measured at the same temperature and flow rate. The Reynolds number and drag reduction rate are calculated using the formula described earlier. To ensure the reliability of the collected data during the experiment, it is required that the time of collecting data when the flow state in the pipeline is stable is not less than 30 seconds. For the same experimental condition, two parallel experimental data are taken, and the error between the two measured data and the average value is not more than 5%, which is regarded as a valid experimental result.
3. Experimental Results and Discussion
3.1. Effect of DRA Concentration on Drag Reduction Rate
In this study, experiments were carried out with diesel oil as the test fluid with DRA concentrations ranging from 10 to 60 ppm. Pipe 1 with a diameter of 12.7 mm was selected. According to the density and viscosity of diesel fuel, and considering the flow state, the Reynolds number was set to 20000, and the experimental temperature was set to 50°C. The density of the selected diesel fuel at the corresponding temperature was 809.2 kg/m3 and the viscosity was 1.81 mPa·s. Table 1 lists some of the experimental data.
Table 1. Experimental data of Pipe 1 at 20000 Reynolds numbers and 50°C.

Q (L/min)

c (ppm)

ΔP0 (kPa)

ΔPDR (kPa)

DR%

26.451

10

132.460

91.456

30.96

26.465

10

132.565

90.160

31.99

26.585

20

133.469

64.714

51.52

26.351

20

131.706

62.956

52.20

26.725

30

134.524

54.828

59.25

26.996

30

136.566

52.812

61.33

26.889

40

135.760

44.548

67.19

27.109

40

137.418

43.618

68.26

26.559

50

133.274

40.479

69.62

26.647

50

133.937

40.113

70.04

26.281

60

131.179

41.150

68.64

26.506

60

132.874

41.500

68.78

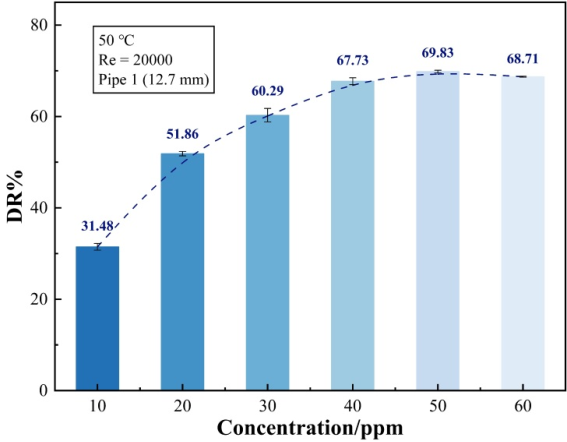
Figure 3. Variation of DR% with DRA concentration (50°C, Re=20000, Pipe 1).
As shown in Figure 3, the concentration of the DRA can directly affect the drag reduction rate and the drag reduction rate increases with the increase of the concentration of the added DRA. At low concentrations (10 ppm), the drag reduction rate is only at a relatively low level, about 30%, and the drag reduction rate varies greatly with concentration in the low concentration range, in which the DRA molecules can be dispersed more uniformly in the diesel fuel, forming an effective interaction with the diesel fuel molecules. From a microscopic point of view, the DRA molecules interact with the diesel molecules through adsorption and entanglement by their specific chemical structure, thus effectively interfering with the formation and development of the turbulent boundary layer. In the turbulent boundary layer, the generation and evolution of small-scale vortices, which are originally disordered and violently moving, are suppressed under the action of DRA molecules, resulting in a significant reduction of frictional drag within the fluid. In the high concentration range, the rate of change of drag reduction rate with concentration decreases, and even the drag reduction rate will no longer increase with the increase of concentration. This is because DRA has a certain solubility in fluids, and beyond this solubility, DRA molecules cannot be uniformly dispersed in the fluid, and the effect will not continue to improve. Moreover, adding too much DRA will change the viscosity of the fluid, which will have the opposite effect on the increase of drag reduction rate. There is a critical concentration of DRA in the fluid, and drag reduction is at its highest level when this critical concentration is reached.
3.2. Effect of Reynolds Number on Drag Reduction Rate
As mentioned earlier, the principle of drag reduction is the suppression of turbulent pulsations, so the intensity of the turbulence effect will influence the drag reduction rate. In pipeline flow, the flow state of a fluid is usually judged by the dimensionless quantity Reynolds number. In this study, the Reynolds number is used as a measure of the flow state, and diesel fuel is used as the test fluid to investigate the effect of the Reynolds number on the drag reduction rate by setting the flow rate at different Reynolds numbers with the same temperature and concentration of DRA. Pipe 1 with a diameter of 12.7 mm and Pipe 2 with a diameter of 25 mm were used for the experiments, the concentration of DRA was added at 30 ppm, the temperature was set to 60°C, and the density of the selected diesel fuel at the corresponding temperature was 785.4 kg/m3 and the viscosity was 1.56 mPa·s. Table 2 and Table 3 list some of the experimental data.
Table 2. Experimental data of Pipe 1 at 30 ppm and 60°C.

Q (L/min)

Re

ΔP0 (kPa)

ΔPDR (kPa)

DR%

4.829

3985

5.932

5.063

16.27

5.006

4034

6.000

4.965

17.25

9.544

7994

20.001

12.413

38.08

9.757

8054

20.639

13.059

36.77

13.879

11939

39.152

21.861

44.19

13.922

12122

39.380

22.134

43.80

24.695

20866

106.681

51.333

51.88

25.262

20951

107.204

51.000

52.42

29.978

24521

146.820

73.447

49.97

30.054

24635

147.102

68.638

53.34

34.953

30278

204.593

93.270

54.42

35.438

30669

206.739

94.666

54.22

41.254

34570

263.455

124.846

52.63

41.371

34684

265.003

127.656

51.84

45.985

39294

329.629

157.842

52.12

46.152

39374

329.521

161.500

51.00

Table 3. Experimental data of Pipe 2 at 30 ppm and 60°C.

Q (L/min)

Re

ΔP0 (kPa)

ΔPDR (kPa)

DR%

18.535

7921

2.403

2.108

13.63

18.701

7992

2.403

2.076

15.05

27.437

11725

4.703

3.918

16.88

28.394

12134

4.996

3.968

20.74

46.602

19916

11.314

8.798

22.31

46.827

20012

10.571

8.193

22.55

59.637

25468

16.483

11.820

28.36

59.814

25561

16.483

11.815

28.40

69.321

29624

21.475

16.290

24.19

69.996

29913

21.475

16.036

25.37

82.250

35150

29.234

22.302

23.74

84.180

35974

29.234

22.114

24.39

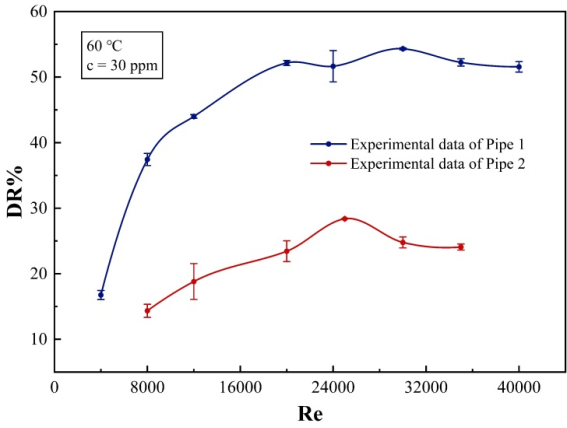
Figure 4. Variation of DR% with Reynolds number in different pipelines (60°C, c=30 ppm).
According to the common sense of fluid mechanics, the turbulence intensity of fluid flow increases with the increase of Reynolds number, so the drag reduction rate is also expected to increase with the increase of Reynolds number. In this study, experimental data were obtained for Reynolds numbers ranging from 4000 to 40000, and the experimental results are in general agreement with the speculation, as shown in Figure 4, the drag reduction rate increases with increasing Reynolds number. However, it is worth noting that for the experimental data of Pipe 1, in the stage of Reynolds number increasing from 4000 to 12000, the drag reduction rate increases rapidly, in this stage the turbulence intensity is gradually enhanced, and the flow state of the fluid is constantly developing from transitional turbulence to stable turbulence, and the molecules of the DRA can better play their role in inhibiting turbulent eddies in this gradually enhanced turbulence environment. Due to the DRA molecules having certain long chain structures or special functional groups, they can be adsorbed on the surface of the turbulent vortex, change the rotational characteristics and trajectory of the vortex, so that the interaction between the vortex as well as between the vortex and the wall of the pipe is weakened, which reduces the frictional resistance of the fluid, resulting in the drag reduction rate is increasing. When the Reynolds number exceeds 20000, the growth rate of the drag reduction rate begins to slow down, and when the Reynolds number reaches 30,000 or more, the drag reduction rate even shows a small decrease, this is due to the range of high Reynolds number, turbulence structure has become extremely complex, a variety of scales of eddies interweave, collide, and fuse with each other. DRA molecules are difficult to maintain optimal performance in such a complex and changeable flow environment. Some of the DRA molecules may be wrapped by the strong turbulent vortex and cannot be effectively adsorbed on the surface of the vortex to play an inhibitory role, or due to the violent stretching and twisting of the vortex, the distribution of the DRA molecules in the flow field becomes non-uniform, resulting in a weakening of the drag reducing effect in the localized area, which leads to fluctuations or even a decrease in the drag reducing rate. Comparing the experimental data of two different pipe diameters, it can be found that the drag reduction rate in the 12.7 mm pipe is higher than that in the 25 mm pipe. On the one hand, the reason for this phenomenon is still related to turbulence, the absolute roughness ε is the same in the two pipes, and the smaller pipe diameter will have a larger relative roughness ε/D, which will trigger higher intensity turbulence, and the corresponding effect of the drag reducing agent will be better, and the drag reduction rate will be higher . On the other hand, it is also worth considering the length-to-diameter ratio l/D of the pipe. For the device used in this study, a smaller pipe diameter will have a larger length-to-diameter ratio l/D, which means that the molecules of the drag reducing agent can have enough time to diffuse and stretch more fully in the flow, which in turn has a better drag reducing effect, while in the pipeline with a larger diameter, due to the high flow rate, the molecules of the drag reducing agent cannot play a full role in the flow, and the experimental data of the drag reducing rate cannot reflect a better pattern.
4. Derivation and Validation of Prediction Fitting Formula
4.1. Derivation of the Fitting Formula
A few researchers have studied the prediction fitting formulas for the drag reduction rate, but these formulas are deficient in accuracy and applicability. Vejahati et al proposed a one-factor model, however, this model only considered the concentration of the added DRA without considering other major influencing factors, and could not accurately predict the drag reduction rate in practical applications, but the negative exponential equation DR%=K1[1-exp-kc] (c is the DRA concentration) was more accurate in fitting the predicted drag reduction rate in relation to the concentration of the DRA. It can be cited in the prediction model construction. It is known that the drag reduction rate can be expressed as the ratio of the reduction of the friction coefficient after the addition of the DRA to the friction coefficient when the DRA is not added, i.e., DR%=1-λDRλ0×100%, and by calculating the friction coefficients before and after the addition of the agent the rate of drag reduction can be found. The friction coefficient before addition can be calculated using the Colebrook-White formula, while in this study, the friction coefficient after addition is calculated using turbulent stress. After obtaining the relationship between turbulent stress and friction coefficient, a drag reduction prediction model is established by combining the negative exponential equation.
When the flow in the pipe is in the form of turbulence, the resistance of the fluid consists of two parts, one is the laminar shear stress τ1, which is related to the time-averaged state of motion of the fluid, and the other is the turbulence stress τ2, which is independent of the time-averaged state of motion but is related to pulsations and eddies. After adding the DRA to the pipeline flow, the DRA molecules will inhibit the pulsation and eddy in the turbulence, which can reduce the turbulence stress τ2, thereby reducing the effect of turbulence stress on the friction coefficient in the flow, and overall reducing the friction coefficient. The resistance expression has τ=τ1+τ2, assuming that the total friction coefficient λ=λ1+λ2, where λ1 denotes the proportion of laminar shear stress effect in the friction coefficient, and λ2 denotes the proportion of turbulent stress effect in the friction coefficient. The proportion of the turbulent stress in the total stress is roughly equivalent to the proportion of the turbulent stress effect on the friction coefficient in the total friction coefficient, i.e., λ2 λ=τ2τ. The negative exponential equation is DR%=K1[1-exp-kc], with k being the coefficient of influence of the DRA specification, and the equation reflects the variation of the drag reduction rate with the concentration. Since the DRA mainly reduces turbulent stress in pipeline flow, the drag reduction rate can be expressed as the percentage reduction of turbulent stress. The percentage reduction of turbulent stress should also satisfy the negative exponential equation τc=K1[1-exp-kc] with the concentration. Therefore, the reduction in friction coefficient after adding the DRA is λ2τ(c).
According to the Prandtl mixing length theory, in turbulent flow inside a pipeline, the fluid's micro clusters will only mix and interact with other micro clusters after moving a certain distance. During this distance, the flow characteristics of the fluid remain unchanged, and this distance is called the mixing length l. Prandtl provided an expression for the eddy viscosity coefficient vt based on the mixing length:
vt=ρl2dvdy(7)
Where ρ is the density, v is the average fluid flow rate, and y is the radial displacement. The eddy viscosity coefficient is related to the flow conditions. Turbulent stress can be calculated analogously to laminar shear stresses by means of eddy viscosity coefficients:
τ2=vtdvdy(8)
Combining Eq. (7) and Eq. (8) yields turbulent stress calculated via mixing length theory:
τ2=ρl2dvdy2(9)
The friction coefficient λDR after the addition of DRA is the difference between the friction coefficient λ0 before the addition and the reduction of friction coefficient λ2τ(c) after the addition, there is λDR=λ0-λ2τ(c), and λDR can be expressed as:
λDR=λ01-λ2τcλ0(10)
From Eq. (9), the proportion of turbulent stress in the resistance is:
τ2τ=τ2τ1+τ2=ρl2dvdy2μdvdy+ρl2dvdy2(11)
Where μ is the viscosity of the fluid. Introducing the Reynolds number Re=ρvDμ in Eq. (11) yields:
τ2τ=Rel2vDdvdy1+Rel2vDdvdy(12)
Let K=l2vDdvdy, which can express the relationship between turbulent stress and pipe flow conditions and pipe diameter. Equation (12) can be simplified as:
τ2τ=ReK1+ReK(13)
According to λ2 λ=τ2τ, the friction coefficient after the addition of DRA is obtained:
λDR=λ1-ReK1+ReKτc=λ1-ReKK11+ReK[1-exp-kc](14)
In the formula, K, K1 are dimensionless quantities related to the flow condition of the pipeline, so K is used instead of KK1, and the formula for the drag reduction rate after adding the DRA is obtained from DR%=1-λDRλ0:
DR%=ReK1+ReK1-exp-kc(15)
In the formula, k determines the effect of the concentration of the added DRA on the drag reduction rate, it can be considered that k is only related to the specifications of the DRA, for the same DRA, the value of k is unchanged when it is applied to different working conditions, and the value of k needs to be re-taken when using different DRA. K reflects the influence of flow conditions on drag reduction rate, which is related to flow rate, pipeline parameters, and oil properties. When the same DRA is used for different working conditions, the value of k remains unchanged, while the value of K will change with the change of working conditions. To make the prediction model universal, when the same DRA is applied to different working conditions, the value of K is still considered unchanged, and the pipe diameter, temperature, and oil viscosity are corrected:
DR%=DD0xTT0yνν0zReK1+ReK1-exp-kc(16)
Where D0, T0, and ν0 are the pipe diameter, temperature, and oil viscosity under the reference operating conditions, while D, T, and ν respectively represent the pipe diameter, temperature, and oil viscosity under the condition to be predicted. The correction coefficients x, y, and z are calculated based on specific conditions.
4.2. Determination of the Coefficients of the Fitting Formula
In this study, the experimental data obtained in Pipe 1 was used as a baseline (pipe diameter of 12.7 mm, temperature of 60°C, diesel viscosity of 1.56 mPa·s) and the formula was fitted using the least squares method. The core idea of the algorithm is to determine the value of the fitting coefficient by minimizing the objective function, which is defined as the sum of the squares of the errors between the experimentally measured drag reduction rate and the one calculated by the prediction formula. Assuming that there are n experimental data points, the experimental value of drag reduction rate of the ith data point is DRi, and the predicted value of drag reduction rate is DRipre according to the formula, then the objective function S can be expressed as follows: S=i=1n(DRi-DRipre)2, and substituting the prediction formula, it can be obtained as S=i=1n(DRi-ReiK1+ReiK1-exp-kci)2, solving for the values of K and k that minimize S is the best-fit coefficient. Iterative calculations were performed in this study using the lsqcurvefit function in MATLAB.
After calculation and iterative optimization, a set of more reasonable coefficient values are obtained: K = 0.000139, k = 0.036. The goodness of fit R2 of the formula over the range of experimental data reaches 0.91, which indicates that the formula can fit the experimental data with a high degree of accuracy. The comparison between the prediction formula curve and the experimental data is shown in Figure 5. The prediction formula curve fits well with the actual data, and the relationship between the drag reduction rate and the Reynolds number is also consistent with the previous discussion. The average relative error for the data points in Figure 5 does not exceed 6%, and the prediction results are acceptable.
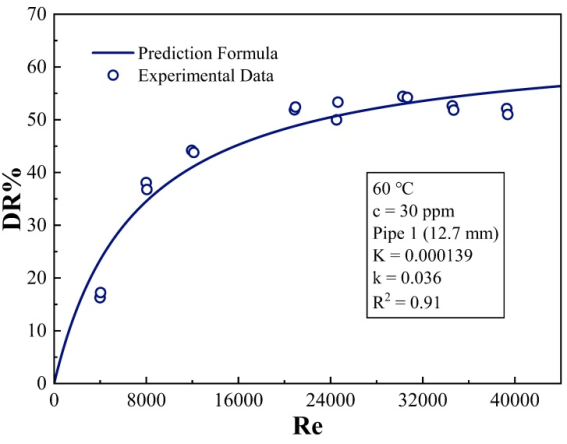
Figure 5. Comparison between prediction formula and experimental data (60°C, c=30 ppm, Pipe 1).
In this study, the experiments in the laboratory and the actual crude oil pipeline transportation in the field use the same kind of DRA, so the values of K, k are regarded as unchanged. The correction coefficients x, y, and z are determined below. After obtaining the correction coefficients, the drag reduction rate can be predicted by substituting the relevant parameters for the corresponding operating conditions.
As mentioned in Section 3.1, experiments were conducted using Pipe 1 with the Reynolds number set to 20,000 and the temperature set to 50°C. Experimental data on the variation of the drag reduction rate with the concentration of the DRA were obtained, and this data set is fitted and verified now. Compared with the baseline condition (12.7 mm, 60°C, 1.56 mPa·s), the pipe diameter is the same in this data set while the temperature and diesel viscosity are different, and the predictive fitting of the drag reduction rate needs to be corrected by the temperature coefficient y and the viscosity coefficient z. The prediction formula is then DR%=5060y1.811.56z0.000139Re1+0.000139Re1-exp(-0.036c), set A=5060y1.811.56z, and fit the formula by least squares. As shown in Figure 6, after calculation and iteration, the coefficient value A = 1.18 was obtained, and the goodness of fit R2 of the formula over the range of experimental data reaches 0.85.
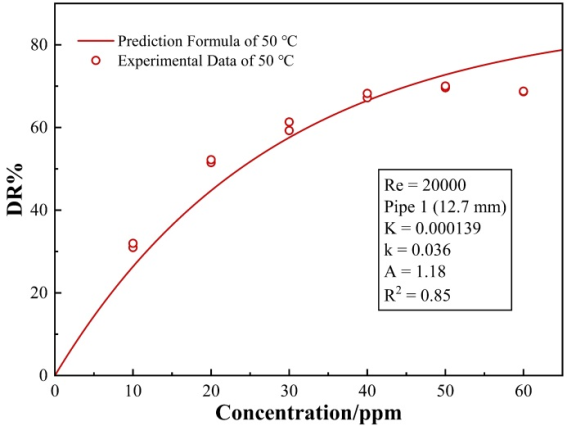
Figure 6. Comparison between prediction formula and experimental data (50°C, Re=20000, Pipe 1).
The following operational experimental data of two oil field crude oil transportation pipelines are selected to continue the determination of the coefficients and the validation of the fitting formula. One pipeline is the KL10-1CEP platform pipeline, the pipeline parameters and the crude oil parameters in the pipeline are given in Table 4 and Table 5, and the operational experimental data are given in Table 6, and the other pipeline is the BZ34-2/4CEPA platform pipeline, the pipeline parameters and the crude oil parameters in the pipeline are given in Table 7 and Table 8, and the operational experimental data are given in Table 9.
Table 4. Pipeline parameters of KL10-1CEP platform.

Daily throughput

Export pump pressure

Pipe diameter

Average velocity

Reynolds number

10000 m3/d

5745 kPa

244.5 mm

2.465 m/s

27907

Table 5. Crude oil parameters in the pipeline of KL10-1CEP platform.

Temperature

Viscosity

Density

80°C

19.48 mPa·s

902 kg/m3

Table 6. Some experimental data of KL10-1CEP platform.

Flowrate (m3/h)

Concentration (ppm)

Pipeline pressure (kPa)

427

0

5745

427

0

5683

427

0

5721

427

20

4653

427

20

4756

427

20

4604

427

30

3657

427

30

3875

427

30

3686

427

40

3345

427

40

3290

427

40

3229

Table 7. Pipeline parameters of BZ34-2/4CEPA platform.

Daily throughput

Average pressure drop

Pipe diameter

Roughness

Reynolds number

10173 m3/d

1075 kPa

355.6 mm

0.05 mm

13000

Table 8. Crude oil parameters in the pipeline of BZ34-2/4CEPA platform.

Temperature

Viscosity

Density

67.5°C

27.88 mPa·s

855 kg/m3

Table 9. Some experimental data of BZ34-2/4CEPA platform.

Concentration (ppm)

Inlet pressure (kPa)

Outlet pressure (kPa)

8

1010

157

8

1023

179

8

1057

165

16

839

194

16

871

188

16

894

164

25

748

165

25

745

166

25

686

164

30

703

166

30

608

167

30

680

167

35

675

168

35

627

165

35

672

166

40

677

167

40

570

166

40

629

167

Firstly, the coefficient determination is carried out with the operational experimental data of KL10-1CEP platform pipeline. Compared with the baseline condition (12.7 mm, 60°C, 1.56 mPa·s), the KL10-1CEP platform pipeline has a different pipe diameter, temperature and oil viscosity, which need to be corrected by the pipe diameter coefficient x, the temperature coefficient y and the viscosity coefficient z at the same time, then the prediction formula is DR%=244.512.7x8060y19.481.56z·0.000139Re1+0.000139Re1-exp(-0.036c), and set B=244.512.7x8060y19.481.56z. Then fit the formula using least squares. As shown in Figure 7, after calculation and iteration, the coefficient value B = 0.66 was obtained, and the goodness of fit R2 of the formula over the range of experimental data reaches 0.88.
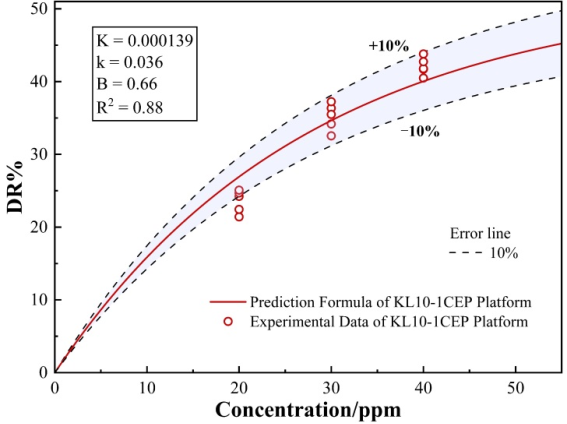
Figure 7. Comparison between prediction formula and experimental data (KL10-1CEP Platform).
Similarly, using the operational experimental data of BZ34-2/4CEPA platform pipeline for the determination of the coefficients, the prediction formula is DR%=355.612.7x·67.560y27.881.56z0.000139Re1+0.000139Re1-exp(-0.036c), set C=355.612.7x67.560y27.881.56z, and then fit the formula by least squares. As shown in Figure 8, after calculation and iteration, the coefficient value C = 1.21 was obtained. Compared with experiments conducted in the laboratory, the experimental data of the field pipelines have larger errors. This is because the data fluctuates greatly in the field experiments and the measurement accuracy is low, resulting in larger errors in the measured data. However, at the overall level, the errors between most experimental data and predicted data are within an acceptable range. After obtaining each coefficient A, B and C, each correction coefficient x = 3.25, y = -3.80 and z = -3.54 can be obtained. The correction coefficients obtained in this study may not be reasonable in terms of the values taken, but the fitting results are acceptable. This set of methods for proposing fitting formula and then determining the fitting coefficients based on experimental data, and then predicting the drag reduction rates for other operating conditions, is feasible. In subsequent research, further optimization of indoor experimental device can be considered to obtain accurate experimental data under more working conditions to obtain more reasonable fitting formulas and correction coefficients, while considering more influencing factors to further optimize formula coefficients.
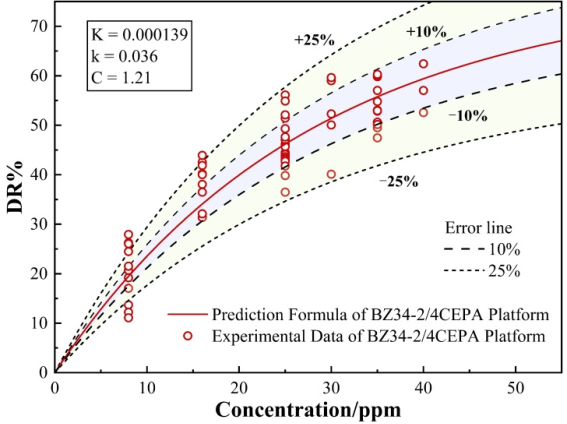
Figure 8. Comparison between prediction formula and experimental data (BZ34-2/4CEPA Platform).
5. Conclusions
In this study, a specialized indoor loop experimental device was constructed, and experiments were designed and conducted according to the influencing factors of the DRA, and abundant experimental data were obtained by regulating factors such as DRA concentration, Reynolds number, temperature, and pipe diameter. The following conclusions were drawn regarding the influencing factors of DRA: (1) In the low concentration range, the drag reduction rate increases rapidly with increasing concentration, while in the high concentration range, the growth rate of drag reduction rate slows down with increasing concentration, and there may be a critical concentration at which the drag reduction rate reaches its maximum; (2) The effect of Reynolds number on drag reduction varies in different ranges. At low Reynolds numbers, the drag reduction rate changes dramatically with Reynolds number, while at high Reynolds numbers, the speed of drag reduction rate changes slowly with Reynolds number, and even the drag reduction rate may decrease with increasing Reynolds number; (3) For pipes of the same length and absolute roughness, a smaller pipe diameter will have a higher rate of drag reduction. Based on these findings, a fitting formula for drag reduction rate prediction incorporating parameters of drag reducer concentration, Reynolds number, pipe diameter, temperature, and oil properties is proposed. The undetermined coefficients of the fitting formula were determined using the nonlinear least squares fitting method based on experimental data obtained through indoor loop experimental device and operational experimental data of oil field crude oil transportation pipelines. The relative error between predicted and experimental data in the fitting process is within acceptable limits. The innovation of this study is reflected in the unique experimental device and the prediction formula that synthesizes the interaction of multiple factors. The shortcomings of this study are: (1) Only one type of DRA is considered; (2) The design conditions of the indoor experiments can continue to be enriched, and the experimental device can continue to be optimized in order to obtain accurate experimental data for more conditions (pipe diameters, Reynolds numbers, etc.). Considering more types of DRA and obtaining experimental data for more operating conditions can help to obtain more accurate and widely applicable formula for prediction of drag reduction rate. This study provides a theoretical basis and technical support for the application of drag reducers in crude oil pipeline transportation, which is of great significance to pipeline transportation in the petroleum industry and is expected to be widely promoted. In the subsequent research, the formula coefficients can be further optimized to incorporate more complex factors to further improve the prediction accuracy and application range.
Abbreviations

DRA

Drag Reducing Agent

Author Contributions
Xiaoxin Zhang: Conceptualization, Data curation, Formal Analysis, Methodology, Writing – original draft
Xianwei Guo: Data curation, Formal Analysis, Visualization, Writing – original draft
Hao Xing: Validation, Investigation, Visualization
Lei Yang: Conceptualization, Supervision, Project administration
Shi Shen: Formal Analysis, Validation, Visualization
Huiyong Liang: Conceptualization, Resources, Supervision, Funding acquisition, Writing – review & editing
Xin Lv: Resources, Supervision, Funding acquisition, Project administration
Funding
This work is supported by the National Key Research and Development Program of China (Grant No. 2021YFC2800902), the National Natural Science Foundation of China (Grant Nos. 52176002, 52227812), the Dalian High-Level Talent Innovation Program (Grant No. 2022RY06).
Data Availability Statement
The data supporting the outcome of this research work has been reported in this manuscript.
Conflicts of Interest
The authors declare no conflicts of interest.
References
[1] Mutezo, G., Mulpo, J. A review of Africa's transition from fossil fuels to renewable energy using circular economy principles. Renewable and Sustainable Energy Reviews. 2021, 137, 110609.
[2] Li, Z., Liang, Y., Liao, Q., et al. A review of multiproduct pipeline scheduling: from bibliometric analysis to research framework and future research directions. Journal of Pipeline Science and Engineering. 2021, 1(4), 395-406.
[3] Wang, G., Cheng, Q., Zhao, W., et al. Review on the transport capacity management of oil and gas pipeline network: Challenges and opportunities of future pipeline transport. Energy Strategy Reviews. 2022, 43, 100933.
[4] Bazyar, A., Zarrinpoor, N., Safavian, A. Optimal design of a sustainable natural gas supply chain network under uncertainty. Chemical Engineering Research and Design. 2021, 176, 60-88.
[5] Souas, F., Meddour, A S E. Drag reduction in single-phase crude oil flow: A mini-review. Journal of Pipeline Science and Engineering. 2022, 2(4), 100088.
[6] Gu, Y., Yu, S., Mou, J., et al. Research progress on the collaborative drag reduction effect of polymers and surfactants. Materials. 2020, 13(2), 444.
[7] Jalal, M A., Khalaf, M N., Al-Abdulsayyed, M A. Effect of the Polymer Structure Diversity on the Eddies Suppression of Basrah Light Crude Oil Turbulent Flow. Egyptian Journal of Chemistry. 2021, 64(7), 3365-3378.
[8] Zabihi, R., Mowla, D., Karami, H R. Artificial intelligence approach to predict drag reduction in crude oil pipelines. Journal of Petroleum Science and Engineering. 2019, 178, 586-593.
[9] Karami, H R., Rahimi, M., Ovaysi, S. Degradation of drag reducing polymers in aqueous solutions. Korean Journal of Chemical Engineering. 2018, 35, 34-43.
[10] Al-Wahaibi, T., Abubakar, A., Al-Hashmi, A., et al. Energy analysis of oil-water flow with drag-reducing polymer in different pipe inclinations and diameters. Journal of Petroleum Science and Engineering. 2017, 149, 315-321.
[11] Mansour, A R., Swaiti, O., Aldoss, T., et al. Drag reduction in turbulent crude oil pipelines using a new chemical solvent. International Journal of Heat and Fluid Flow. 1988, 9(3), 316-320.
[12] Dujmovich, T., Gallegos, A. Drag reducers improve throughput, cut costs. Offshore (Conroe, Tex.). 2005, 65(12), 55-58.
[13] Amarouchene, Y., Kellay, H. Polymers in 2D turbulence: suppression of large scale fluctuations. Physical Review Letters. 2002, 89(10), 104502.
[14] Toms, B. Some Observations on the Flow of Linear Polymer Solutions Through Straight Tubes at Large Reynolds Number. In Proc. 1st Intl Congr. Rheol. 1948; Vol. 2, pp. 135-141.
[15] Virk. P S. Drag reduction fundamentals. AIChE Journal. 1975, 21(4), 625-656.
[16] Burger, E D., Munk, W R., Wahl, H A. Flow increase in the Trans Alaska Pipeline through use of a polymeric drag-reducing additive. Journal of petroleum Technology. 1982, 34(02), 377-386.
[17] Mohareb, R M., Badawi, A M., Noor, EL-DIN M R., et al. Synthesis and Characterization of Cationic Surfactants Based on N-Hexamethylenetetramine as Active Microfouling Agents. Journal of Surfactants and Detergents. 2015, 18(3), 529-535.
[18] Tamano, S., Kitao, T., Morinishi, Y. Turbulent drag reduction of boundary layer flow with non-ionic surfactant injection. Journal of Fluid Mechanics. 2014, 749, 367-403.
[19] Rubinstein, M., Semenov, A N. Dynamics of Entangled Solutions of Associating Polymers. Macromolecules. 2001, 34(4), 1058-1068.
[20] Downey, J S., Frank, R S., Li W-H., et al. Growth Mechanism of Poly(divinylbenzene) Microspheres in Precipitation Polymerization. Macromolecules. 1999, 32(9), 2838-2844.
[21] Gyr, A., Bewersdorff H-W. Drag reduction of turbulent flows by additives. Springer Science & Business Media; 2013.
[22] Asidin, M., Suali, E., Jusnukin, T., et al. Review on the applications and developments of drag reducing polymer in turbulent pipe flow. Chinese Journal of Chemical Engineering. 2019, 27(8), 1921-1932.
[23] Han, W J., Dong, Y Z., Choi, H J. Applications of water-soluble polymers in turbulent drag reduction. Processes. 2017, 5(2), 24.
[24] Hazlina, H., Azizi, A., Husna, A. An overview of viscosity reducers in heavy crude oil production. CHEMECA, Perth, Western Australia paper. 2014, (838).
[25] Jubran, B., Zurigat, Y., Goosen, M. Drag reducing agents in multiphase flow pipelines: Recent trends and future needs. Petroleum science and technology. 2005, 23(11-12), 1403-1424.
[26] Inaba, H., Aly, W I., Haruki, N., et al. Flow and heat transfer characteristics of drag reducing surfactant solution in a helically coiled pipe. Heat and mass transfer. 2005, 41, 940-52.
[27] Graham, M D. Drag reduction in turbulent flow of polymer solutions. Rheology reviews. 2004, 2(2), 143-170.
[28] Min, T., Yoo, J Y., Choi, H., et al. Drag reduction by polymer additives in a turbulent channel flow. Journal of Fluid Mechanics, 2003, 486, 213-238.
[29] Ayegba, P O., Edomwonyi-Otu, L C., Yusuf, N., et al. A review of drag reduction by additives in curved pipes for single-phase liquid and two-phase flows. Engineering Reports. 2021, 3(3), e12294.
[30] Ayegba, P., Edomwonyi-Otu, L., Yusuf, N., et al. Drag reduction by additives in curved pipes for single phase liquid and two phase flows: A review. Authorea Preprints. 2020.
[31] Abubakar, A., Al-Wahaibi, T., Al-Wahibi, Y., et al. Roles of drag reducing polymers in single- and multi-phase flows. Chemical Engineering Research and Design. 2014, 92(11), 2153-2181.
[32] Karami, H., Mowla, D. Investigation of the effects of various parameters on pressure drop reduction in crude oil pipelines by drag reducing agents. Journal of Non-Newtonian Fluid Mechanics. 2012, 177, 37-45.
[33] Mowla, D., Naderi, A. Experimental study of drag reduction by a polymeric additive in slug two-phase flow of crude oil and air in horizontal pipes. Chemical Engineering Science. 2006, 61(5), 1549-1954.
[34] Mowla, D., Haramipour, M., Moshfeghian, M. The effect of dilute polymer solutions on drag reduction in horizontal two phase flow. International Journal for Engineering Analysis and Design. 1995, 2, 97-105.
[35] Mowla, D., Hatamipour, M., Moshfeghian, M. A simple model for prediction of pressure drop horizontal two-phase flow. Iranian Journal of Science and Technology. 1991, 15, 177-185.
[36] Abubakar, A., Al-Wahaibi, Y., Al-Wahaibi, T., et al. Effect of pipe diameter on horizontal oil-water flow before and after addition of drag-reducing polymer part I: Flow patterns and pressure gradients. Journal of Petroleum Science and Engineering. 2017, 153, 12-22.
[37] Al-Sarkhi, A., Hanratty, T. Effect of pipe diameter on the performance of drag-reducing polymers in annular gas-liquid flows. Chemical Engineering Research and Design. 2001, 79(4), 402-408.
[38] Mansour, A., Aswad, Z. A method to minimize costs or maximize flow rate of pumping crude oil inside pipelines using a new drag reducing additive. J Pipelines. 1989, 7(3), 301-305.
[39] Hamouda, A A., Moshood, O T. Effect of temperature on degradation of polymer drag reduction and heat transfer in non-Newtonian fluid. In proceedings of the SPE International Conference on Oilfield Chemistry, Texas, USA, 2007; SPE-106081-MS.
[40] Qing, M., Qi, J., Zhi, C., et al. Enhancement for drag reducer release efficiency from inverse polymer emulsion using pH-responsive dynamic covalent surfactant. Colloids and Surfaces A: Physicochemical and Engineering Aspects. 2024, 681, 132830.
[41] Chen, W., Zhang, D., Wang, H., et al. A comparative evaluation of mechanically reinforced and heat-resistant organic powder/polyurethane elastomer hybrid composites. Iranian Polymer Journal. 2024, 33(1), 105-117.
[42] Cheng, Z., Zhang, X., Song, X., et al. Investigation of drag reduction by slurry-like drag-reducing agent in microtube flow using response surface methodology (RSM). Scientific Reports. 2023, 13(1), 22433.
[43] Baghele, P., Pachghare, P. Review on methods of drag reduction for two-phase horizontal flows. In proceedings of the AIP Conference Proceedings, Bangalore, India, 2021.
[44] Vejahati, F. A conceptual framework for predicting the effectiveness of a drag reducing agent in liquid pipelines. In proceedings of the PSIG Annual Meeting, Baltimore, Maryland, USA, 2014; PSIG-1418.
Cite This Article
  • APA Style

    Zhang, X., Guo, X., Xing, H., Yang, L., Shen, S., et al. (2025). Research on Influencing Factors and Prediction of Drag Reducing Agent Effectiveness in Oil Pipeline Transportation. International Journal of Economy, Energy and Environment, 10(2), 17-30. https://doi.org/10.11648/j.ijeee.20251002.11

    Copy | Download

    ACS Style

    Zhang, X.; Guo, X.; Xing, H.; Yang, L.; Shen, S., et al. Research on Influencing Factors and Prediction of Drag Reducing Agent Effectiveness in Oil Pipeline Transportation. Int. J. Econ. Energy Environ. 2025, 10(2), 17-30. doi: 10.11648/j.ijeee.20251002.11

    Copy | Download

    AMA Style

    Zhang X, Guo X, Xing H, Yang L, Shen S, et al. Research on Influencing Factors and Prediction of Drag Reducing Agent Effectiveness in Oil Pipeline Transportation. Int J Econ Energy Environ. 2025;10(2):17-30. doi: 10.11648/j.ijeee.20251002.11

    Copy | Download

  • @article{10.11648/j.ijeee.20251002.11,
      author = {Xiaoxin Zhang and Xianwei Guo and Hao Xing and Lei Yang and Shi Shen and Huiyong Liang and Xin Lv},
      title = {Research on Influencing Factors and Prediction of Drag Reducing Agent Effectiveness in Oil Pipeline Transportation
    },
      journal = {International Journal of Economy, Energy and Environment},
      volume = {10},
      number = {2},
      pages = {17-30},
      doi = {10.11648/j.ijeee.20251002.11},
      url = {https://doi.org/10.11648/j.ijeee.20251002.11},
      eprint = {https://article.sciencepublishinggroup.com/pdf/10.11648.j.ijeee.20251002.11},
      abstract = {This study is a comprehensive and in-depth investigation of the performance of drag-reducing agents (DRA) for pipeline oil products. Systematic experiments were conducted using a specially constructed indoor loop experimental device, using drag reduction rate as a metric. During the experimental process, variables such as DRA concentration and Reynolds number were precisely regulated to analyze the mechanism and influence law of these factors on the drag reduction rate. Based on a large amount of experimental data, a drag reduction rate prediction fitting formula is proposed that integrally considers relevant parameters such as drag-reducing agent concentration, Reynolds number, temperature, pipe diameter, and oil properties. The structure of the formula is designed to incorporate the mechanism and influencing factors of the DRA, and specific coefficients are introduced to express the relationship between the drag reduction rate and various aspects. Subsequently, the formula is fitted and validated using indoor experimental data and field data from actual crude oil pipeline transportation. The results show that the proposed fitting formula has high accuracy and reliability under different operating conditions. This formula and the accompanying validation method are expected to be effective tools for predicting drag reduction rates. This study provides a solid theoretical basis and strong technical support for the optimization of the additive amount of DRA in the crude oil pipeline transportation process and the precise regulation of transportation parameters, which is expected to be widely used and deeply promoted in the pipeline transportation link in the field of petroleum industry, and provides a reference example for the subsequent related research and technical improvement.
    },
     year = {2025}
    }
    

    Copy | Download

  • TY  - JOUR
    T1  - Research on Influencing Factors and Prediction of Drag Reducing Agent Effectiveness in Oil Pipeline Transportation
    
    AU  - Xiaoxin Zhang
    AU  - Xianwei Guo
    AU  - Hao Xing
    AU  - Lei Yang
    AU  - Shi Shen
    AU  - Huiyong Liang
    AU  - Xin Lv
    Y1  - 2025/03/21
    PY  - 2025
    N1  - https://doi.org/10.11648/j.ijeee.20251002.11
    DO  - 10.11648/j.ijeee.20251002.11
    T2  - International Journal of Economy, Energy and Environment
    JF  - International Journal of Economy, Energy and Environment
    JO  - International Journal of Economy, Energy and Environment
    SP  - 17
    EP  - 30
    PB  - Science Publishing Group
    SN  - 2575-5021
    UR  - https://doi.org/10.11648/j.ijeee.20251002.11
    AB  - This study is a comprehensive and in-depth investigation of the performance of drag-reducing agents (DRA) for pipeline oil products. Systematic experiments were conducted using a specially constructed indoor loop experimental device, using drag reduction rate as a metric. During the experimental process, variables such as DRA concentration and Reynolds number were precisely regulated to analyze the mechanism and influence law of these factors on the drag reduction rate. Based on a large amount of experimental data, a drag reduction rate prediction fitting formula is proposed that integrally considers relevant parameters such as drag-reducing agent concentration, Reynolds number, temperature, pipe diameter, and oil properties. The structure of the formula is designed to incorporate the mechanism and influencing factors of the DRA, and specific coefficients are introduced to express the relationship between the drag reduction rate and various aspects. Subsequently, the formula is fitted and validated using indoor experimental data and field data from actual crude oil pipeline transportation. The results show that the proposed fitting formula has high accuracy and reliability under different operating conditions. This formula and the accompanying validation method are expected to be effective tools for predicting drag reduction rates. This study provides a solid theoretical basis and strong technical support for the optimization of the additive amount of DRA in the crude oil pipeline transportation process and the precise regulation of transportation parameters, which is expected to be widely used and deeply promoted in the pipeline transportation link in the field of petroleum industry, and provides a reference example for the subsequent related research and technical improvement.
    
    VL  - 10
    IS  - 2
    ER  - 

    Copy | Download

Author Information
  • Key Laboratory of Ocean Energy Utilization and Energy Conservation of Ministry of Education, Dalian University of Technology, Dalian, China

  • Key Laboratory of Ocean Energy Utilization and Energy Conservation of Ministry of Education, Dalian University of Technology, Dalian, China

  • Key Laboratory of Ocean Energy Utilization and Energy Conservation of Ministry of Education, Dalian University of Technology, Dalian, China

  • Key Laboratory of Ocean Energy Utilization and Energy Conservation of Ministry of Education, Dalian University of Technology, Dalian, China; Pipeline and Pipeline Network Transportation Safety Assurance Technology Innovation Team, Ningbo Institute of Dalian University of Technology, Ningbo, China

  • Pipeline and Pipeline Network Transportation Safety Assurance Technology Innovation Team, Ningbo Institute of Dalian University of Technology, Ningbo, China

  • Pipeline and Pipeline Network Transportation Safety Assurance Technology Innovation Team, Ningbo Institute of Dalian University of Technology, Ningbo, China

  • Pipeline and Pipeline Network Transportation Safety Assurance Technology Innovation Team, Ningbo Institute of Dalian University of Technology, Ningbo, China