1. Introduction
The theoretical analysis of inequality has emerged since the Industrial Revolution, especially with the works
| [1] | Marx K. (1867), "Le Capiltal: critique de l’économie politique", édition sociale, Paris (3ème) 168 Rue du Temple. |
[1]
, who conceived the origin of income inequality and redistribution as a conflict between capital and labor, profits and wages, employers and employees. In a capitalist economy, besides natural resources, the fundamental factors of production are labor and capital. There is often a continuous struggle between them over the distribution of resources generated by the production process. Inequality is thus described as a conflict between those who own capital and those who do not own capital and must therefore rely on income from their labor
.
Moreover, neoclassical theory recognizes inequalities as a subject of economic optimality analysis. According to this approach, inequalities are considered favorable and endogenous to the development process, so that any developing economy is naturally unequal in income distribution
. However, this line of thinking, known as the “trickle-down” theory has finally been challenged by the supporters of the negative viewpoint of inequality. This latter approach rejects the purely virtuous nature of inequalities and shows that high inequalities generate negative externalities on well-being
| [5] | Alesina A.; Rodrik D. (1994), "Distributive politics and economic growth", The Quarterly Journal of Economics, Vol. 109 No 2, http://www.jstor.org/stable/2118470 |
| [6] | Galor O.; Zeira J. (1998), "Income distribution and macroeconomics", Journal of Economic Literature, working paper No 89-25, https://mpra.ub.uni-muenchen.de/51644/ |
| [7] | Piketty T. (1997), "La redistribution fiscale face au chômage", revue française d'économie, volume 12, no 1, 1997. pp. 157-201, https://doi.org/10.3406/rfeco.1997.1016 |
[5-7]
.
Public authorities are central in managing the problem of inequality through their economic intervention. In this context, economic policy assigns three functions to the state: resource allocation, regulation, and income redistribution
. Tax policy is one of the tools available to the state to effectively fulfill these functions. It provides the state with a stable and predictable budgetary environment, enabling it to accumulate necessary resources to finance social needs and ensure income redistribution. Generally, taxation influences income distribution through two mechanisms: first, the way tax revenues are collected, that is, the structure of the tax system; and second, the orientation of the use of these tax revenues in terms of financing public services
| [9] | Dao H; Godbout L. (2014), "Le rôle de la fiscalité dans la réduction des inégalités: doit-on se soucier de la structure fiscale servant à prélever les recettes ?", Revue d’analyse éconimique, 90(4), 303–327, https://doi.org/10.7202/1035111ar |
[9]
.
High levels of inequality slow social performance by preventing low-income individuals from reaching their potential
. Studies by
and
conclude that taxation is a powerful tool to promote a fair income distribution. It is an appropriate instrument for reducing income inequalities through taxing the highest wealth and social transfers.
Apart being the poorest continent, Africa is also among the most unequal, where concentrations of wealth and income is among the most extreme worldwide. The 0.01% of the richest Africans own more than 40% of the continent’s total wealth
| [12] | PNUD (2017), "Inégalités de revenus en Afrique subsaherienne: tendances divergentes, déterminants et conséquences". |
[12]
. Compared to other regions, West Africa has the largest number of countries where more than 30% of the population lives on less than $1.90 per day. The region also suffers from the lowest levels of public healthcare coverage and is characterized by a small proportion of the population having access to clean water and decent education
. This failure to meet basic needs is in parallel with deep inequalities
| [13] | Sane I.; Diedhiou F.; Niang A. A. (2021), "Contribution des financements internationaux à la réduction des inégalités de revenu en Afrique de l’Ouest, Revue Economie Gestion et Société, Vol 1, No 31, http://revues.imist.ma/?journal=REGS |
[13]
. In this context, taxation is identified as a relevant means for public authorities to generate the resources needed to finance social services.
It’s true that tax systems generate revenues to cover priorities in public spending, but poorly designed tax policies can hinder development and exacerbate inequalities. Therefore, beyond resource mobilization, emphasis must be placed on fiscal policies that promote the design of tax systems aimed at sustainable development, better income redistribution and helps mitigate shocks
| [21] | Obadic A.; Simurina N.; Sonora R. (2014), " The effects of tax policy and labour market institutions on income inequality", Zb. rad. Ekon. fak. Rij, Vol. 32, PP. 121-140. |
[21]
. This paper aims to analyze the effects of current tax instruments on income inequality in the WAEMU countries. To do so, we draw inspiration from the theoretical model proposed by
| [14] | Persson T.; Tabellini G. (1990), "The politics of 1992: fiscal policy and European integration", National Bureau of Economic Research, Cambridge, MA 02138, No. 3460. |
[14]
employed by
| [15] | Adam A.; Kammas P.; Lapatinas A. (2013), "Income inequality and the tax structure: evidence from developed and developing countries" MPRA paper no 46148, https://mpra.ub.uni-muenchen.de/46148/ |
[15]
. We then use two main analytical methods inherent to Panel VAR modeling.
The rest pf the paper is structured as follows: Section two presents the state of income inequalities in Africa and WAEMU countries. Section three discusses theoretical and empirical aspects of the role of taxation in reducing income inequality. Section four presents the methodological approach, while section five focuses on the interpretation and discussion of results. Finally, section six provides the conclusion and tax policy implications.
2. State of Income Inequality in Africa and WAEMU
Sub-Saharan Africa is the region suffering the most from income inequality and this cost a loss of over 32% of its Human Development Index
| [12] | PNUD (2017), "Inégalités de revenus en Afrique subsaherienne: tendances divergentes, déterminants et conséquences". |
[12]
. This percentage justifies the urgent demand for inequality reduction voiced by 79% of Sub-Saharan
in an Oxfam survey on public perceptions of inequality
. The 2017 edition of Africa Renewal reveals that 10 of the 19 most unequal countries in the world are in Sub-Saharan Africa, including South Africa, Botswana, Namibia, Nigeria, and Zambia. For example, in Nigeria, the five (5) richest people own alone a financial wealth of $29.9 billion, exceeding the entire national budget in 2017, while nearly 60% of Nigerians live on less than $1.25 per day. Similarly, in South Africa that is the most developed country on the continent, a minority accumulates wealth at the expense of the majority
.
The case of West Africa and WAEMU countries is also worrying. Despite West Africa experiencing the strongest economic growth in recent years, the lack of equitable and inclusive sharing of the fruits of this growth does not make it possible to reduce income inequalities
| [17] | Cavero T.; Guerena A. (2020),"Stratégies de réduction des inégalités en Afrique de l’Ouest", Facilité de recherche UE-AFD sur les inégalités no 7, décembre 2020. |
[17]
. West Africa shows some of the highest Gini coefficients in the world, with 56.2% in Guinea-Bissau, 59.8% in Burkina Faso, and 62.9% in Sierra Leone. The lowest inequality rates, 30.0% and 36.7%, are register respectively by Senegal and Côte d’Ivoire. The poorest 20% of the West African population receive only 5.2% of income, compared to over 50.6% for the richest 20%. In other words, the richest 20% earn ten times more income than the poorest 20%. This ratio varies widely from country to country, ranging from 5 times in Ghana to 20.5 times in Niger and 57.6 times in Sierra Leone
| [18] | CEDEAO (2020), "Document de stratégie régionale de réduction de la pauvreté en Afrique de l’ouest", Août 2020. |
[18]
. Such pronounced and variable income inequalities hinder growth’s contribution to poverty reduction.
Table 1. Palma Ratio, Gini Index, and ERI Index in WAEMU Countries.
Criteria | Benin | Burkina Faso | Ivory Coast | Mali | Niger | Senegal | Togo | WAEMU |
Palma Ratio | 2.80 | 1.49 | 2.00 | 1.25 | 1.40 | 1.85 | 2.18 | 1.85 |
Gini Index | 43.3 | 39.3 | 42.1 | 33.0 | 34.4 | 40.3 | 42.8 | 39.31 |
ERI Index | 0.19 | 0.24 | 0.25 | 0.23 | 0.18 | 0.29 | 0.24 | 0.23 |
Source: Oxfam, 2019
Table 1 shows the average level of the Palma ratio, the Gini index and the Engagement to Reduce Inequality (ERI) index within WAEMU countries, based on Oxfam’s 2019 report on inequality in West Africa. The Palma ratio compares the income of the 10% richest people to that of the 40% poorest people. The ERI index is the score of countries efforts in implementing policies that aimed at controlling income inequalities. The
table 1 reveals that, income inequalities are higher in countries such as Benin, Togo, Ivory Coast, and Senegal compared to other WAEMU countries. In these countries, the 10% richest people earn 2.8, 2.18, and 2 times higher than the 40% poorest, respectively. The ERI scores show that among WAEMU countries, Senegal leads efforts to fight inequalities, followed by Côte d’Ivoire, Burkina Faso, and Togo. The Gini coefficients confirm the situation depicted by the Palma and ERI index.Based on data from the WIID, we have produced
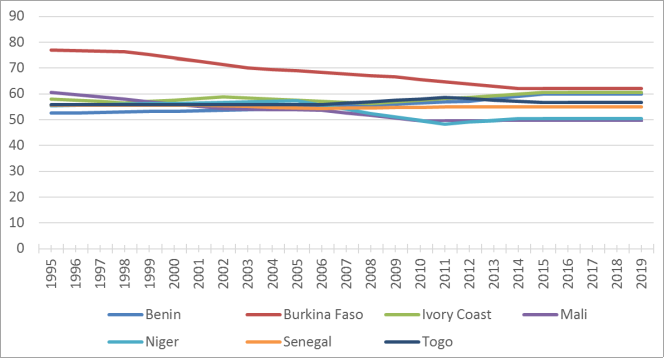
Figure 1. This figure shows the evolution of the Gini index for seven (7) WAEMU countries over the period from 1995 to 2019. From the reading of the Figure, it appears that the level of inequality in the WAEMU countries remains high, exceeding the average of 50% throughout the period studied. Specifically, this figure shows that Burkina Faso experienced the highest level of inequality, reaching up to 76% in 2000.
Figure 1. Evolution of income inequality in WAEMU countries.
3. Role of Taxation in Mitigating Income Inequality
Income inequality is a consequence of the unequal distribution of wealth among populations
| [19] | Benmoussa M. (2019), "Fiscalité et inégalités des revenus: panorama et état des lieux", Revue Internationale des Sciences de Gestion, numéro 5, volume 2, page 249 – 274. |
[19]
. Since income is generated by factors of production such as capital and labor, the level of income inequality can be assessed from the rate of return on capital and the economic growth rate. Indeed, when the rate of return on capital exceeds the economic growth rate, it generates income and welfare inequalities because, in this case, income is more concentrated in favor of capital owners.
Income redistribution plays a crucial role in mitigating inequalities. Its purpose is to reduce the gap created during the primary distribution of income. Taxation is a tool for income redistribution. Indeed, taxation is no longer just a means for the state to raise financial resources but also an instrument for redistribution and regulation
| [20] | Jnah A.; Sbihi M. (2017), "L’équité fiscale est-elle un mobile de répartition de la charge fiscale de l’impôt sur le revenu au Maroc ? ", Finance et Finance Internationale, No 6, pp. 1-16. |
[20]
. Through tax administration, the state can regulate the behavior of businesses and individuals as well as production and consumption.
The tax system is composed of various fiscal instruments that have different characteristics and therefore different mechanisms of impact on income distribution. For example, consumption taxes apply to all consumption expenditures made by taxpayers. However, it is the poorer households who devote a large part or almost all of their income to current consumption expenses, while wealthier individuals save or invest much more of their income. Thus, for poor people, the proportion of consumption taxes in income is higher than for higher-income people. Consequently, this type of taxation is recognized as regressive because the higher the taxpayer’s income, the relatively lower their consumption tax
| [21] | Obadic A.; Simurina N.; Sonora R. (2014), " The effects of tax policy and labour market institutions on income inequality", Zb. rad. Ekon. fak. Rij, Vol. 32, PP. 121-140. |
| [22] | Lustig N.; Enami A.; Taqdiri A. (2019), "Fiscal policy, inequality, and poverty in Iran: assessing the impact and effectiveness of taxes and transfers", Middle East Development Journal, https://doi.org/10.1080/17938120.2019.1583510 |
| [23] | Nyenke C. U.; Amadi N. N. (2019), "Taxation and income inequality in Nigeria", Advance Journal of Economics and Marketing Research, Vol. 4 Issue 3, ISSN: 2271 – 6239. |
| [24] | Casale D. (2009), "Indirect taxation and gender equity: evidence from South Africa", School of Development Studies, University of KwaZulu-Natal, January 2009. |
[21-24]
. Despite the ease they offer in revenue collection, consumption taxes do not help correct income inequalities.
On the other hand, income tax reduces inequalities by reduction the gap between the middle class and high-income earners
| [25] | Ciminelli G.; Ernst E.; Giuliodori M.; Merola R. (2017), "The composition effects of tax-based consolidations on income inequality", GLO Discussion Paper Series 25. |
[25]
. Since income is the taxable base, it can be used to levy more on higher incomes.
| [26] | Mirrlees J. A. (1971), "An exploration in the theory of optimum income taxation", The Review of Economic Studies, 38(2), p. 175. https://doi.org/10.2307/2296779 |
[26]
proposes designing an income tax schedule that depends both on the individual’s working time and labor income. Additionally, the use of resources generated from taxation is decisive in its role in reducing income inequalities. When these resources are directed as social transfers to the poorest groups and are used to finance social goods and services, then they can help correct inequalities
| [27] | Martorano B. (2018), "Taxation and inequality in developing countries: lessons from the recent experience of latin america", Journal of International Development 30, 256–273. |
[27]
.
Reducing inequality through fiscal policy also depends on the progressivity of the tax system’s structure
| [21] | Obadic A.; Simurina N.; Sonora R. (2014), " The effects of tax policy and labour market institutions on income inequality", Zb. rad. Ekon. fak. Rij, Vol. 32, PP. 121-140. |
[21]
. So, different forms of taxation, such as progressive and regressive taxes, do not affect income distribution in the same way. A progressive tax system involves taxing wealthier businesses and individuals more heavily in order to redistribute resources within society by taking more from the rich to give the poor, ensuring adequate funding for essential public services. Indeed, a progressive tax system is characterized by a rate that increases with the taxable base. The progressivity of the tax system guarantees the reduction of income inequalities, as it reduces income disparities both before and after taxes
| [19] | Benmoussa M. (2019), "Fiscalité et inégalités des revenus: panorama et état des lieux", Revue Internationale des Sciences de Gestion, numéro 5, volume 2, page 249 – 274. |
[19]
. Conversely, in a regressive tax system, the average tax rate decreases as the taxable base increases. Such taxation is likely to deepen income inequalities because if income tax is regressive, low-income individuals bear a higher tax rate. However, when resources are better redistributed to the poor, this inequality can be reduced despite regressive taxation.
Regarding direct taxes, their progressive design allows them to be used for reducing income disparities. However, despite their progressive nature, direct taxes are often paid by companies and legal entities, which are well equipped to engage in tax evasion and fraud practices, limiting the contribution of such taxes to reducing income inequality. Moreover, the fact that some taxpayers engage in fraud and tax evasion further increases inequality and consequently reduces the effectiveness of taxation in mitigating it.
Empirically, while the role of fiscal policy in reducing inequality is well documented in developed countries, its presence in Sub-Saharan African countries remains relatively marginal. In a study on Kenya
| [28] | Wanyagathi A. M. (2017), "The effect of consumption taxes on poverty and income inequality in Kenya", International Journal of Accounting and Taxation, December 2017, Vol. 5, No. 2, pp. 56-82, https://doi.org/10.15640/ijat.v5n2a5 |
[28]
; investigated how consumption taxes affect income inequality. After conducting the Johansen test, which indicated no cointegration between variables, he estimated a VAR model using OLS. The results showed that consumption taxes increase income inequality. This finding is consistent with
| [29] | Martinez-Vazquez J.; Moreno-Dodson B.; Vulovic V. (2012), "The impact of tax and expenditure policies on income distribution: evidence from a large panel of countries", International Center for Public Policy Working Paper, https://scholarworks.gsu.edu/icepp/77 |
[29]
, who concluded that consumption taxes are essentially regressive and thus do not facilitate income redistribution.
| [30] | Mogota A. T. (2021), "Mobilisation des revenus fiscaux et gouvernance en Afrique Sub- Saharienne: le rôle des inégalités de revenu", RETA, Vol. 11, No 1, Juin 2021. |
[30]
, on the other hand, incorporated governance variables in his research on the role of income inequality in tax revenue mobilization across 15 Sub-Saharan African countries. Using a methodology inspired by
| [28] | Wanyagathi A. M. (2017), "The effect of consumption taxes on poverty and income inequality in Kenya", International Journal of Accounting and Taxation, December 2017, Vol. 5, No. 2, pp. 56-82, https://doi.org/10.15640/ijat.v5n2a5 |
[28]
, he estimated two random-effects models via generalized least squares. His atypical result indicated that income inequality positively influences tax revenue mobilization in Sub-Saharan Africa. The clarification given for this result, which is also supported by the work of
, is that the progressivity of taxation for the purpose of reducing inequality is only effective when countries have a satisfactory level of democracy. Indeed, when governance is poor, tax revenues tend to be unfocussed to benefit a limited group, thereby contributing to increased inequality.
In an analysis of the link between tax policy, income inequality, and poverty,
| [32] | Lustig N. (2017), "Fiscal policy, income redistribution and poverty reduction in low- and middle-income countries", CGD working paper 448, http://www.cgdev.org/publication |
[32]
studied the effect of different components of the tax system on inequality and poverty. To achieve this, he used the marginal contribution approach to calculate the effect of various taxes on inequality and poverty. This approach was also employed by
| [22] | Lustig N.; Enami A.; Taqdiri A. (2019), "Fiscal policy, inequality, and poverty in Iran: assessing the impact and effectiveness of taxes and transfers", Middle East Development Journal, https://doi.org/10.1080/17938120.2019.1583510 |
[22]
, in a similar study. The concept of marginal contribution refers to the analysis of income distribution in the absence of taxation or transfers. It is the difference between this counterfactual and the actual income distribution that represents the marginal contribution of taxation in reducing inequality. For example, the marginal contribution of direct taxes to income distribution would be the difference between the Gini coefficient calculated from disposable income after direct taxes and the Gini coefficient without direct taxation. This contribution also allows assessing how inequalities related to a type of income behave when a specific component of the tax system is removed. The advantage of the marginal contribution method is that it is not influenced by the order in which different tax types are included in the calculation. However, the main criticism of this method is that there is no guarantee that the sum of the marginal contributions of all tax components equals the total distributive effect of the tax system. Nevertheless, it is a method that allows evaluating the effect of fiscal policy changes on inequalities. Their results indicate that indirect taxes such as sales taxes increase inequalities, whereas direct transfers have a positive marginal contribution to income.
4. Methodology
4.1. The Model
Our conceptual model is based on the theory according to that income inequalities arise from distortions inherent in the simultaneous taxation of capital and labor. This model is inspired by the work of
| [14] | Persson T.; Tabellini G. (1990), "The politics of 1992: fiscal policy and European integration", National Bureau of Economic Research, Cambridge, MA 02138, No. 3460. |
[14]
and was also later used by
| [15] | Adam A.; Kammas P.; Lapatinas A. (2013), "Income inequality and the tax structure: evidence from developed and developing countries" MPRA paper no 46148, https://mpra.ub.uni-muenchen.de/46148/ |
[15]
. In this model, the economy is characterized by two periods during which a basic good is produced using a technology that employs one factor. Policy decisions are made by the government and precede any economic choices made by economic agents. The economy is characterized by a continuum of consumers indexed by Consumers' preferences over the two periods in terms of consumption
and leisure
are represented by equation (
1).
Where and are twice differentiable, with a positive first derivative and a negative second derivative. In the first period, each individual is endowed with units of wealth, which they can choose to consume at a given point in time or save for another purpose in the second period. In the second period, the consumer has an endowment of time, which can be allocated either to labor or to leisure. This assumption implies that labor and wealth endowments are negatively correlated and shows whether the individual i has relatively more labor or wealth.
In the second period, the government introduces a tax on labor income and accumulates wealth in the form of capital by using a set of tax instruments
) in order to finance public expenditures. This implies that the government's budget constraint is given by equations (
2) and (
3):
(3)
Where
is the level of capital brought in the second period by consumer. It follows that the time constraint for each individual can be written as equation (
4).
Maximizing equation (
1) subject to constraints (
2), (
3), and (
4) yields the labor and capital functions presented in equations (
5) and (
6).
It is assumed that government decisions arise from the maximization of a general social welfare function such as that presented by equation (
7).
) + (1-)()(7)
Where ) is the indirect utility of the group of individuals whose decisions are insufficient and () is the indirect utility of the other group of agents who have political power over government decisions. captures the influence of the median voter relative to other groups of individuals. If the objective function of government is exclusively the well-being of the median voter. For , the preference of other minorities also counts in political decisions. The parameter λ thus makes it possible to assess the evolution of inequalities within the population.
According to
| [14] | Persson T.; Tabellini G. (1990), "The politics of 1992: fiscal policy and European integration", National Bureau of Economic Research, Cambridge, MA 02138, No. 3460. |
[14]
, the equilibrium policy that leads to an egalitarian distribution of welfare is given by the maximization of expression (
7) subject to the budget constraints (
8)
(8)
Where
et
are respectively elasticities of labor and capital factors with respect to the tax rate. By deviating from equilibrium, high inequality implies a low value of
, which implies that the left-hand side of equation (
8) is less than the right-hand side. From this relation (
8), it is established that whenever λ is non-zero, the inequality which is measured by
compared to the value
, will be affected by the tax rate. Specifically, as λ is large, the tax system generates inequality. Based on these theoretical considerations, and inspired by the works of authors such as
| [33] | Thilanka C.; Ranjith S. (2021), "The effect of tax composition on income inequality: Sri Lankan experience", Sri Lanka Journal of Economic Research, Volume 8(2) pp. 03-20, http://doi.org/10.4038/sljer.v8i2.134 |
| [29] | Martinez-Vazquez J.; Moreno-Dodson B.; Vulovic V. (2012), "The impact of tax and expenditure policies on income distribution: evidence from a large panel of countries", International Center for Public Policy Working Paper, https://scholarworks.gsu.edu/icepp/77 |
| [31] | Duncan D.; Sabirianova P. K. (2016), "Unequal inequalities: do progressive taxes reduce income inequality?", International Tax Public Finance, https://doi.org/10.1007/s10797-016-9412-5 |
[33, 29, 31]
, and
| [28] | Wanyagathi A. M. (2017), "The effect of consumption taxes on poverty and income inequality in Kenya", International Journal of Accounting and Taxation, December 2017, Vol. 5, No. 2, pp. 56-82, https://doi.org/10.15640/ijat.v5n2a5 |
[28]
, who estimated empirical models explaining the inequality variable using fiscal instruments and other control variables, we estimate equation (
9) below
(9)
With
the measure income inequality, the set of tax instruments is employed to assess the effect of tax policy, and X is the vector of control variables that account for a number of socio-economic factors likely to influence the evolution of inequality. A detailed description of these variables is presented in
Table 2. This model is estimated using the panel VAR method.
4.2. Variables and Data Sources
The variables used in the model are presented as follows:
Table 2 below provides a detailed overview of the data collected for these variables.
Table 2. Description of variables.
Variables | Details |
Gini | Varying between 0 and 100, the closer it is to 100 the lower the inequality |
ReFis | Total tax revenue as a% of GDP |
ImDir | Direct tax revenue as a% of GDP |
ImBS | Total taxes on goods and services as a% of GDP |
ImRP | Personal income tax revenue as a% of GDP |
ImRS | Corporate tax revenue as a% of GDP |
CxEc | Annual GDP growth rate |
Corru | Corruption control index ranging from -2.5 to 2.5 |
Tscol | Minimum secondary school completion rate |
Source: Authors
The data on fiscal variables were collected from the Government Financial Statistics (GFS) database of the International Monetary Fund (IMF). Data on the Gini index come from the World Income Inequality Database (WIID) of UNU-WIDER. Data on other control variables were drawn from the World Bank’s World Development Indicators (WDI).
5. Presentation and Interpretation of Results
5.1. Descriptive Statistics
Table 3. Descriptive statistics.
Var. | Moy. | Max | Min | Median | St-error | Skewness | Kurtosis |
Gini | 57.517 | 77.085 | 49.578 | 55.926 | 18.619 | 0.246 | 2.405 |
ReFis | 11.445 | 18.155 | 5.374 | 11.102 | 2.747 | 0.103 | 2.547 |
ImDir | 4.545 | 12.085 | 0.111 | 4.275 | 1.826 | 0.633 | 4.460 |
ImRS | 1.654 | 5.451 | 0.340 | 1.443 | 0.832 | 1.454 | 5.654 |
ImRP | 2.894 | 6.587 | 1.091 | 2.702 | 0.945 | 0.652 | 3.507 |
ImBS | 6.811 | 15.319 | 0.326 | 7.066 | 2.795 | -0.319 | 2.439 |
Crpop | 2.910 | 3.907 | 1.827 | 2.832 | 0.437 | 0.463 | 2.834 |
CxEc | 4.145 | 15.376 | -15.095 | 4.656 | 3.607 | -0.609 | 6.624 |
Corru | -0.637 | 0.176 | -1.240 | -0.637 | 0.315 | 0.302 | 2.529 |
Tscol | 47.347 | 92.715 | 13.453 | 45.367 | 18.619 | 0.246 | 2.405 |
Source: Authors, based on data from WDI, WIID and GFS.
The descriptive statistics of the variables used are presented in
Table 3. From the analysis of this table, it appears that the average value of the Gini index is 57.51% in WAEMU countries. The index reached a maximum of 77% observed in Burkina Faso and a minimum of 49% recorded in Mali. The relatively low standard deviation of the Gini index indicates that income inequality has shown little variation among WAEMU countries over the period studied. It also emerges that the average tax pressure is 11.44% across the WAEMU countries, which is low compared to the convergence criterion target of 20%. The maximum value in the series is 18.15%, while the minimum is 5.37%.
For direct and indirect tax revenues, the average values were 4.54% and 6.81% of GDP, respectively. Their minimum levels were 0.11% and 0.33% of GDP, while their highest levels in the series were 15.32% for indirect taxes and 12.08% for direct taxes. This indicates that indirect taxation accounts for a larger share of tax revenue compared to direct taxation.
5.2. Results of Some Validity Tests
i. Cointegration Test
In a PVAR modeling framework, the cointegration test is crucial. The cointegration test confirms the appropriateness of using the PVAR approach. A PVAR model is estimated only in the absence of a cointegration relationship among the variables. To verify whether such a relationship exists, we applied the Pedroni cointegration test (1999). The results indicate that the variables in the model are not cointegrated.
The outcomes of the test are presented in
Table 4 and support the use of panel VAR modeling for our estimations
| [34] | Toda H. Y.; Yamamoto T. (1995), "Statistical inference in vector autoregressions with possibly integrated processes " Journal of Economics, No 66, PP. 225-250. |
[34]
.
Table 4. Results of cointegration tests.
| Statistics | Probability |
Panel PP Statistic | -1.3495 | 0.110 |
Modified PP Statistic | -6.1775 | 0.280 |
ADF Statistic | -7.9605 | 0.500 |
Source: Authors
ii. Optimal Lag Selection Test
Based on the three (3) model selection criteria defined by
| [35] | Andrews D. W. F.; Lu B. (2000), "Consistent model and moment selection procedures for GMM estimation with application to dynamic panel data models", Journal of Econometrics, 101(2001), PP. 123-164, August 2000. |
[35]
, we estimated the optimal lag order to be retained in the model. The results of the lag order selection estimation are summarized in
Table 5 below. From the analysis of these results, it appears that a lag of order 1 is optimal, as it simultaneously minimizes the values of the three information criteria (MBIC, MAIC, and MQIC).
Table 5. Selection of the optimal delay order.
Lags | J statistic | J P-value | MBIC | MAIC | MQIC |
1 | 118,508 | 0,078 | -391,484* | -77,492* | -204,780* |
2 | 59,452 | 0,146 | -195,545 | -38,548 | -102,192 |
3 | 144,791 | 0,000 | 108,363 | 130,791 | 121,699 |
Source: Authors
iii. Model Stability Test
The model stability test is necessary as it provides information on the reliability of the impulse response functions and their interpretations.
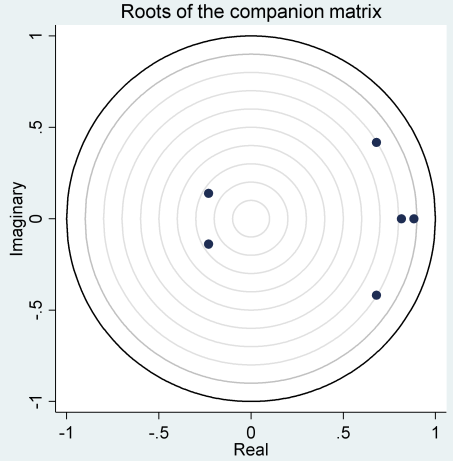
Figure 2 below presents the results of the stability test of the estimated model. From this figure, we observe that all points associated with the inverse roots of the characteristic polynomial lie within the unit circle. Therefore, the estimated panel VAR model is stable. The results of this test also indicate that we can provide a reliable interpretation of the impulse response functions.
Figure 2. Stability Test Results.
iv. Granger Causality Test
In order to identify, among the available fiscal instruments, those that influence income inequality in WAEMU countries, we conducted the Granger causality test. The results of this test allow us to determine in advance which fiscal variables should be linked with the inequality variable for the analysis of impulse response functions. To do so, we used the Granger causality test developed by
. The results of this test are summarized in
Table 6. These results show that four (4) fiscal variables—namely, direct taxes, personal income tax, taxes on goods and services, and overall tax pressure Granger-cause income inequality in WAEMU countries.
Table 6. Results of Granger causality tests.
Variables | Z bar Statistics | P-value | Z tilde Statistics | P-value |
ReFis | 3,499*** | 0,000 | 2,895*** | 0,004 |
ImDir | 9,837*** | 0,000 | 8,383*** | 0,000 |
ImBS | 2,232** | 0,025 | 1,798* | 0,072 |
ImRP | 5,223*** | 0,000 | 4,387*** | 0,000 |
ImRS | 0,118 | 0,905 | -0,032 | 0,974 |
Tva | 0,582 | 0,560 | 0,369 | 0,712 |
Accis | -0,476 | 0,634 | -0,547 | 0,584 |
Corru | -0,201 | 0,840 | -0,309 | 0,757 |
Tscol | 1,340 | 0,180 | 1,025 | 0,305 |
Source: Authors, based on test results
5.3. Analysis of Impulse Response Functions
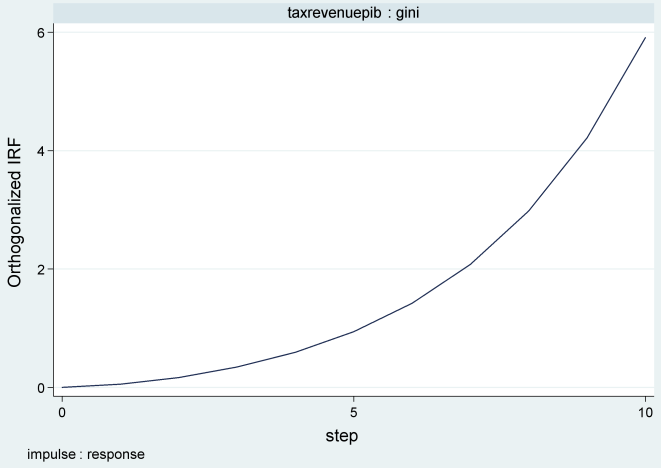
Figure 3 presents the impulse response function of the Gini index resulting from a shock to overall tax pressure. From this figure, it appears that income inequality reacts slightly following a shock to total tax revenue, and after this slight reaction, inequality increases over time to reach up to 6% around the tenth year. Therefore, a positive shock to tax revenue leads to a positive variation in the Gini index, thereby increasing income inequality. This result indicates that the overall tax system in WAEMU countries contributes to rising income inequality. In other words, the tax system of WAEMU countries do not yet fully meet the equity dimension of their objectives.
Figure 3. Response of Inequality Following a Shock to Tax Revenues.
Equity is one of the three main characteristics of a good tax system, as we mentioned earlier. This result confirms the findings of
| [27] | Martorano B. (2018), "Taxation and inequality in developing countries: lessons from the recent experience of latin america", Journal of International Development 30, 256–273. |
[27]
, who concluded that the redistributive role of the tax system in developing countries is limited. Dao and Godbout (2014) also concluded that the level of tax revenue collected is a key factor in the role taxation plays in reducing inequality. This result can also be explained by the under-collection of tax revenues observed in the WAEMU countries. Moreover, the main components of the tax system in the WAEMU countries are collected below their fiscal potential
| [37] | Compaoré A. (2021), "From tax revenue mobilization to financial development: essays on financing for development", Thèse de doctorat ès Sciences Économiques, Université Clermont Auvergne, CNRS, IRD, CERDI, F-63000 Clermont-Ferrand, France. |
[37]
(Kobyagda, 2019), which limits the overall redistributive capacity of the tax system.
The subsequent impulse response analyses focused on the main categories of taxation.
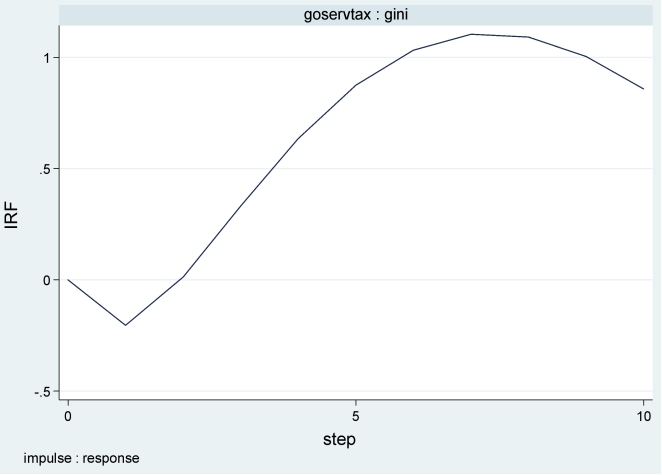
Figure 3 presents the response of income inequality following a shock to indirect taxes, specifically taxes on goods and services. The analysis of this figure shows that the Gini index responds immediately after a shock to taxes on goods and services. After a slight negative response of the Gini index (around a maximum of -0.2%), the effect turns positive from the second period onward. Over time, the positive reaction of the Gini index grows rapidly, exceeding an increase of 1%. Thus, the initially favorable influence of this shock on inequality in the short term is quickly overtaken by a largely unfavorable reaction with respect to inequality.
Figure 4. Response of Inequality Following a shock to taxes on goods and services.
This positive reaction of the inequality index to a positive shock in taxes on goods and services suggests that indirect taxation promotes income inequality in the WAEMU countries. This result confirms the literature
| [29] | Martinez-Vazquez J.; Moreno-Dodson B.; Vulovic V. (2012), "The impact of tax and expenditure policies on income distribution: evidence from a large panel of countries", International Center for Public Policy Working Paper, https://scholarworks.gsu.edu/icepp/77 |
[29]
; Obadic et al.
| [21] | Obadic A.; Simurina N.; Sonora R. (2014), " The effects of tax policy and labour market institutions on income inequality", Zb. rad. Ekon. fak. Rij, Vol. 32, PP. 121-140. |
| [27] | Martorano B. (2018), "Taxation and inequality in developing countries: lessons from the recent experience of latin america", Journal of International Development 30, 256–273. |
[21, 27]
, which states that a tax system based on taxes on goods and services creates more inequality because the poorest spend a larger proportion of their income on consumption compared to the wealthy and therefore pay relatively more taxes on goods and services than the rich. This may be due to the large number of exemptions introduced in the indirect tax system aimed at facilitating access to certain products for low-income individuals; however, it is the wealthy who ultimately benefit from these tax exemptions.
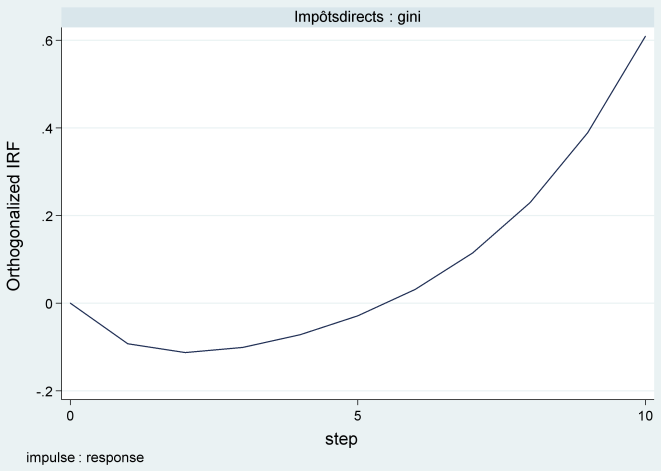
Figure 4 presents an illustration of the response of the Gini index following a positive shock to income taxes. The analysis of this figure shows that income inequality does not respond immediately to a shock in income tax. However, if this shock persists, the Gini index responds negatively from the second year onward, and this negative effect grows over time. This result shows that income tax contributes to reducing income inequality in the WAEMU countries since the greater the decrease in the Gini index, the lower the income inequality. Overall, this result is expected given the progressive nature of income taxes applied in the fiscal systems of the WAEMU countries. Income tax is thus a tool that can help reduce inequality in these countries. However, the fact that the progressive tax policy is sometimes undermined by tax evasion behaviors among some taxpayers could explain why the income tax shock does not produce an immediate effect. Therefore, it is appropriate to take into account the time factor when implementing policies to reduce inequality through income tax.
This finding of the income tax’s role in reducing inequality has also been reported in research such as
. Similarly,
| [29] | Martinez-Vazquez J.; Moreno-Dodson B.; Vulovic V. (2012), "The impact of tax and expenditure policies on income distribution: evidence from a large panel of countries", International Center for Public Policy Working Paper, https://scholarworks.gsu.edu/icepp/77 |
[29]
showed that progressive income taxation favors income redistribution in developing countries and thus contributes to reducing inequalities. However, in the works of
| [28] | Wanyagathi A. M. (2017), "The effect of consumption taxes on poverty and income inequality in Kenya", International Journal of Accounting and Taxation, December 2017, Vol. 5, No. 2, pp. 56-82, https://doi.org/10.15640/ijat.v5n2a5 |
[28]
and Dao and Godbout (2014), the negative impact of income tax is not significant. Furthermore, this result aligns with recent studies by
| [33] | Thilanka C.; Ranjith S. (2021), "The effect of tax composition on income inequality: Sri Lankan experience", Sri Lanka Journal of Economic Research, Volume 8(2) pp. 03-20, http://doi.org/10.4038/sljer.v8i2.134 |
[33]
, who conclude that income tax is a type of tax that can be used to address income distribution issues while increasing fiscal revenues. Moreover,
| [27] | Martorano B. (2018), "Taxation and inequality in developing countries: lessons from the recent experience of latin america", Journal of International Development 30, 256–273. |
[27]
shows that income taxation ensures the reduction of income gaps existing among different population groups.
Figure 5. Response of the Gini Index to a Shock in Income Tax.
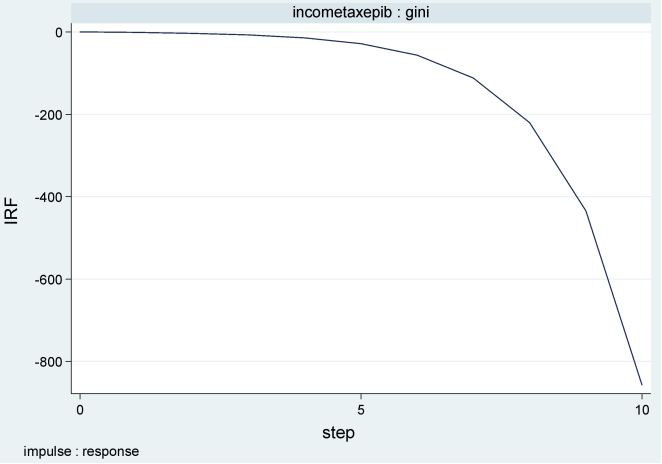
Following the income tax, we also examined the consequences of a shock on direct taxes as a whole on income inequalities. As shown in
figure 5, a positive increase in direct taxes creates, in the short term, a negative variation of the Gini index, reaching approximately (-0.1%) around the third year. This reaction of the Gini index then reverses direction and returns to zero just after the fifth period. From this period onward, the inequality response becomes positive and continues in the long term.
Figure 6. Response of the Gini index following a shock to direct taxes.
Unlike the specific case of income tax, we observe that a shock on all direct taxes starts to favor inequalities after a few years of implementation. This can be explained by the fact that not all taxes included in direct taxation have the same characteristics in terms of progressivity. This is the case, for example, for corporate tax and wealth tax, for which a proportional tax system is applied. Moreover, this can be explained by the observed difficulties in effectively taxing the highest incomes in developing countries
| [27] | Martorano B. (2018), "Taxation and inequality in developing countries: lessons from the recent experience of latin america", Journal of International Development 30, 256–273. |
[27]
.
6. Conclusion and Tax Policy Implications
In this paper, we analyzed the relative effectiveness of different fiscal instruments in reducing income inequalities. The performance of the main components of the tax system was used to assess fiscal policy. The Gini index extracted from the UNU-WIDER WIID database was used to measure income inequalities, and a panel VAR modeling approach was adopted for estimation. After conducting the main preliminary tests inherent to a PVAR modeling, we used two analysis methods: the Granger causality test and impulse response functions to identify the tax instruments that are most effective in reducing income inequalities in the WAEMU countries. The results of the Granger causality test applied to our data showed that direct taxes, indirect taxes, individual income tax, and total tax pressure are the fiscal instruments that significantly affect income inequalities in WAEMU countries. The estimation of impulse response functions allowed us to analyze the direction and dynamics of the influence of these fiscal instruments on income inequalities in WAEMU countries.
Accordingly, we found that overall tax pressure tends to increase income inequalities in WAEMU countries. However, when focusing on specific tax types, direct taxes and their component, personal income tax, contribute to reducing income inequalities. On the other hand, indirect taxes, notably taxes on goods and services, increase income inequalities in WAEMU countries. Based on these results, we derive the following tax policy implications aimed at improving the contribution of taxation to reducing inequalities in WAEMU countries:
(i) Strengthen the progressivity of all direct taxes to ensure that higher incomes are sufficiently taxed;
(ii) Establish a mechanism for direct redistribution of additional fiscal resources resulting from the implementation of progressive tax reforms;
(iii) Conduct impact assessment studies to determine the tax bases and rates on goods and services that should be adjusted;
(iv) Take equity issues into account when setting revenue targets and designing new fiscal reform measures.