Research Article | | Peer-Reviewed

Characterization of Soil Erosion Using RUSLE Model and GIS at Erer Watershed Babile District, East Hararghe Zone, Ethiopia

Received: 10 January 2024     Accepted: 8 February 2024     Published: 14 March 2026
Views:       Downloads:
Abstract

Currently the rate of soil erosion is severe in the low lands of Ethiopia. Identification of hot-spot areas of erosion and prioritizing areas of intervention is extremely important for reducing further degradation, reclaiming the degraded areas and improving the land productivity of the watershed. The RUSLE model with GIS environment helps watershed management in assessing and identifying erosion hotspot areas for undertaking required conservation measures. Erer watershed is found in Ethiopian Wabishebele basin. The objective of this study was to Characterize soil erosion and prioritize sub watersheds in Erer watershed in eastern Hararghe. The Revised Universal Soil Loss Equation (RUSLE) integrated with satellite remote sensing and geographical information systems (GIS) as a useful tool for conservation planning was used. Mean annual precipitation, soil map, a 30m digital elevation model, land-cover and management map, land use types and slope length and slope steepness were used to determine the RUSLE values. Homogeneity and consistency test were undertake before each analysis. Homogeneity test for the collected data was homogeneous that the observation was from the same population and the consistency of the rainfall was linear. Mainly the practice of removing plant residues, poor physical soil conservation measures, lack of conservation practice and ploughing the land several times may be the reasons for the high soil loss in the study area. Moreover, the total soil loss in the study area was 7,895,824.22 metric tons per year from 216,762.2ha of land with mean soil loss of 24.61 t/ha/yr. The very high soil loss was observed in steep dissected to mountainous terrain of the upstream of watershed. Out of the 11 SWs, six sub watersheds SW6, SW8, SW9, SW11, SW7 and SW4 were existed under very high erosion rate with mean soil loss ranges from 32.33 to 38.92 t/ha/yr which cover 24 percent of the total land and high soil loss rate was estimated. Soil loss ranges from 21.58 to 27.1 and covers 50 percent of the total land. The watershed has a range of the erosion severity classes of extremely severe, very sever and sever. The steep slope of upstream watershed have contribute high soil loss are more critical and should be given first priority during intervention measures. The poor vegetation cover management and the lack of conservation practice of the area should be improved to reduce the high soil loss throughout of the watershed.

Published in International Journal of Environmental Protection and Policy (Volume 14, Issue 1)
DOI 10.11648/j.ijepp.20261401.12
Page(s) 18-29
Creative Commons

This is an Open Access article, distributed under the terms of the Creative Commons Attribution 4.0 International License (http://creativecommons.org/licenses/by/4.0/), which permits unrestricted use, distribution and reproduction in any medium or format, provided the original work is properly cited.

Copyright

Copyright © The Author(s), 2026. Published by Science Publishing Group

Keywords

Slope, Watershed, Erosion, Soil Loss
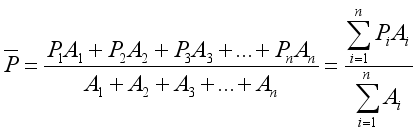
1. Introduction
Erosion characterization processes have been intensively studied for many decades by several researchers . Though many physical based models are available to estimate soil erosion and sediment yield, simple empirical models are still popular, most widely used It also be used at a regional scale very effectively . Soil erosion in association with inappropriate land management practices is one of the main factors causing degradation in Bullulo watershed. Most soil and water conservation planning approaches rely on empirical assessment methods RUSLE is the improved form of USLE that has been most widely used and robust model for estimation of soil erosion loss. Land degradation, a decline in land quality, is a serious threat to the prosperity of rural population in the world .
In East Hararghe, more and more marginal areas are being used for agriculture which led to rapid natural resources degradation, particularly soil degradation. Now days, the problem also expanded throughout the watershed. The Erer watershed adequately represented by crop cultivation and human inhabitation has taken place from a long period of time leading to expansion of farming activities, and increasing population settlements.
Thus, there is need for appropriate interventions to address the prevailing constraints using suitable technologies for improved and sustainable agricultural production. To undertake corrective measures and prevent further degradation of the watershed, timely information on the extent and spatial distribution of erosion areas is of paramount importance. Such characterization and analysis is of great use to natural resources managers, development agents, fund providers, socio-economic development planners, public administrators, and environmentalists because it provides accurate information related to soil loss rate. Therefore, it is necessary to focus on watershed delineation, erosion characterization and restoration efforts on selected watershed priority areas which need immediate attention and where there is hope of making a meaningful difference . Under these circumstances, Remote Sensing (RS) and Geographical Information System (GIS) in combination with Revised Universal Soil Loss Equation (RUSLE) become valuable tools to achieve more satisfactory results in the assessment of soil erosion in the watershed.
Hence, the general objective were to assess soil loss using GIS based RUSLE model for proper soil conservation planning in the watershed to adopt sustainable land and water resource management that can contribute for improvement of the agricultural productivity of the watershed.
The specific objectives of the study were:
1) To characterize soil erosion using GIS based RUSLE model in the watershed, and
2) To identify erosion hot spot areas and prioritize sub-watersheds.
2. Materials and Methods
2.1. Description of the Study Area
Erer-Guda catchment is located in Babile district, Oromia National Regional State, eastern part of Ethiopia. It is located at a distance of 530 km from Addis Ababa (16km from Harar town). The watershed covers an area of 45,703 hactares and lies at 42˚ 13′ 30′′ to 42˚ 16′ 30′′ E and 09˚ 14′ 15′′ to 09˚ 16′ 30′′ N (Figure 1) with elevation ranging from 1314m a.s.l. The watershed drains to the Wabishebele River Basin. Mean annual rainfall is 795.855mm and mean maximum and minimum annual temperatures are about 25.10°C and 12.40°C respectively.
Figure 1. Location map of the study area.
Climate: The average mean of rainfall was interpolated in arc GIS10.1 by Theissen Polygon method to generate average rainfall data for Erer watershed. The Thiessen polygon is the most common method used in hydrometeorology for determining average precipitation over an area equation (1).
(1)
where is the weighted average, P’s are rainfall amount recorded at different station and A’s are areas of each polygon.
Topography: The study area is a flat and medium terrain with steep slopes characterizes the upstream part, but the midstream and downstream part has flat to almost flat terrain and gentle slopes with 0-10% and mean elevation of the study area 1545m.a.s.l.
Source: slope class of

Download: Download full-size image

Figure 2. Slope class of Erer watershed.
Table 1. Major soil types and their area coverage.

Major soil types

Area (ha)

Area (%)

Cambisols

33,923

74.23

Leptosols

8,867

19.40

Glyesols

1,989

4.35

Luvisols

778

1.70

Nitisols

146

0.32

Total

45,703

100

Soil type: The Shape file of the major soil type of the study area was collected from Minstry of Water, Irrigation and Energy MoWIE (2020/21) and the soil map of the study area was prepared by using ArcGIS10.1 software. The major soil types of the watershed are Cambisols, Leptosols, Glyesols and Luvisols (Table 1).
Figure 3. Major soil types of Erer watershed.
Land use/ cover: The major land use land cover types of the study area is derived from Landsat 8 (LDCM) for 2020 which includes settlement, cultivated, woodland, bareland and shrub and bushland (Table 3). The dominant crops grown are maize, sorghum, soyabean and finger millet. Countour farming is common practice among farmers in the watershed.
Figure 4. landuse/cover types of Erer watershed.
2.2. Methods of Data Analysis
Sub-watershed delineation: Watershed delineation were done using ArcSWAT in ArcGIS 10.3 version environment. Thirty meter (30m*30m) resolution Digital Elevation Model (DEM) was filled in areas of internal drainage so as to create depression less elevation grid. From filled DEM, flow direction and flow accumulation was generated. Then the subwatersheds were delineated using GIS (Table 2).
Table 2. Area distribution of sub watershed.

Sub-watersheds

Area (ha)

Area (%)

1

24.10

2.69

2

1003.04

6.57

3

1067.46

0.04

4

2606.85

2.53

5

2917.75

11.83

6

1005.07

2.53

7

1195.44

3.01

8

3614.62

9.10

9

4697.83

7.35

A10

2928.52

4.86

11

1029.22

2.59

Total

22089.9

53.1

Sub-watershed prioritization: Revised Universal Soil Loss Equation was used for the identification of priority areas in Erer watershed based on intensity of erosion rate/ mean soil loss from each of sub-watersheds. Input parameters for RUSLE model approach was derived through GIS analysis and digital image processing.
RUSLE Factor Generation for Soil Erosion Estimation: Soil loss computation were conducted by RUSLE model.
Rainfall erosivity (R) factor: Due to rainfall characteristics and absence of automatic hourly rain intensity records in many rainfall stations in Ethiopia, it is difficult to apply erosivity equation proposed by . for Ethiopia condition . Therefore, for this study the value of R-factor was computed by using the regression equation developed by .
R = 0.67P1.19(2)
where: R is rain fall erosivity and P is the mean annual rainfall in mm.
Soil erodibility factor (K): From soil sample taken soil texture, organic carbon and permeability at soil laboratory were analyzed and soil structure were identified at field by observation .
Topographic (LS) factors: When using RUSLE, the effects of topography on soil erosion are estimated by the slope length (L) and slope steepness (S). In RUSLE, slope length is defined as the horizontal distance from the origin of overland flow to the point where deposition begins or where runoff flows into a defined channel .
Crop management (C) factor: Land use/cover data were prepared from 2017 year Landsat images and supervised digital image classification technique were employed, using ERDAS 15 software .
Table 3. Land use/cover C-value used in different studies.

No

Land use

C-value

References

1

Cultivated Land

0.17

Hurni (1988)

2

Settlement

0.03

SWCS, 2003

3

Woodland

0.06

FAO (1986)

4

Bare land

0.6

BCEON (1998)

5

Shrub and bush land

0.014

Wischmer and Smith (1978)

Source: Hurni (1988)
Supporting conservation practice (P) factor: Specific cultivation practices affect erosion by modifying the flow pattern and direction of runoff and by reducing the amount of runoff . The support practice factor P represents the effects of those practices such as contouring, strip cropping, ter-racing, etc. that help prevent soil from eroding by reduc-ing the rate of water runoff.
Table 4. Conservation practice factor (P-value).

Cultivation and slope. Slope (%)

Contouring

Strip Cropping

Terracing

0.0 - 7.0

0.55

0.27

0.10

7.0 - 11.3

0.60

0.30

0.12

11.3 - 17.6

0.80

0.40

0.16

17.6 - 26.8

0.90

0.45

0.18

>26.8

1.00

0.50

0.20

Source: Shin (1999)
Soil Erosion Assessment by RUSLE: The produced maps for all the RUSLE input parameter (R, K, L, S, C, and P) were integrated in raster calculater of ArcGIS10.3 and overlaid using spatial join in ARC/INFO spatial analyst.
Prioritization of the sub-watersheds: The sub watersheds were ranked according to their degree of soil erosion risk using soil erosion severity class .
3. Results and Discussions
3.1. Out Put of RUSLE Factors
Rainfall Erosivity (R) factor
Figure 5. Rainfall erosivity map of study area.
The highest values of Erosivity (R) were distributed around the upstream part of the watershed. On the other hand lowest value of Erosivity were occured at the end of low stream, and the lowest part of the watershed to the outlet. The range of R factor was observed from 375 to 396 MJ*mm/ha*hr*year (Figure 5).
Soil Erodibility (K) factor: Soil erodiblity (K) factor is found from the range of 0.012 to 0.263 (Figure 6). The most highest values of K was distributed in Rhodic Nitisols and Dystric cambisols and the lowest values was distributed in haplic Alisols as shown in Figure 6.
Figure 6. Soil erodability map of Erer watershed.
Topographic (LS) factor: For this study the range of LS was observed from 0.6 to 4.39 (Figure 7). The highest value of LS was distributed in the steep dissected to mountainous terrain and lowest flat to almost flat terrain area (Figure 7).
Figure 7. Topographic map of Erer watershed.
Crop management (C) factor: The values of C had been found in the range of 0.1 to 0.6 and presented in Figure 8. The highest value of C distributed on the upstream and the lowest value was distributed almost throughout the watershed.
Figure 8. Distribution of C- factor in Erer watershed.
Supportive conservation practice (P) factor: The values of P ranged from 0.6 to 1.0 and the highest value of P was distributed in throughout hilly terrain and steep dissected to mountainous terrain part of the watershed, but the lowest value is distributed in almost to all parts of the waterhed part (Figure 9).
Figure 9. Conservation practice map of Erer watershed.
Assesment of Soil Loss: The annual soil loss rate of the study area was determined using RUSLE by multiplying the respective RUSLE factors (R, K, LS, C and P) values in the raster calculator of ArcGIS10.1. The values of soil loss rate was divided into seven classes using the basic soil loss classification is shown in Table 5. Annual soil loss ranged from 0ton ha-1yr-1 in the plain area of the studied watershed to over 80ton ha-1 yr-1on steep slope and poor vegetation cover part of the watershed. The total soil loss in the study area was found to 7,795,936.31tons per year from total watershed area of 3167.622 km2. The result of the total soil loss of the study areas falls within the range of the findings of in Ethiopia. According to the estimate of , the annual soil loss of the highlands of Ethiopia ranges from 1248 – 23400 million ton per year from 78 million of hectare of pasture, ranges and cultivated fields. Average annual soil loss for the entire of Erer watershed was estimated as 24.61ton ha-1 yr-1.
Table 5. Area distribution of Erer watershed for different intensity of erosion class.

No

Soil loss rates ton/ha/yr.

Severity Class

Area (ha)

Area (%)

1

0 – 10

Low

199533

62.95

2

10-20

Moderate

27550.89

8.76

3

20 – 30

High

20038.74

6.32

4

30 – 45

Very high

20440.21

6.45

5

45 – 60

Sever

11837.52

3.73

6

60 – 80

Very Sever

4294.97

1.35

7

> 80

Extremely sever

33066.86

10.43

Total

316762.2

100.00

Source: Erosion class of (FAO, 1986)
The result of study falls within the range of the findings of and in Ethiopia. Bobe B. estimated soil loss in different districts of East and west Hararghe zone, in the range of 1.74-135 t/ha/yr and the estimated soil losses for the study areas is within the ranges of soil loss estimated for the Ethiopia high lands by Soil Conservation Reaserch Project (SCRP) which ranges from 0-300 t/ha/yr. In this study, the area with a soil loss potential higher than the SLT was 117,229 ha (Table 5) that accounts more than 37 percent from the total Erer watershed.
3.2. Prioritization of Watershed for Soil Conservation Planning
In this study, prioritization of sub-watersheds had been done on the basis of soil loss rate. Estimated values of sub-watershed wise soil loss were classified based on annual Mean value of soil loss.
Figure 10. Sub Watershed.
Table 6. Ranked sub-watershed based on mean soil loss.

Rank (priority)

Sub-watersheds

Area (ha)

Area (%)

Mean (ton/ha/yr.)

1

6

14717.60

4.65

39.81

2

1

15273.20

4.82

38.91

3

2

11302.24

3.57

35.97

4

11

10221.95

3.23

34.53

5

7

14464.10

4.57

34.19

6

3

7289.54

2.30

33.26

7

16

11647.00

3.68

28.20

8

19

15528.00

4.90

27.76

9

18

11899.00

3.76

26.40

10

8

15428.80

4.87

24.47

11

5

12273.00

3.87

23.69

Figure 11. Soil loss intensity map of Erer watershed.
The result showed that, very highsoilloss (39.81t/ha/yr.) was observed in steep dissected to mountainous terrain of the upstream of watershed. Out of the 23 sub-watersheds, only six sub watersheds SW10, SW8, SW9, SW7, and SW3 were existed under very high erosion rate with mean soil loss ranges from 33.25 to 38.92 t/ha/yr. which cover 23 percent of the total landand which the first conservation priority are needed as shown in Tables 5 and 6 and also Figure 11. High contributions from C and P factors on up-stream watershed are the major causes for this problem. High soil loss was estimated in six sub watersheds (11, 9, 10, 5, 8, and 7) which are spatially located at low stream, upstream and middle parts of the watershed with mean soil loss ranges from 20.59 to 28.2t/ha/yr which account for 50 percent of the total land and the second conservation priority are needed. The more contribution of very high and high soil loss have from cultivated and grazing land are due to lack of vegetation cover during crtical period of of rain fall and lack of conservation practice.
Sub watershed that Needs Prior Soil Conservation Measures:
The result showed that, very high soil loss (38.92t/ha/yr.) was observed in steep dissected to mountainous terrain of the upstream of the watershed. Out of the 11 sub-watersheds, six sub watersheds SW10, SW8, SW9, SW7, SW 3 and SW4 were existed under very high erosion rate with mean soil loss ranges from 32.25 to 38.92 t/ha/yr. which need immediate conservation priority.
4. Conclusion
Along the transect line, the existing land use type and the recommended one showed a good correlation. Even so, the research findings showed that the current land use types and SWC measures were deviated from the recommended.
The problem is more serious on land use types other than cultivated land. From the three parts of watershed, relatively better results were obtained on the middle parts of the watershed on arable land use types. In general, even the constructed structures were not managed properly. This implies that the treatments that could shield the area from deterioration are missing. R-factor was computed by using the regression equation developed by .
5. Recommendations
From the field observation, the main causes of gully in the study area were over grazing, poor design of physical SWC structures and deforestation However, most of the check dams are filled with sediment deposition and some of them started to collapse which needs tied ridges and broad bed structures. However, the study indicates that the potential of gullies is huge if more attention is given to technical standards, avoiding of free grazing and maintenance is performed on time.
Most of the hillside terraces on the communal land of very steep slope and bunds have zero height in their upper side due to sediment deposition, so maintenance is needed. As per discussion with the farmers, the main reason for the failure to achieve some of the SWC structures based on the technical standards were knowledge and skill gaps, more attention should be given to technical quality rather than coverage areas supported by contour cultivation, strip cropping, vegetative and rock barriers, broad-based terraces.
Acknowledgments
I would like to thank Oromia Agricultural Research Institute (OARI) for providing all the opportunity and support. I would like to express my deepest gratitude to my Center (FARC) and team members for their support.
Abbreviations

RUSLE

Revised Universal Soil Loss Equation

SW

Sub-watershed

Author Contributions
Frezer Yemane is the sole author. The author read and approved the final manuscript.
Conflicts of Interest
The author declares no conflicts of interest.
References
[1] Bobe B. 2004. Evaluation of soil erosion in Harerge region of Ethiopia using soil loss models, rainfall simulation and field trials. Submitted in partial fulfillment of the requirements for degree Doctor of Philosophy, University of Pretoria. 191 p.
[2] Chandra et al., 2016. Landscape dynamics and soil erosion process modeling in the north wester Ethiopia highlands, African studies series A16, Geographical Bernensisia, Berne.
[3] Durbue, 2015;. 2014. Slope Length and Steepness factors (LS), Chapter 4, pp. 101-141 in Renardet al. 1997.
[4] Eswaran, et al., 2001. Automatic calibration of a distributed catchment model, Journal of Hydrology, vol. 251, no. ½, pp. 103-109.
[5] FAO. 1986. Ethiopia Highlands Reclamation Study. Final Report, Volume 1. FAO, Rome.
[6] FAO. 2006. Guidelines for soil description. Rome.
[7] Hudek et al., 2014; Identification of Conservation Priority Area in Erer Watershed based on Erosion Risk Using RUSLE Model, Eastern Hararghe Zone, Ethiopia. M.Sc. Thesis Presented to the school of Graduate Studies of Haramaya University.
[8] kumar et al., 2012)..“Estimation of Soil Erosion for a Himalayan watershed using GIS technique, ”Water Resource Management, vol. 15, pp. 41–54.
[9] Klute, A. 1965. Laboratory measurements of hydraulic conductivity of saturated soil. P. 253-261. In C. A. Blacket al.(ed) ethods of soil analaysis. Part 1. Agron. Monogr. 9. ASA, Madison, WI.
[10] Lakew Desta (2005). Soil Erosion Studies in Northern Ethiopia. SpringerScienceBusiness Media B. V.
[11] Morgan, 1994. Land Degradation Development, vol. 12, pp. 519-539.
[12] Nyssen, 2001 Automated delineation of drainage netwok and elementary catchments from digital elevation models. ITCJournal ¾, 198- 208.
[13] Renard., (1997) Predicting rainfall erosion losses a guide to conservation planning. Agric. Hand B. No. 537, US Department of Agriculture, Washington, DC.
[14] Tripathi., 2003. Visual Soil Assessment Volume 1 Field guide for cropping and grazing on flat to rolling country. Horizons and Landcare Research. Palmerson, New Zealand. P 84.
[15] Zelalem 2006. Review of Remote Sensing applications to soils and agriculture. Proc. Silver Jubilee Seminar, IIRS, Dehra Dun.
Cite This Article
  • APA Style

    Yemane, F. (2026). Characterization of Soil Erosion Using RUSLE Model and GIS at Erer Watershed Babile District, East Hararghe Zone, Ethiopia. International Journal of Environmental Protection and Policy, 14(1), 18-29. https://doi.org/10.11648/j.ijepp.20261401.12

    Copy | Download

    ACS Style

    Yemane, F. Characterization of Soil Erosion Using RUSLE Model and GIS at Erer Watershed Babile District, East Hararghe Zone, Ethiopia. Int. J. Environ. Prot. Policy 2026, 14(1), 18-29. doi: 10.11648/j.ijepp.20261401.12

    Copy | Download

    AMA Style

    Yemane F. Characterization of Soil Erosion Using RUSLE Model and GIS at Erer Watershed Babile District, East Hararghe Zone, Ethiopia. Int J Environ Prot Policy. 2026;14(1):18-29. doi: 10.11648/j.ijepp.20261401.12

    Copy | Download

  • @article{10.11648/j.ijepp.20261401.12,
      author = {Frezer Yemane},
      title = {Characterization of Soil Erosion Using RUSLE Model and GIS at Erer Watershed Babile District, East Hararghe Zone, Ethiopia},
      journal = {International Journal of Environmental Protection and Policy},
      volume = {14},
      number = {1},
      pages = {18-29},
      doi = {10.11648/j.ijepp.20261401.12},
      url = {https://doi.org/10.11648/j.ijepp.20261401.12},
      eprint = {https://article.sciencepublishinggroup.com/pdf/10.11648.j.ijepp.20261401.12},
      abstract = {Currently the rate of soil erosion is severe in the low lands of Ethiopia. Identification of hot-spot areas of erosion and prioritizing areas of intervention is extremely important for reducing further degradation, reclaiming the degraded areas and improving the land productivity of the watershed. The RUSLE model with GIS environment helps watershed management in assessing and identifying erosion hotspot areas for undertaking required conservation measures. Erer watershed is found in Ethiopian Wabishebele basin. The objective of this study was to Characterize soil erosion and prioritize sub watersheds in Erer watershed in eastern Hararghe. The Revised Universal Soil Loss Equation (RUSLE) integrated with satellite remote sensing and geographical information systems (GIS) as a useful tool for conservation planning was used. Mean annual precipitation, soil map, a 30m digital elevation model, land-cover and management map, land use types and slope length and slope steepness were used to determine the RUSLE values. Homogeneity and consistency test were undertake before each analysis. Homogeneity test for the collected data was homogeneous that the observation was from the same population and the consistency of the rainfall was linear. Mainly the practice of removing plant residues, poor physical soil conservation measures, lack of conservation practice and ploughing the land several times may be the reasons for the high soil loss in the study area. Moreover, the total soil loss in the study area was 7,895,824.22 metric tons per year from 216,762.2ha of land with mean soil loss of 24.61 t/ha/yr. The very high soil loss was observed in steep dissected to mountainous terrain of the upstream of watershed. Out of the 11 SWs, six sub watersheds SW6, SW8, SW9, SW11, SW7 and SW4 were existed under very high erosion rate with mean soil loss ranges from 32.33 to 38.92 t/ha/yr which cover 24 percent of the total land and high soil loss rate was estimated. Soil loss ranges from 21.58 to 27.1 and covers 50 percent of the total land. The watershed has a range of the erosion severity classes of extremely severe, very sever and sever. The steep slope of upstream watershed have contribute high soil loss are more critical and should be given first priority during intervention measures. The poor vegetation cover management and the lack of conservation practice of the area should be improved to reduce the high soil loss throughout of the watershed.},
     year = {2026}
    }
    

    Copy | Download

  • TY  - JOUR
    T1  - Characterization of Soil Erosion Using RUSLE Model and GIS at Erer Watershed Babile District, East Hararghe Zone, Ethiopia
    AU  - Frezer Yemane
    Y1  - 2026/03/14
    PY  - 2026
    N1  - https://doi.org/10.11648/j.ijepp.20261401.12
    DO  - 10.11648/j.ijepp.20261401.12
    T2  - International Journal of Environmental Protection and Policy
    JF  - International Journal of Environmental Protection and Policy
    JO  - International Journal of Environmental Protection and Policy
    SP  - 18
    EP  - 29
    PB  - Science Publishing Group
    SN  - 2330-7536
    UR  - https://doi.org/10.11648/j.ijepp.20261401.12
    AB  - Currently the rate of soil erosion is severe in the low lands of Ethiopia. Identification of hot-spot areas of erosion and prioritizing areas of intervention is extremely important for reducing further degradation, reclaiming the degraded areas and improving the land productivity of the watershed. The RUSLE model with GIS environment helps watershed management in assessing and identifying erosion hotspot areas for undertaking required conservation measures. Erer watershed is found in Ethiopian Wabishebele basin. The objective of this study was to Characterize soil erosion and prioritize sub watersheds in Erer watershed in eastern Hararghe. The Revised Universal Soil Loss Equation (RUSLE) integrated with satellite remote sensing and geographical information systems (GIS) as a useful tool for conservation planning was used. Mean annual precipitation, soil map, a 30m digital elevation model, land-cover and management map, land use types and slope length and slope steepness were used to determine the RUSLE values. Homogeneity and consistency test were undertake before each analysis. Homogeneity test for the collected data was homogeneous that the observation was from the same population and the consistency of the rainfall was linear. Mainly the practice of removing plant residues, poor physical soil conservation measures, lack of conservation practice and ploughing the land several times may be the reasons for the high soil loss in the study area. Moreover, the total soil loss in the study area was 7,895,824.22 metric tons per year from 216,762.2ha of land with mean soil loss of 24.61 t/ha/yr. The very high soil loss was observed in steep dissected to mountainous terrain of the upstream of watershed. Out of the 11 SWs, six sub watersheds SW6, SW8, SW9, SW11, SW7 and SW4 were existed under very high erosion rate with mean soil loss ranges from 32.33 to 38.92 t/ha/yr which cover 24 percent of the total land and high soil loss rate was estimated. Soil loss ranges from 21.58 to 27.1 and covers 50 percent of the total land. The watershed has a range of the erosion severity classes of extremely severe, very sever and sever. The steep slope of upstream watershed have contribute high soil loss are more critical and should be given first priority during intervention measures. The poor vegetation cover management and the lack of conservation practice of the area should be improved to reduce the high soil loss throughout of the watershed.
    VL  - 14
    IS  - 1
    ER  - 

    Copy | Download

Author Information
  • Fedis Agricultural Research Center, Oromia Agricultural Research Institute, Harar, Ethiopia