Research Article | | Peer-Reviewed

Infrared Auto Refractor Based Evaluation of Meibomian Gland Morphology, Its Correlation with Tear Film Parameters in Patients with Dry Eye Disease

Received: 25 March 2026     Accepted: 27 July 2026     Published: 27 August 2026
Views:       Downloads:
Abstract

Background: Dry eye disease (DED) is a prevalent ocular surface disorder causing symptoms of watering, redness of eyes, ocular discomfort, visual disturbance, and signs of congestion, reduced tear meniscus, particulate debris in the tear film, changes in the meibomian gland number and morphology, and increased tear osmolarity. Conventional meibography offers detailed imaging of Meibomian glands but remains costly and unavailable in routine practice. This study evaluated gland morphology using a standard infra red autorefractor with an infra red imaging device and correlated findings with tear-film parameters. Methods: In this cross-sectional study, 106 patients who met the inclusion, exclusion criteria with clinically diagnosed DED were examined at a tertiary care center. Each participant underwent Schirmer’s II test and tear break-up time (TBUT) measurement. Meibomian gland morphology was imaged using the infrared module of the AR-UNIQUE.RK auto-refractometer. Parameters such as acini visibility, main duct exposure, orifice morphology, and lid margin irregularities were graded and correlated with tear-film indices using Spearman’s correlation and non-parametric tests (p < 0.05 significant). Results: Poor or moderate acini visibility (Grades 2–3) was observed in 75.5% of patients, and orifice abnormalities in 68%. Mean Schirmer’s values were 7.7 ± 1.9 mm (RE) and 7.4 ± 1.8 mm (LE), while mean TBUT was 6.4 ± 1.6 s and 6.2 ± 1.5 s, respectively. Acini visibility grade correlated negatively with Schirmer’s (r = –0.42, p < 0.001) and TBUT (r = –0.39, p = 0.002). Increased morphological severity was significantly associated with reduced tear-film stability (p < 0.001). Conclusion: Infrared imaging using an auto refractometer effectively identified Meibomian gland abnormalities correlating with functional tear film deficits. This approach provides a practical, low cost alternative for early detection of Meibomian gland dysfunction in resource limited ophthalmic settings.

Published in International Journal of Ophthalmology & Visual Science (Volume 11, Issue 3)
DOI 10.11648/j.ijovs.20261103.12
Page(s) 35-43
Creative Commons

This is an Open Access article, distributed under the terms of the Creative Commons Attribution 4.0 International License (http://creativecommons.org/licenses/by/4.0/), which permits unrestricted use, distribution and reproduction in any medium or format, provided the original work is properly cited.

Copyright

Copyright © The Author(s), 2026. Published by Science Publishing Group

Keywords

Dry Eye Disease, Meibomian Gland Dysfunction, Infra Red Auto Refractor Imaging, Tear Break-Up Time, Schirmer’s Test

1. Introduction
Dry eye disease (DED) is a multifactorial ocular surface disorder characterized by tear film instability, ocular inflammation and neurosensory abnormalities . Recent systematic reviews suggest it affects an estimated 11.6% of the global population, with regional variation from 42% in Africa to 20.1% in Asia . Among Asian populations the prevalence is even higher; a 2025 database analysis reported 23.9% DED prevalence, rising from 16.2% in people under 30 years to 26.7% in those over 70 years, with women affected more frequently than men (28.1% vs 20.1%) and a notable uptrend from 2016–2022 . The economic burden is substantial; a study estimated DED management costs in the United States at approximately US$5.5 billion annually . Indian data are sparse but concerning. A 2023 hospital based study using DEWS II criteria found 29.5% prevalence, with evaporative and aqueous deficient subtypes contributing almost equally. Risk factors included older age, female gender, urban residence, diabetes, smoking, cataract surgery and increased use of video display terminals . These figures highlight a common disease that is rising in parallel with digital device use and aging population. Dry Eye Disease significantly diminishes quality of life. In a 2024 cross sectional survey of Thai medical students, 60.4% reported DED symptoms, and those affected had significantly worse scores on the Dry Eye related Quality of life Score (DEQS) and the EQ 5D 5L utility index; they also reported more mental health issues, indicating that DED compromises daily functioning, and psychological well being . Another study of Saudi adults emphasised that DED causes ocular discomfort, unstable tear film and visual disturbances; severe disease may lead to corneal ulceration and scarring . It further noted that environmental factors such as air pollution, digital screens and contact lens use increase the risk of DED. DED symptoms reduce work productivity and are associated with psychological stress, anxiety and depression. Together these findings underscore the broad societal impact of DED and the importance of timely diagnosis and management . A normal tear film typically has low osmolarity levels and little variability between different measurements. Values above 308 mosmol/ L or a difference of 8 mosmol/L between the two eyes are good indicators of a tear film osmolarity disorder. .
Management is tailored to disease severity. First line therapy involves artificial tear drops and lubricating ointments, while punctal occlusion (temporary or permanent) and scleral contact lenses help retain tears. Tear stimulating medications such as Pilocarpine, omega 3 fatty acids may be recommended, and surgery is considered for eyelid mal positions. Self care measures include avoiding environmental triggers, using humidifiers, warm compresses and taking frequent breaks from screens . Despite these options, many patients do not achieve sustained relief. Conventional meibo graphy systems that could guide targeted therapy are costly and not widely available yet. This creates a clear need gap, although DED is common and treatment requires understanding of meibo mian gland health, routine assessment of gland morphology is rarely performed outside specialized clinics due to lack of accessibility to equipment, high equipment cost, and training requirements.
To address this gap, this study uses a standard auto refractor, ubiquitous in ophthalmic practice to capture infrared images of the meibo mian glands. By correlating morphological grading of the meibo mian glands with functional tear tests, we aim to provide a low cost, accessible method for early detection of meibo mian gland dysfunction, thereby improving screening and enabling timely interventions.
2. Materials and Methods
2.1. Study Design and Setting
This study was designed as a hospital based, comparative cross-sectional investigation conducted at the Department of Ophthalmology, Vydehi Institute of Medical Sciences and Research Centre (VIMS & RC), Bengaluru. The primary objective was to evaluate Meibo mian gland morphology in patients with dry eye disease using autorefractor based infrared imaging and to correlate morphological alterations in the meibomian glands with tear film parameters. The study adhered to the tenets of the Declaration of Helsinki and was approved by the Institutional Ethics Committee of VIMS & RC. All participants provided written informed consent before enrollment.
2.2. Study Duration and Population
The study was carried out over an 18 month period from June 2023 to December 2024. Patients attending the outpatient ophthalmology department with symptoms suggestive of dry eye were screened for eligibility. A total of 106 participants aged between 18 and 70 years, fulfilling the inclusion criteria, were enrolled consecutively. The inclusion criteria comprised individuals diagnosed with dry eye based on a Mc Monnies’ questionnaire score≥20, Schirmer’s 2 test value ≤15 mm in at least one eye, and tear break up time (TBUT) ≤10 seconds. Participants were required to have a minimum daily video display terminal (VDT) exposure of two hours continuously to ensure adequate environmental stress relevance. Patients with active ocular infection, ocular surgery within the past six months, chronic topical medication use, contact lens wear, eyelid malposition, or ocular surface inflammatory disorders were excluded from the study.
2.3. Clinical Assessment
After obtaining informed consent, each participant underwent a comprehensive ophthalmic evaluation, including best corrected visual acuity, slit lamp examination, and fundus evaluation. The Mc Monnies’ Dry Eye Questionnaire was administered to quantify subjective symptoms such as ocular discomfort, burning sensation, and photo phobia. The tear film was assessed using the Schirmer’s II test and TBUT, which served as the primary functional indices of dry eye severity. For the Schirmer’s II test, topical anesthesia (0.5% pro paracaine) eye drops were instilled, and standardized filter paper strips (Whatman No. 41) were placed in the lower fornix of each eye for five minutes. The wetting length was measured in millimeters from the folded end. TBUT was evaluated by a drop of 2% sodium fluorescein dye into the inferior conjunctival sac. Under cobalt-blue illumination, the time interval between a complete blink and the first appearance of a dry spot on the cornea was recorded in seconds, with three readings averaged for analysis.
2.4. Infrared Autorefractor Based Meibomian Gland Imaging
Infrared imaging of the Meibo mian glands was performed using the AR-UNIQUE. RK auto refractor, equipped with an inbuilt anterior-segment imaging module. After the clinical assessments, participants were seated comfortably with the chin and forehead stabilized. The upper eyelid was gently everted, and three sequential high-resolution infrared images of the tarsal plate were captured for each eye under standardized ambient lighting.
The procedure was quick, non-invasive, and well tolerated, requiring approximately two minutes per eye.
Each image was evaluated for the following morphological parameters: number and visibility of acini, main duct exposure, orifice characteristics, lid margin morphology, presence of concretions, and evidence of chalazion. Acini visibility was graded on a three-point scale, where grade 1 denoted clear visualization of clustered acini, grade 2 represented partial visualization (yellowish stripe appearance), and grade 3 indicated poor or absent visibility. Three point grading of acini visibilty is established as “ meiboscore “by Arita et al, in normals 0-6 in one eye, 3 for each eyelid based on meibomian gland dropout. Main duct exposure was categorized as <1 mm, 1–2 mm, or >2 mm based on the visible ductal length. Orifice abnormalities, including capping, pouting, or obliteration, were noted along with associated lid margin thickening, rounding, or telangiectatic changes. The presence and depth of glandular concretions were classified as deep, sub epithelial, or extruding.
2.5. Data Acquisition and Quality Control
All demographic and clinical data were entered into a pre-validated Microsoft Excel sheet on the same day of examination. Of the three images captured per eye, the clearest image with optimal focus and contrast was selected for grading. Two independent, masked ophthalmologists graded all morphological parameters to minimize observer bias. In cases of inter observer disagreement exceeding one grade point, consensus was achieved through joint review by a senior faculty member. Calibration meetings and intra observer repeatability checks were conducted periodically to ensure consistency across evaluations.
2.6. Statistical Analysis
Data were analyzed using Statistical Package for the Social Sciences (SPSS) version 22. Continuous variables, including Schirmer’s 2 test and TBUT values were expressed as mean ± standard deviation (SD), while categorical data such as acini visibility, duct exposure, orifice type, and lid margin abnormality were expressed as frequencies and percentages. Normality of continuous data was verified using the Shapiro–Wilk test. Correlations between morphological parameters and tear film metrics were analyzed using Spearman’s rank correlation coefficient. Comparative analyses of Schirmer’s and TBUT values across morphological grades and demographic variables were performed using the Kruskal–Wallis and Mann–Whitney U tests as appropriate. A two-tailed p-value <0.05 was considered statistically significant.
3. Results
Demographic and Clinical Profile
A total of 106 patients with dry eye disease were evaluated, comprising 55 females (51.9%) and 51 males (48.1%), indicating a near-equal gender representation. The older adult group (≥50 years) accounted for the highest proportion (45.3%) and demonstrated a higher frequency of Meibomian gland dysfunction (p = 0.021). Chalazia were observed in 14.2% of participants, and its presence was associated with significantly lower Schirmer’s and TBUT values (p = 0.032). Over half of the subjects (54.7%) had Meibomian gland concretions, predominantly sub epithelial (22.6%), followed by deep (20.8%) and extruding (11.3%) types (Table 1).
Table 1. Demographic and Clinical Characteristics of the Study Population (n = 106).

Parameter

Category

Frequency (n)

Percentage (%)

p-value

Gender

Male

51

48.1

Female

55

51.9

Age Group (years)

18–30

21

19.8

31–50

37

34.9

>50

48

45.3

0.021*

Presence of Chalazion

Yes

15

14.2

0.032*

No

91

85.8

Concretion Type

Deep

22

20.8

Subepithelial

24

22.6

Extruding

12

11.3

Significant at p < 0.05
Morphological Features of Meibomian Glands
Infra red based auto refactor imaging revealed that acini visibility was moderate to poor (Grades 2–3) in 75.5% of participants, reflecting advanced gland dysfunction. Main duct exposure <1 mm was noted in 34.9% of eyes and was associated with lower tear-film stability (p = 0.018). Abnormal orifice morphology—particularly capping and pouting—was seen in a majority of eyes (68%), while lid margin irregularities were present in 47% (Table 2).
Table 2. Distribution of Meibomian Gland Morphological Parameters.

Parameter

Category

Frequency (n)

Percentage (%)

p-value

Acini Visibility

Grade 1 (clear)

26

24.5

Grade 2 (moderate)

48

45.3

Grade 3 (poor)

32

30.2

0.014*

Main Duct Exposure

<1 mm

37

34.9

0.018*

1–2 mm

38

35.8

>2 mm

31

29.2

Orifice Abnormalities

Capping/Pouting

72

68.0

Obliteration

19

17.9

Lid Margin Abnormality

Present

50

47.2

Significant at p < 0.05
Tear Film Parameters
The mean Schirmer’s test value was 7.70 ± 1.9 mm (right eye) and 7.42 ± 1.8 mm (left eye), while the mean TBUT was 6.43 ± 1.6 s (right) and 6.19 ± 1.5 s (left), indicating global tear film instability in the study group. No significant inter eye difference was observed (p > 0.05) (Table 3).
Table 3. Descriptive Statistics of Tear Film Function Tests.

Parameter

Right Eye (Mean ± SD)

Left Eye (Mean ± SD)

p-value

Schirmer’s Test (mm)

7.70 ± 1.9

7.42 ± 1.8

0.287

TBUT (seconds)

6.43 ± 1.6

6.19 ± 1.5

0.334

Correlation Between Morphological and Functional Parameters
Spearman’s correlation analysis demonstrated a strong positive correlation between the number of Meibomian glands and both Schirmer’s (r = 0.46, p < 0.001) and TBUT (r = 0.42, p < 0.001). In contrast, acini visibility grade correlated negatively with Schirmer’s (r = –0.42, p < 0.001) and TBUT (r = –0.39, p = 0.002), signifying that poorer gland visibility corresponded to reduced tear film stability (Table 4).
Table 4. Spearman’s Correlation Between Meibomian Gland Morphology and Tear Film Parameters.

Morphological Variable

Schirmer’s Test (r, p)

TBUT (r, p)

Interpretation

Number of Glands

0.46, <0.001*

0.42, <0.001*

Positive correlation

Acini Visibility Grade

–0.42, <0.001*

–0.39, 0.002*

Negative correlation

Table 5. One way ANOVA.
Descriptives: Age in Years and Number of glands Both eyes

Age group

N

Mean

Std. Deviation

Std. Error

95% Confidence Interval for Mean

Minimum

Maximum

Lower Bound

Upper Bound

<40

37

19.919

2.8223

.4640

18.978

20.860

15.0

28.0

41-50

21

16.381

2.4995

.5454

15.243

17.519

13.0

23.0

51-60

23

12.304

1.2223

.2549

11.776

12.833

10.0

14.0

>60

25

9.400

1.1547

.2309

8.923

9.877

7.0

12.0

Total

106

15.085

4.7432

.4607

14.171

15.998

7.0

28.0

Table 6. ANOVA.
Number of glands Both Eyes

Sum of Squares

df

Mean Square

F

P value

Between Groups

1885.657

3

628.552

134.526

.000*

Within Groups

476.579

102

4.672

Total

2362.236

105

One-way ANOVA showed a statistically significant difference in the mean number of glands across different age groups (F = 134.526, p < 0.001).
The mean number of glands decreased progressively with increasing age, with the highest mean observed in individuals aged <40 years (19.92) and the lowest in those aged >60 years (9.40).
This indicates a strong negative association between age and gland count.
1) Group-Wise Comparisons
On comparing tear-film indices across demographic and clinical groups, older adults and females exhibited lower Schirmer’s and TBUT values, though gender difference was not statistically significant (p = 0.083). However, participants with chalazia and concretions demonstrated markedly reduced values (p = 0.032 and p = 0.041, respectively). These findings underscore the relationship between secondary lid pathology and functional tear deficiency (Tables 5, 6, 7).
Table 7. Comparison of Tear Film Parameters Across Demographic and Clinical Groups.

Group

Schirmer’s (Mean ± SD mm)

TBUT (Mean ± SD s)

p-value

Age ≤50 yrs

8.15 ± 1.7

6.78 ± 1.4

Age > 50 yrs

7.06 ± 1.8

5.89 ± 1.3

0.021*

Male

7.83 ± 1.8

6.41 ± 1.4

Female

7.58 ± 1.9

6.22 ± 1.5

0.083

Chalazion present

6.92 ± 1.6

5.74 ± 1.2

0.032*

Concretion present

7.01 ± 1.7

5.98 ± 1.4

0.041*

Significant at p < 0.05
Association Between Morphological Severity and Tear Film Dysfunction
Kruskal Wallis tests demonstrated that increasing morphological severity, particularly poor acini visibility and orifice obliteration was significantly associated with decreasing Schirmer’s and TBUT scores (p < 0.001). Participants with Grade 3 acini visibility had mean Schirmer’s of 6.5 mm and TBUT of 5.3 s, whereas those with Grade 1 acini visibility showed 8.4 mm and 7.6 s, respectively (Table 8).
Table 8. Association of Morphological Severity Grades With Schirmer’s and TBUT Values.

Morphological Grade

Schirmer’s (Mean ± SD mm)

TBUT (Mean ± SD s)

p-value (Kruskal–Wallis)

Acini Grade 1

8.42 ± 1.5

7.63 ± 1.2

Acini Grade 2

7.42 ± 1.7

6.28 ± 1.3

Acini Grade 3

6.51 ± 1.6

5.32 ± 1.1

<0.001*

Orifice Normal

8.19 ± 1.8

7.22 ± 1.4

Orifice Abnormal

7.01 ± 1.7

5.94 ± 1.2

0.002*

Significant at p < 0.05
4. Discussion
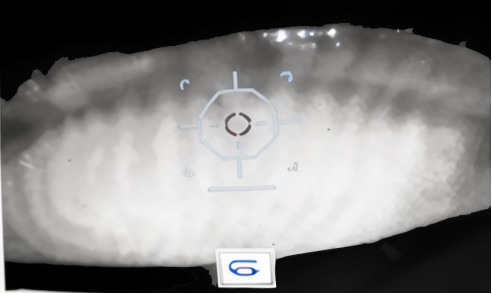
This cross sectional study used a readily available auto refractor to obtain infrared images of the Meibomian glands in patients with DED. The rationale was to identify a low cost, point of care alternative to specialized meibo graphy systems for evaluating gland morphology. The study systematically graded acini visibility, duct exposure and orifice integrity, then correlated these structural grades with Schirmer’s test and tear break up time (TBUT). Unlike most meibography studies, which rely on dedicated instruments, our approach leveraged an instrument already present in general ophthalmic practice;
This responds to the recognised need to broaden access to meibography while avoiding the high costs and lengthy image acquisition times reported for non contact infrared, in vivo confocal or optical coherence tomography meibo graphy . By combining structural assessment with functional tear tests, the study aimed to clarify whether observable gland changes translate into clinically relevant tear film deficits.
Figure 1. Meibomian gland - normal length and normal number of acini.
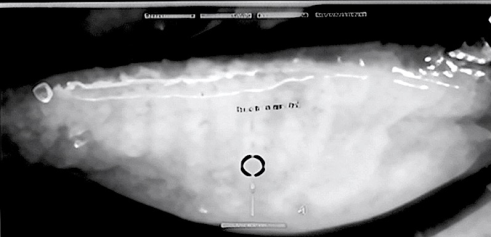
Figure 2. Meibomian glands, shortened, tortutous, kinked glands with few acini.
Demographically, the study population was predominantly middle aged and older adults, with approximately half aged ≥50 years and a near equal gender distribution. We found that older participants exhibited more frequent orifice abnormalities, poor acini visibility and chalazia. These trends mirror population based findings: a cross sectional study of 236 healthy individuals using non contact infrared meibography reported that gland dropout increases with age and is significantly more pronounced in people over 50 years . The same study noted that dropout and severely shortened glands were associated with lower non invasive tear break up times (NIBUT), indicating that age related structural loss compromises tear film stability. Systemic conditions also influence morphology; patients with diabetes mellitus and non proliferative diabetic retino pathy showed higher meibo scores and gland dropout (45% vs. 39%) than non diabetic controls, yet there were no significant differences in TBUT or Schirmer scores . Likewise, a non invasive ocular surface analysis in adults with type 1 diabetes mellitus reported significantly lower Schirmer’s values and TBUT compared with controls (p < 0.001), and HbA1c levels correlated directly with lower eyelid Meibo mian gland loss (r = 0.396, p < 0.001) . These external data support our observation that older age and systemic disease predispose to structural Meibo mian gland abnormalities, although the functional impact can vary.
Our primary endpoint was the association between gland morphology and tear film parameters. In our cohort, poor acini visibility and orifice obstruction correlated negatively with Schirmer’s and TBUT, whereas the number of intact glands correlated positively. These findings align with evidence that structural changes translate into functional impairment. For example, an in vivo con-focal microscopy study comparing patients with liquid versus solid meibum showed that non invasive TBUT was significantly shorter in the solid meibum group (6.73 ± 3.69 s) than in those with liquid meibum (9.3 ± 4.83 s), with overall differences across groups reaching statistical significance (F = 11.87, p < 0.001) . In the same study, patients with solid meibum had keratinized, deformed orifices and dilated ducts, whereas patients with liquid meibum retained round or oval openings. These microscopic changes mirror our macroscopic grading of poor acini visibility and orifice obliteration, suggesting that structural deterioration impedes lipid secretion and destabilizes the tear film. Conversely, some studies have reported weak or absent correlations; in diabetic patients, gland dropout did not correlate with TBUT, implying that structural loss may precede detectable functional deficits . Nevertheless, the overall pattern across multiple datasets including ours and a Lipi Scan based study where morphological imaging identified early MGD more sensitively than Schirmer’s (and showed strong agreement with TBUT) supports the view that morphological assessments are clinically meaningful and can flag sub clinical dysfunction.
The clinical implications of our findings are two fold. First, integrating infrared auto refractor based meibography into routine dry eye evaluations could enable early identification of patients at risk of evaporative DED without the expense or complexity of dedicated meibography systems. Second, the strong associations we observed between acinar dropout, duct exposure and functional tear metrics, underscore the potential for morphological grading to guide targeted therapies such as gland expression, lid hygiene, or anti inflammatory treatments.
However, several limitations must be acknowledged. This study as a hospital based cross sectional study, cannot infer causality or track the progression of structural changes; our sample size was modest and drawn from a single centre, which may limit generalization. The resolution of images is not comparable to those obtained from costlier meibography machines, but serves as an estimate of the meibomian glands which would otherwise be invisible to the naked eye. The study also did not assess meibum quality or lipid layer thickness, variables that have been shown to influence the relationship between gland morphology and tear film stability . The LipiView II Ocular Surface Interferometer (manufactured by Johnson & Johnson Vision/Tear Science) is a specialized ophthalmic imaging device used primarily to evaluate the tear film and meibomian glands. It measures Lipid Layer Thickness (LLT) Blink Dynamics, Dynamic Meibomian Imaging (DMI): It uses near-infrared (NIR) illumination to image the meibo mian gland structure in high definition, allowing for the accurate assessment of gland atrophy or dropout. Another such device is the OCULUS Keratograph 5M is a high-resolution corneal topographer with a built-in keratometer and specialized software for dry eye analysis Our not for profit department is yet to acquire these specialised instruments. Hence modern tests such as noninvasive tear film beak up time, tear film os molarity, tear meniscometry, lipid metrics were not possible.
Future multi centre longitudinal studies incorporating quantitative lipid metrics and systemic risk factors, larger sample size and age, gender matched controls are needed to determine whether infrared auto refractor based imaging of the eyelids can reliably monitor meibomian gland disease progression and response to treatment.
5. Conclusion
Infrared auto refractor imaging effectively detects morphological alterations of the Meibomian glands that correlate with tear film instability. This low cost, rapid technique can supplement conventional diagnostic modalities and facilitate early identification of Meibomian gland dysfunction, access to ocular surface evaluation, thus improving dry eye management in routine ophthalmic practice.
Abbreviations

cAMP

Cyclic Adenosine Mono Phospshate

AADE

Aqueous Deficient Dry Eyeo

AI

Artificial Intelligence

ARK

Auto Refracto Keratometer

DED

Dry Eye Disease

DEQS

Dry Eye–Related Quality of Life Score

DESL

Dry Eye Severity Scale

dF

Degree of Freedom

F

Ratio of Variance Within Group/ Variance Between Groups

EDE

Evaporative Dry Eye

IPL

Intense Pulsed Light

IR

Infra Red

IVCM

In Vivo Confocal Microscopy

MGD

Meibomian Gland Disease

MG

Meibomian Gland

NITBUT

Non Invasive Break up Time

OCT

Optical Coherence Tomography

OSAS

Obstructive Sleep Apnea Syndrome

OSDI

Ocular Surface Disease Index

SD

Standard Deviation

SIT

Schirmer 2 Test

SPSS

Statistical Package fo the Social Science

TBUT

Tear Break up Time

VDT

Video Display Terminals

Acknowledgments
Mrs Chaitra K, Masters in Bio statistics, Lecturer &Statistician, Department of Community Medicine, Vydehi Institute of Medical Sciences and Research Centre, Bengaluru.
Faculty & postgraduates, Department of Ophthalmology, Vydehi Institute of Medical Sciences and Research Centre, Bengaluru.
Author Contributions
Pratyusha : Data curation, Formal Analysis, Investigation, Project administration, Writing – original draft
Vittal Irvathur Nayak: Conceptualisation, Methodology, Validation, Supervision, Writing – review & editing
Meghana Kotesh: Data curation, Supervision, Validation
Mohan Salavadi: Data Curation, Supervision Validation
Alhaj Farhath Tasneem Sattar: Supervision, Validation, Writing – review & editing
Seema Channabasappa: Supervision, Writing – review & editing
Conflicts of Interest
The authors declare no conflict of interest.
References
[1] Leonardi A, Di Zazzo A, Cutrupi F, Iaccarino L (2025) Dry eye and systemic diseases. Saudi Journal of Ophthalmology 39: 5–13.
[2] Clayton JA (2018) Dry Eye. N Engl J Med 378: 2212–2223.
[3] Cai Y, Wei J, Zhou J, Zou W (2022) Prevalence and Incidence of Dry Eye Disease in Asia: A Systematic Review and Meta-Analysis. Ophthalmic Res 65: 647–658.
[4] Zhang H, Yang K, Yang W, et al (2025) Epidemiological Characteristics of Dry Eye Disease in Asian and Asian Female Populations: A Database-Driven Descriptive Study. J Curr Ophthalmol 36: 159.
[5] Mohamed Z, Alrasheed S, Abdu M, Allinjawi K (2024) Dry Eye Disease Prevalence and Associated Risk Factors Among the Middle East Population: A Systematic Review and Meta-Analysis. Cureus 16: e70522.
[6] Britten-Jones AC, Wang MTM, Samuels I, et al (2024) Epidemiology and Risk Factors of Dry Eye Disease: Considerations for Clinical Management. Medicina 2024, Vol 60, Page 1458 60: 1458.
[7] Yu J, Asche C V., Fairchild CJ (2011) The economic burden of dry eye disease in the United States: a decision tree analysis. Cornea 30: 379–387.
[8] Bhatt K, Singh S, Singh K, et al (2023) Prevalence of dry eye, its categorization (Dry Eye Workshop II), and pathological correlation: A tertiary care study. Indian J Ophthalmol 71: 1454.
[9] Kunboon A, Tananuvat N, Upaphong P, et al (2024) Prevalence of dry eye disease symptoms, associated factors and impact on quality of life among medical students during the pandemic. Scientific Reports. 2024. 14: 1–9.
[10] Jareebi MA, Akkur AA, Otayf DAH, et al (2025) Exploring the Prevalence of Dry Eye Disease and Its Impact on Quality of Life in Saudi Adults: A Cross-Sectional Investigation. Medicina 2025, Vol 61, Page 976 61: 976.
[11] Wu M, Sun C, Shi Q, et al (2024) Dry eye disease caused by viral infection: Past, present and future. Virulence 15.
[12] Zemaitiene R, Gorgadze G, Mockaitiene L (2025) Ocular Surface Changes Associated with Neurological Diseases. Medicina 2025, 61: 1693.
[13] Bron A J Tomlinson A, Foulks G N, Pepose J S, Baudouin C, Geerling G et al Rethinking dry eye diease: a perspecctive on clinical implications. Ocl Surf. 2014; 12(2 Suppl): S1-31.
[14] Dry Eyes: Types, Symptoms, Causes & Treatment.
[15] Arita R, Suehiro J, Haraguci T, Shirakawa R, Tokoro H, Amano S. Objective image analysis of the eibomiamn gland area, Br J Ophthalml 2013. Jun: (98) 6, 746-755.
[16] Gupta PK, Karpecki P (2024) Comprehensive Assessment of the Meibomian Glands by Meibography: Why the Upper Eyelids Matter. Cornea 44: 128.
[17] Srivastav S, Hasnat Ali M, Basu S, Singh S (2023) Morphologic variants of Meibomian glands: age-wise distribution and differences between upper and lower eyelids. Front Med (Lausanne) 10: 1195568.
[18] Mohamed-Noriega K, González-Arocha CS, Morales-Wong F, et al (2024) Meibomian Gland Dysfunction and Dropout in Diabetic Patients with Non-Proliferative Diabetic Retinopathy. Bioengineering 2024, Vol 11, 11: 907.
[19] Silva-Viguera MC, Pérez-Barea A, Bautista-Llamas MJ (2022) Tear film layers and meibomian gland assessment in patients with type 1 diabetes mellitus using a noninvasive ocular surface analyzer: a cross-sectional case–control study. Graefe’s Archive for Clinical and Experimental Ophthalmology 261: 1483.
[20] Zheng Q, Xue Y, Zhong X, et al (2022) Correlation Study Between Abnormal Morphology of Meibomian Glands and Meibum in Patients With Dry Eye Disease Under in vivo Confocal Microscopy. Front Med (Lausanne) 8: 793338.
[21] Shehzad D, Gorcuyeva S, Dag T, Bozkurt B (2019) Novel Application Software for the Semi-Automated Analysis of Infrared Meibography Images. Cornea 38: 1456–1464.
[22] OCULUS Keratograph, Lipview II
Cite This Article
  • APA Style

    Pratyusha, Nayak, V. I., Kotesh, M., Salavadi, M., Sattar, A. F. T., et al. (2026). Infrared Auto Refractor Based Evaluation of Meibomian Gland Morphology, Its Correlation with Tear Film Parameters in Patients with Dry Eye Disease. International Journal of Ophthalmology & Visual Science, 11(3), 35-43. https://doi.org/10.11648/j.ijovs.20261103.12

    Copy | Download

    ACS Style

    Pratyusha; Nayak, V. I.; Kotesh, M.; Salavadi, M.; Sattar, A. F. T., et al. Infrared Auto Refractor Based Evaluation of Meibomian Gland Morphology, Its Correlation with Tear Film Parameters in Patients with Dry Eye Disease. Int. J. Ophthalmol. Vis. Sci. 2026, 11(3), 35-43. doi: 10.11648/j.ijovs.20261103.12

    Copy | Download

    AMA Style

    Pratyusha, Nayak VI, Kotesh M, Salavadi M, Sattar AFT, et al. Infrared Auto Refractor Based Evaluation of Meibomian Gland Morphology, Its Correlation with Tear Film Parameters in Patients with Dry Eye Disease. Int J Ophthalmol Vis Sci. 2026;11(3):35-43. doi: 10.11648/j.ijovs.20261103.12

    Copy | Download

  • @article{10.11648/j.ijovs.20261103.12,
      author = {Pratyusha and Vittal Irvathur Nayak and Meghana Kotesh and Mohan Salavadi and Alhaj Farhath Tasneem Sattar and Seema Channabasappa},
      title = {Infrared Auto Refractor Based Evaluation of Meibomian Gland Morphology, Its Correlation with Tear Film Parameters in Patients with Dry Eye Disease},
      journal = {International Journal of Ophthalmology & Visual Science},
      volume = {11},
      number = {3},
      pages = {35-43},
      doi = {10.11648/j.ijovs.20261103.12},
      url = {https://doi.org/10.11648/j.ijovs.20261103.12},
      eprint = {https://article.sciencepublishinggroup.com/pdf/10.11648.j.ijovs.20261103.12},
      abstract = {Background: Dry eye disease (DED) is a prevalent ocular surface disorder causing symptoms of watering, redness of eyes, ocular discomfort, visual disturbance, and signs of congestion, reduced tear meniscus, particulate debris in the tear film, changes in the meibomian gland number and morphology, and increased tear osmolarity. Conventional meibography offers detailed imaging of Meibomian glands but remains costly and unavailable in routine practice. This study evaluated gland morphology using a standard infra red autorefractor with an infra red imaging device and correlated findings with tear-film parameters. Methods: In this cross-sectional study, 106 patients who met the inclusion, exclusion criteria with clinically diagnosed DED were examined at a tertiary care center. Each participant underwent Schirmer’s II test and tear break-up time (TBUT) measurement. Meibomian gland morphology was imaged using the infrared module of the AR-UNIQUE.RK auto-refractometer. Parameters such as acini visibility, main duct exposure, orifice morphology, and lid margin irregularities were graded and correlated with tear-film indices using Spearman’s correlation and non-parametric tests (p Results: Poor or moderate acini visibility (Grades 2–3) was observed in 75.5% of patients, and orifice abnormalities in 68%. Mean Schirmer’s values were 7.7 ± 1.9 mm (RE) and 7.4 ± 1.8 mm (LE), while mean TBUT was 6.4 ± 1.6 s and 6.2 ± 1.5 s, respectively. Acini visibility grade correlated negatively with Schirmer’s (r = –0.42, p Conclusion: Infrared imaging using an auto refractometer effectively identified Meibomian gland abnormalities correlating with functional tear film deficits. This approach provides a practical, low cost alternative for early detection of Meibomian gland dysfunction in resource limited ophthalmic settings.},
     year = {2026}
    }
    

    Copy | Download

  • TY  - JOUR
    T1  - Infrared Auto Refractor Based Evaluation of Meibomian Gland Morphology, Its Correlation with Tear Film Parameters in Patients with Dry Eye Disease
    AU  - Pratyusha
    AU  - Vittal Irvathur Nayak
    AU  - Meghana Kotesh
    AU  - Mohan Salavadi
    AU  - Alhaj Farhath Tasneem Sattar
    AU  - Seema Channabasappa
    Y1  - 2026/08/27
    PY  - 2026
    N1  - https://doi.org/10.11648/j.ijovs.20261103.12
    DO  - 10.11648/j.ijovs.20261103.12
    T2  - International Journal of Ophthalmology & Visual Science
    JF  - International Journal of Ophthalmology & Visual Science
    JO  - International Journal of Ophthalmology & Visual Science
    SP  - 35
    EP  - 43
    PB  - Science Publishing Group
    SN  - 2637-3858
    UR  - https://doi.org/10.11648/j.ijovs.20261103.12
    AB  - Background: Dry eye disease (DED) is a prevalent ocular surface disorder causing symptoms of watering, redness of eyes, ocular discomfort, visual disturbance, and signs of congestion, reduced tear meniscus, particulate debris in the tear film, changes in the meibomian gland number and morphology, and increased tear osmolarity. Conventional meibography offers detailed imaging of Meibomian glands but remains costly and unavailable in routine practice. This study evaluated gland morphology using a standard infra red autorefractor with an infra red imaging device and correlated findings with tear-film parameters. Methods: In this cross-sectional study, 106 patients who met the inclusion, exclusion criteria with clinically diagnosed DED were examined at a tertiary care center. Each participant underwent Schirmer’s II test and tear break-up time (TBUT) measurement. Meibomian gland morphology was imaged using the infrared module of the AR-UNIQUE.RK auto-refractometer. Parameters such as acini visibility, main duct exposure, orifice morphology, and lid margin irregularities were graded and correlated with tear-film indices using Spearman’s correlation and non-parametric tests (p Results: Poor or moderate acini visibility (Grades 2–3) was observed in 75.5% of patients, and orifice abnormalities in 68%. Mean Schirmer’s values were 7.7 ± 1.9 mm (RE) and 7.4 ± 1.8 mm (LE), while mean TBUT was 6.4 ± 1.6 s and 6.2 ± 1.5 s, respectively. Acini visibility grade correlated negatively with Schirmer’s (r = –0.42, p Conclusion: Infrared imaging using an auto refractometer effectively identified Meibomian gland abnormalities correlating with functional tear film deficits. This approach provides a practical, low cost alternative for early detection of Meibomian gland dysfunction in resource limited ophthalmic settings.
    VL  - 11
    IS  - 3
    ER  - 

    Copy | Download

Author Information