1. Introduction
1.1. Background of the Study
Climate change is on the rise, from extraordinary wildfires to the unexpected warmth of Siberia, the impact of climate change was experienced in each area of the globe. Climate change is scarier than ever; according to the BBC, "CO
2 in the atmosphere reached record levels in 2020, the year 2020 was more than 1.2 Celsius hotter than the average year in the 19
th century
| [1] | Pye, S., Li, F. G., Price, J., & Fais, B. (2017). Achieving net-zero emissions through the reframing of UK national targets in the post-Paris Agreement era. Nature energy, 2(3), 1-7. https://doi.org/10.1038/nenergy.2017.24 |
[1]
. Increase in heat more keenly felt that in the Arctic. Across the northern hemisphere, permafrost is warming rapidly", considering its huge Implications and impacts that needs to be tackled by economic agents from across the world, I will investigate how United Kingdom is trying to reduce and control the great oppression. Climate change in the UK has led to serious problems over the years on the environment and people, comprising of storms, floods, sea-level rise and the spell of unbearable heatwave
| [2] | Shahzad, S., Faheem, M., Muqeet, H. A., & Waseem, M. (2024). Charting the UK's path to net zero emissions by 2050: Challenges, strategies, and future directions. IET Smart Grid. 7(6), 716-736. https://doi.org/10.1049/stg2.12185 |
[2]
.
Despite the implications and the serious effect of climate change, the United Kingdom offset into the right path to reduce the super wicked. The UK has been the global leader in reducing emissions from its 1990 level; however, the country has faced immense challenges in complying with its net-zero commitment or policy to be achieved by 2030
. In its attempt to achieve net zero goals, the United Kingdom amended the 2008 Climate Change Act's policy a few years ago in 2019 to provide specific guidelines around energy efficiency. The Act also mandates the government to publicize a climate change risk assessment in five years and create a National Adaptation Plan to address the risk assessment
| [4] | Shahbaz, M., Nasir, M. A., Hille, E., & Mahalik, M. K. (2020). UK's net-zero carbon emissions target: Investigating the potential role of economic growth, financial development, and R&D expenditures based on historical data (1870–2017). Technological Forecasting and Social Change, 161, 120255. https://doi.org/10.1016/j.techfore.2020.120255 |
[4]
. The 2019 policy involves United Kingdom to convey all emissions to net-zero by 2050. The policy delivers a structure of carbon budgeting to aid the UK to meet its targets five-year carbon budgeting. Before, the Act pledged the UK to cut greenhouse gas pollution by 80% by 2050 instead of 1990 emissions. The first five carbon budgets were established to accomplish this purpose. In 2021, a new carbon budget was enacted that targets a 78% reduction in emissions by 2035
| [5] | Carr-Whitworth, R., Barrett, J., Colechin, M., Pidgeon, N., Styles, R., Betts-Davies, S., & Wilson, O. (2023). Delivering net zero in the UK: twelve conditions for success. Environmental Research Letters, 18(7), 074041. https://doi.org/10.1088/1748-9326/ace199 |
[5]
. The budget encompasses shipping and aviation emissions putting UK on the track to net zero emissions. The Committee on Climate Change (CCC) functions as the official UK government advisor in matters climate change. The targets set by CCC was set at net-zero greenhouse emission by 2050, demanding 80% reduction from 1990
.
In the United Kingdom, there are three primary official measures of greenhouse gas (GHG) emissions. Territorial emissions totalled 468 million tonnes of carbon dioxide equivalent (Mt CO
2e) in 2018, the most recent year for which all three measures are available, household emissions totalled 569 Mt CO
2e, and footprint emissions reached 703 Mt CO
2e (Government Of UK, 2022). Carbon dioxide (CO
2) emissions in the United Kingdom are predicted to decline by 10.7% in 2020 compared to 2019, to 326.1 million tonnes (Mt), while total greenhouse gas emissions are expected to fall by 8.9% to 414.1 million tonnes carbon dioxide equivalent (MtCO
2e). Total greenhouse gas emissions were 48.8 percent lower in 2010 than in 1990. Fuel burning emits energy and carbon dioxide (CO
2)
| [8] | Rietig, K. and Laing, T., 2017. Policy Stability in Climate Governance: The case of the United Kingdom. Environmental Policy and Governance, 27(6), pp. 575-587. https://doi.org/10.1002/eet.1762 |
| [2] | Shahzad, S., Faheem, M., Muqeet, H. A., & Waseem, M. (2024). Charting the UK's path to net zero emissions by 2050: Challenges, strategies, and future directions. IET Smart Grid. 7(6), 716-736. https://doi.org/10.1049/stg2.12185 |
[8, 2]
.
The quantity of CO
2 emitted by generating one unit of electricity is determined by the fuel used. For instance, since coal has a greater carbon content than gas, burning one tonne of coal produces more CO
2 and GHG emissions than burning one tonne of gas
| [5] | Carr-Whitworth, R., Barrett, J., Colechin, M., Pidgeon, N., Styles, R., Betts-Davies, S., & Wilson, O. (2023). Delivering net zero in the UK: twelve conditions for success. Environmental Research Letters, 18(7), 074041. https://doi.org/10.1088/1748-9326/ace199 |
[5]
. GHG emissions from fossil fuels reduced by 40% between 1990 and 2019. This rather high reduction in emissions may be ascribed to a significant decline in coal consumption coupled with an increase in gas use. According to the Government of the UK (2020), GHG emissions from gas have climbed as a percentage of total GHG emissions from fossil fuels from 26 percent in 1990 to 53 percent in 2019, whereas emissions from coal have fallen as a fraction of total fossil fuel emissions from 39 percent to 3 percent during the same time. Petroleum accounted for 35% of all fossil fuel emissions in 1990, and this figure rose to 43% in 2019.
1.2. Research Problem and Objectives
“The climate is changing. We must change faster” is the philosophy that drives UK Environmental Agency towards reducing emissions and take carbon out of the atmosphere by 2030
| [5] | Carr-Whitworth, R., Barrett, J., Colechin, M., Pidgeon, N., Styles, R., Betts-Davies, S., & Wilson, O. (2023). Delivering net zero in the UK: twelve conditions for success. Environmental Research Letters, 18(7), 074041. https://doi.org/10.1088/1748-9326/ace199 |
[5]
. However, the prevailing statistics and previous performance towards this advancement is raining doubts on the possibility of achieving the ambitions. This is due to various limitations and capitalism is one of the factors. Government body tends to invest its capital in the most profitable areas of development or change, which inclines towards labour being more productive and utilizable, exploitable. A rise in labour productivity typically comprises of high-level tech, which involves supplementary exemplified energy and the withdrawal and utilization of limited, non-recycle resources, and consequently tragic climate change, which the world is facing today. The condition is complex because climate change itself is progressively developing in global regrowth. It is extremely challenging a country to find a balance to strive for growth whilst tacking the super wicked.
Previous data suggests the UK is not on the path to achieve its climate target, based on an article produced by London School of Economics
| [9] | Garvey, A., Norman, J. B., & Barrett, J. (2022). Technology and material efficiency scenarios for net zero emissions in the UK steel sector. Journal of Cleaner Production, 333, 130216. https://doi.org/10.1016/j.jclepro.2021.130216 |
[9]
. The Committee on climate change reported that the "first and second carbon budget were met, and the UK is on track to meet the third until 2022, but is not on track to meet the fourth (2023-2027) or fifth (2028-2032) budgets." The Act established the board on climate change, a self-governing organization to deliver verification-based evidence and advice to the United Kingdom government body and parliament on the obligatory carbon budgets
| [5] | Carr-Whitworth, R., Barrett, J., Colechin, M., Pidgeon, N., Styles, R., Betts-Davies, S., & Wilson, O. (2023). Delivering net zero in the UK: twelve conditions for success. Environmental Research Letters, 18(7), 074041. https://doi.org/10.1088/1748-9326/ace199 |
[5]
. Considering various aspects and due to the limitation of current progression, there is a high probability that the UK will not meet its net zero goals for 2035. This study evaluates this issue, using information from the literature review and available historical emission data. The study also extends the research to look at whether the net-zero emission target could be achieved by 2050
| [10] | Höhne, N., Gidden, M. J., den Elzen, M., Hans, F., Fyson, C., Geiges, A., & Rogelj, J. (2021). Wave of net zero emission targets opens window to meeting the Paris Agreement. Nature Climate Change, 11(10), 820-822. https://doi.org/10.1038/s41558-021-01142-2 |
[10]
. The study focuses on various Acts and evaluate the effectiveness of each instrument and the implications of climate change. Based on the above research problem, the research hypothesis is: Will UK achieve its most ambitious climate change net-zero emission target by 2035 or by 2050
.
2. Literature Review
Policies develop simply and effortlessly in governmental congregational political schemes, but they are challenging to uphold given the shift of uncertainty and various consequences. A journal
| [8] | Rietig, K. and Laing, T., 2017. Policy Stability in Climate Governance: The case of the United Kingdom. Environmental Policy and Governance, 27(6), pp. 575-587. https://doi.org/10.1002/eet.1762 |
[8]
addresses the super wicked problem of climate change and examines what factor determines policy solidity in United Kingdom, intending to ease and reduce negative externality of emissions and production of CO
2. Policies can be comparatively effortless upturned specified by compromise voting. However, several safeguards strengthen policies which the journal discusses
| [12] | Van Soest, H. L., den Elzen, M. G., & van Vuuren, D. P. (2021). Net-zero emission targets for major emitting countries consistent with the Paris Agreement. Nature communications, 12(1), 2140. https://doi.org/10.1038/s41467-021-22294-x |
[12]
. Climate Change Act of 2008 has been established as an obligatory legal pledge conveying indications to forthcoming governance to serve the policy as the UKs key, which reduces the altercation of such policy to become the country's objective. The paper
examines the policy used. It begins by observing the UK's performance, permitting to numerous results applicable to the super wicked and how significantly they are created to diminish emission most cost-effectively. UK achieved a reduction in emissions than The Organization for Economic Co-operation and Development (OECD) countries over 1990-2005. A fall in methane is one example, which led to improved landfill and waste management because of encouraging policies of landfill tax and Landfill Allowance Trading Schemes. The government body plays a crucial role when setting policies and face serious implications when adapting to climate change and uncertainty. The journal
analyses the role of a government body and addresses serious problems faced on the policy agendas. No regret and win is one strategy for managing uncertainty. The no-regret option is to supply benefits today regardless of the extent of climate change while also attaining additional results. I've investigated
| [15] | Lovell, H., Bulkeley, H. and Owens, S., 2021. Converging Agendas? Energy and Climate Change Policies in the UK - Heather Lovell, Harriet Bulkeley, Susan Owens, 2009. [online] SAGE Journals. Available at: https://journals.sagepub.com/doi/pdf/10.1068/c0797j [Accessed 13 December 2021]. |
[15]
which discusses the implications for theories of policy change and the journal
, which assess the advantages and disadvantages of the governmental policy 2008 Climate Change Act. These credible literatures drive the implications of poor air quality, unclean water, rising sea levels which is derived from not addressing the matter appropriately.
Before 2008, the UK government's climate change initiatives were stalled and implemented without effective coordination among government ministries and industries. Nevertheless, this was not due to a lack of initiative
| [17] | Rosenbloom, D., Markard, J., Geels, F. W., & Fuenfschilling, L. (2020). Why carbon pricing is not sufficient to mitigate climate change—and how “sustainability transition policy” can help. Proceedings of the National Academy of Sciences, 117(16), 8664-8668. https://doi.org/10.1073/pnas.2004093117 |
[17]
. Climate governance efforts from local governments, civic organizations, and the commercial sector were many and have continued to flourish, sometimes in collaboration with government and sometimes in opposition. For example, the Nottingham Declaration in 2000 encouraged local governments and communities to consider climate change into their judgment and strategies
| [18] | Gillard, R., Gouldson, A., Paavola, J. and Van Alstine, J., 2017. Can national policy blockages accelerate the development of polycentric governance? Evidence from climate change policy in the United Kingdom. Global Environmental Change, 45, pp. 174-182. https://doi.org/10.1016/j.gloenvcha.2017.06.003 |
[18]
. Low-carbon communities and grassroots efforts have a long, if sometimes unstable, history in the United Kingdom, with the country's economy experiencing a 3.5 percent average annual decline in carbon intensity between 2000 and 2015. Conversely, the degree to which central authority has recognized, promoted or hampered this conduct has varied throughout time
| [9] | Garvey, A., Norman, J. B., & Barrett, J. (2022). Technology and material efficiency scenarios for net zero emissions in the UK steel sector. Journal of Cleaner Production, 333, 130216. https://doi.org/10.1016/j.jclepro.2021.130216 |
[9]
.
A study discusses between 2006 and 2008, the phase of civil society advocacy, business sector endorsements, and political competitiveness that resulted in the passage of the Climate Change Act (CCA), which brought together major players and ideologies from these many sectors
| [18] | Gillard, R., Gouldson, A., Paavola, J. and Van Alstine, J., 2017. Can national policy blockages accelerate the development of polycentric governance? Evidence from climate change policy in the United Kingdom. Global Environmental Change, 45, pp. 174-182. https://doi.org/10.1016/j.gloenvcha.2017.06.003 |
[18]
. This innovative program was codified in law to reduce emissions by 80% from 1990 to 2050. It also created five-year 'carbon budgets,' presented and reviewed by a semi-independent Climate Change Committee (CCC)
A newly formed Department for Energy and Climate Change (DECC) promised that ministers and policy teams would ensure a low-carbon transition in social and energy systems. The Department for Environment, Food, and Rural Affairs (DEFRA) retained responsibility for climate risk assessments and adaptation but was granted additional authority to request progress reports from specific sectors
| [19] | Barrett, J., Pye, S., Betts-Davies, S., Broad, O., Price, J., Eyre, N., & Scott, K. (2022). Energy demand reduction options for meeting national zero-emission targets in the United Kingdom. Nature energy, 7(8), 726-735. https://doi.org/10.1038/s41560-022-01057-y |
[19]
.
Notwithstanding the onset of the global financial catastrophe and the failure of the UNFCCC discussions in Copenhagen in 2009, this significant degree of government activity and political importance lasted for several years
. The first three carbon budgets became legislation, DECC produced an extensive strategy for energy sector change, and DEFRA began compiling a comprehensive Climate Change Risk Assessment
| [18] | Gillard, R., Gouldson, A., Paavola, J. and Van Alstine, J., 2017. Can national policy blockages accelerate the development of polycentric governance? Evidence from climate change policy in the United Kingdom. Global Environmental Change, 45, pp. 174-182. https://doi.org/10.1016/j.gloenvcha.2017.06.003 |
[18]
. At the time, existing politicians and those running for office positioned themselves and the United Kingdom as leaders in the battle against climate change. The Conservative-Liberal Coalition, which was elected in 2010, campaigned on becoming the greenest government ever. However, early concerns were voiced regarding the cost-effectiveness of these initiatives and the climate policy community's limited impact
| [21] | Keskitalo, E. C. H., 2010. Climate change adaptation in the United Kingdom: England and south-East England. Developing adaptation policy and practice in Europe: Multi-level governance of climate change, pp. 97-147. https://doi.org/10.1007/978-90-481-9325-7 |
[21]
(Keskitalo, 2010). The waning influence, interest, and commitment serve as a reminder that flagship strategic policies such as the CCA are insufficient on their own; they must be accompanied by consistent policy progression and execution across multiple areas to achieve the required emissions reductions
| [22] | Shabha, G., Barber, F., & Laycock, P. (2023). A qualitative assessment of the impact of smart homes and environmentally beneficial technologies on the UK 2050 net-zero carbon emission target. Smart and Sustainable Built Environment, 12(2), 341-360. https://doi.org/10.1108/SASBE-07-2021-0112 |
[22]
.
Most of these issues surfaced during the Conservative-Liberal Coalition's 2010–2015 tenure, and they became more intense with the commencement of the Conservative majority government in 2015. According to
| [18] | Gillard, R., Gouldson, A., Paavola, J. and Van Alstine, J., 2017. Can national policy blockages accelerate the development of polycentric governance? Evidence from climate change policy in the United Kingdom. Global Environmental Change, 45, pp. 174-182. https://doi.org/10.1016/j.gloenvcha.2017.06.003 |
[18]
, the politics and lexicon of austerity drowned out previously significant arguments from the DECC, CCC, and DEFRA, while disagreements between departments and ministers made developing trust and transmitting consistent policy signals hard. Senior parliamentarians pushed to limit the UK's leadership role and condition any future ambitions on equivalence with other European countries. DEFRA and DECC suffered significant budget cuts under the austerity banner, restricting their capacity to create policy. However, this relates to
| [21] | Keskitalo, E. C. H., 2010. Climate change adaptation in the United Kingdom: England and south-East England. Developing adaptation policy and practice in Europe: Multi-level governance of climate change, pp. 97-147. https://doi.org/10.1007/978-90-481-9325-7 |
[21]
argument that when it comes to climate policy in parliaments like the United Kingdom, Germany, or, in specific, smaller EU member states, becoming engrained in the EU’s intricate legislative frameworks offers a small backstop, especially when combined with the risk of backing down through too many regulation U-turns and violations of prior agreements. They thereby eliminate the time lag associated with poor political acceptability, which is connected to originally ambitious initiatives.
4. Data Analysis and Results
4.1. Greenhouse Gas Emissions
This section was geared to evaluating the trends in greenhouse gases emissions in UK over a period. The first analysis was done by comparing total carbon dioxide emission (CO
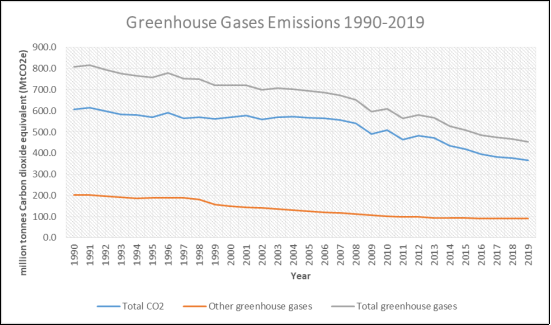
2), other greenhouse gases as well as the total greenhouse gases. The statistics indicated that generally, there is a declining trend in terms of greenhouse gases emission from 1990 to 2019. In 2019, the total greenhouse gases emission was 454.8 MtCO
2e, while that of total CO
2 MtCO
2e and that of other greenhouse gases is 89.7 MtCO
2e (
Figure 1). The trend depicted in the figure shows that significant effort has been made in reducing the emission over time. A significant decline for gases emitted is observed between 2013 to 2019, which could be attributed to the efforts by the enacted emission acts, pressure from the net-zero emission targets and sustained efforts from the concerned bodies such as CCC.
Figure 1. Greenhouse Gases Emissions 1990 - 2019 Trend.
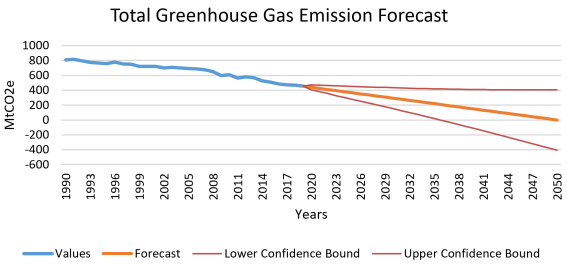
4.2. Forecast of Emission
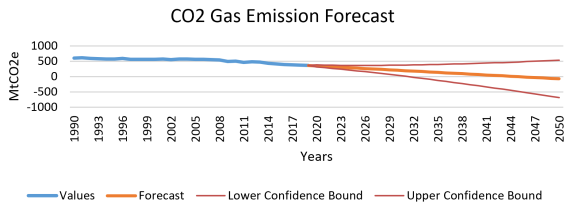
The next analysis was to forecast trends in the emission of greenhouse gases over time based on the previous results. The forecast was made for two trends – total greenhouse gases emission and CO2 emissions from year 2019 to year 2050. The purpose of this forecast was to determine what would be the level of greenhouse gas emission by 2035 (the new target set in 2021) and by 2050 the net-zero emission target. The results indicated that on 2035, the total greenhouse gas emission in UK would be 219.95 MtCO2e while that of total CO2 would be 137.19 MtCO2e. It is therefore evident that the reduction in emission would not have been reduced by 78% as targeted by the CCC, if the same trend and effort is going to be maintained.
However, considering the level of emission reduction by 2050, some interesting results are obtained. The results indicated that for the total C0
2 emissions, if the same trend and effort is maintained, the total emission was forecasted to be -74.29 MtCO
2e. This implies that there would be no emissions of CO
2 gases in the atmosphere. The net-zero emission of CO
2 would be achieved between year 2044 and 2045. For the total greenhouse gases emissions, the results indicated that for the year 2050, the emission would be 0.32 MtCO
2e. This means that the emission would be approximately net-zero. This confirms that the net-zero emission target would be achieved by 2050. These results were tested with 95% confidence intervals, with considerations of upper confidence bound and lower confidence bound. The results are shown in
Figure 2 and
Figure 3.
Figure 2. Total Greenhouse Gas emission forecasts.
Figure 3. Total CO2 Gas emission forecasts.
4.3. Efforts Made and Required
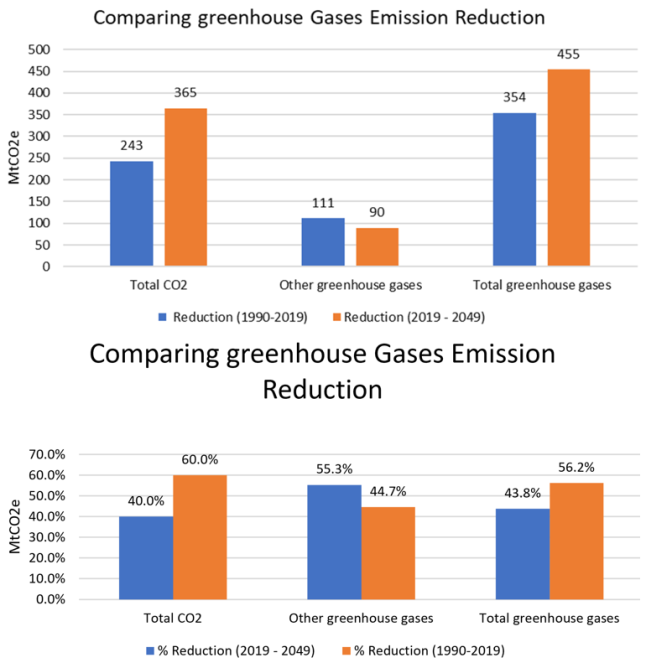
This section was conducted to compare the amount of greenhouse emission reduced between 1990 – 2019 (30 years) and between 2020 – 2049 (30 years). The two periods have 30 years each. The goal of this comparative analysis was to determine whether the amount of gas to be reduced between 2020 – 2049 is higher compared to the one that was reduced between 1990 – 2019. Figure below compared the amount emitted between 1990-2019 and amount required to be emitted between 2020 – 2049.
Figure 4. Comparing greenhouse gas emissions 1990 - 2019 and 2020 – 2049.
In this analysis, 1990 was used as the benchmark for calculating percentage changes. The statistics shows that for the total CO
2, the emission was reduced by 40% (243 MtCO
2e) between 1990 – 2019, but would need to be reduced by 60% (356 MtCO
2e) between 2020 – 2049. This means that greater effort is needed for the next 30 years to arrive at net-zero emission by 2050. On the centrally, it was observed that for the case of other greenhouse gases, the emission was reduced by 55.3% (111 MtCO
2e) between 1990 – 2019, but would need to be reduced by 44.7% (90 MtCO
2e) between 2020 – 2049. For the case of other greenhouse gases, less effort was required between 2020 – 2049 than the previous 30 years. For the case of total greenhouse gases emission, it was observed that the emission was reduced by 43.8% (354 MtCO
2e) between 1990 – 2019, but would need to be reduced by 56.2% (455 MtCO
2e) between 2020 – 2049 (
Figure 4).
Table 1. Greenhous gases reduction rate.
Greenhouse Gases | Reduction (1990-2019) | Reduction (2019 - 2049) |
Total CO2 | 243 | 365 |
Other greenhouse gases | 111 | 90 |
Total greenhouse gases | 354 | 455 |
Greenhouse Gases | % Reduction (2019 - 2049) | % Reduction (1990-2019) |
Total CO2 | 40.0% | 60.0% |
Other greenhouse gases | 55.3% | 44.7% |
Total greenhouse gases | 43.8% | 56.2% |
Generally, it is evident that to achieve the targeted net-zero emission by 2050, more effort is required to reduce the emission that it was done in the previous 30 years. It is for this reason that this target may be considered as a highly ambitious one over a period in the UK.
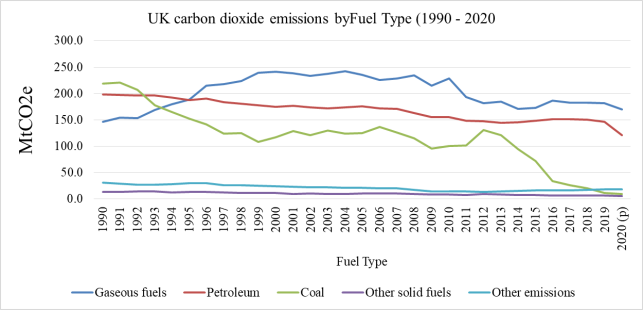
4.4. Greenhouse Gas Emission by Fuel Type
From the previous analysis, it was observed that carbon dioxide comprised the highest amount of greenhouse gases that was emitted. As a result, it was considered important to conduct an analysis of the various types of fuels that contributed to the emission of the carbon dioxide gas. From the historical data collected from the Gov.uk data respiratory, there are five different types of fuels that contributed to carbon dioxide emitted in UK. These include gaseous fuel, petroleum, coal, other solid fuels, and other emissions. The statistics indicated that the other solid fuels and other emissions have a very small contribution towards the total amount of carbon dioxide emitted. Though a gradual declining trend was observed, it was not possible to evaluate them effectively when compared to others. On the other hand, the major contributors to carbon dioxide emission in UK was gaseous fuel, coal and petroleum. Among them, gaseous fuel was found to have the highest emission amount, followed by petroleum and lastly the coal. Considering their trend in emissions, UK seems to have controlled the use of coal. A declining trend is observed, and a sharp decline is observed between 2012 and 2019 from 131.1 MtCO2e to 6.4 MtCO2e respectively. There is a clear indication that carbon dioxide emission from coal will be eliminated by 2050.
For the petroleum, the emission is declining at a very small rate over time. The emission reduced from 197.9 MtCO
2e in 1990 to 146.7 MtCO
2e in 2019. Though these are considerable reduction in emissions, it is a clear indication that the reduction of carbon dioxide emission has been a challenge. For the case of gaseous fuels, observed increased from 146.2 MtCO
2e in year 1990 to 241.6 MtCO
2e in year 2000. From there, the emission started declining gradually over time from 241.6 MtCO
2e in year 2000 to 181.4 MtCO
2e in year 2019. It is therefore evident that comparing between 1990 and 2019, the emission of carbon dioxide from gaseous fuels has actually increased, as it depicts an upward trend (
Figure 5). Hence, much effort needed to be accorded towards the reduction of carbon dioxide emissions from gaseous fuels.
Figure 5. UK Carbon dioxide emissions by fuel type (1990 - 2020).
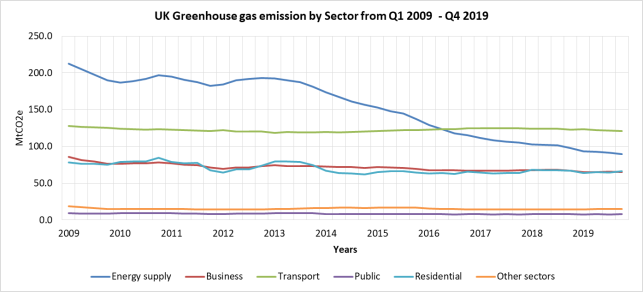
4.5. Greenhouse Gas Emission by Sector
The previous analysis highlighted the different trends of emission based on the various fuel types. This section extends the analysis by evaluating the trend of greenhouse gas emission based on the various sectors – energy supply, business sector, transport sector, public sector, residential sector and other sectors. The results revealed that among the six sectors evaluated, two sectors – public sector and other sectors – were found to have insignificant influence on the amount of greenhouse gases emitted in UK. Actually, over the period-considered (2009 – 2019), the public sector emission did not exceed more than 15.0 MtCO2e. On the other hand, the other sector had significant little greenhouse gases emission. From 2009 – 2019, the emission from other gases averaged approximately 15.5 MtCO2e. For the other four sectors, the one with the highest emission over the period considered is energy supply. Energy supply was the highest source of greenhouse gases from 2009 to 2016. In 2009, the emission from energy sector was 212.8 MtCO2e. However, the emission from the sector experienced a significant decline over time up to 2019 where the amount is 89.6 MtCO2e. This indicates significant effort on the side of reducing greenhouse gases emission from the energy supply sector.
Another significant contributor of the greenhouse gas emission in UK is the transport sector. Actually, it is currently the sector with the highest emission as at 2019 (120.8 MtCO
2e) after the emission from energy sector was reduced below its levels in 2016. The statistics show that greenhouse gas emissions from transport sector have been experiencing alternating increasing and decreasing trends over the period considered. For instance, the emission was 127.8 MtCO
2e in 2009 and experienced a declining trend up to 2013 (118.3 MtCO
2e). It then experienced an increase from 2013 up to 2017, and then declined up to 2019 to 120.8 MtCO
2e (
Figure 6). It is a critical indication that transport sector poses the main challenge as far as reduction of greenhouse gases is concerned. This is because the effort to reduce its emissions has not been successful over time. The other two sectors – business sector and residential sector – has experienced declining trend over time. However, the trends notes that there is only a slight reduction in its emissions over time. The evaluation from the emissions from the six sectors considered shows that a significant reduction is only experienced in the energy supply sector.
Figure 6. UK Greenhouse gas emissions by sector from Q1 2009 - Q4 2019.
5. Discussions
From the data analysis regarding the greenhouse emissions in UK conducted in the previous section, there are various inferences that could be presented. The UK government targets and passage of an Act in 2019 to bring the greenhouse gas emission to net zero by 2050 was considered a critical move towards environmental protection. The act was amended in 2019 from the 2008, which targeted reduction of greenhouse gases, by 80% by 20150. In 2021, it was announced as the most ambitious climate change target in the world, which was geared to reduce the emissions by 78% by 2035 as compared to the 1990 levels. Based on the previous researches, and available data, the achievement of this target is doubtful. This research investigated the possibility of achieving this target, from the analysis of the available data.
Firstly, the results show that the emission of greenhouse gases has been decreasing from 1990 to 2019. This is a clear indication that there have been efforts to reduce emissions in UK. Hence, there was a general move and efforts towards achieving the net-zero emission. The results indicate that total carbon dioxide emissions contributed the highest amount of greenhouse gasses. Therefore, this study observed that C02 should be the major focus in the effort to reduce greenhouse gases emission in UK. The hypothesis of the study was to evaluate whether it the target of net-zero emission budget would be achieved by 2050, or the 78% reduction in emission would be reduced by 2035
. To evaluate the hypothesis, a prediction of possible achievement of the targeted was made based on the available data. The results indicated that the reduction of greenhouse gas emission by 2035 compared to 1990 levels (the most ambitious climate change target) would not be achieved. This would be so, if the same efforts and strategies applied since 1990 to date would continue to be adopted. However, the forecast was extrapolated up to 2050, and the research revealed that the greenhouse gases emission would be reduced to net-zero by 2050. These findings are interesting considering that this study forecast indicated that total CO
2 would be reduced to zero between 2044 and 2045.
Additionally, the study compared the amount of emission reduction made in percentage (1990 – 2019), and compared it with the amount of reduction required (2019 – 2049). The results obtained showed that much greenhouse gas emission need to be reduces between 2019 – 2049, as compared to the one that was reduced between 1990 – 2019. This clearly indicates that more stringent strategies and efforts need to be adopted, if the net-zero emission target is to be achieved. For instance, while total CO2 was reduced by 40% between 1990 – 2019, it needs to be reduced by 60% between 2019 – 2049 to reach the target. For the total greenhouse gases, they need to be reduced by 56.2% between 2019 – 2049 as compared to 43.8% between 1990 – 2019. This study indicated that it is not possible to achieve the 2035 net-zero emission targets, but it is possible to be achieved in year 2050 in UK.
This study extended the analysis, to determine which areas would need extra focus to accelerate the achievement of the net-zero emission target. The two aspects considered was the emission by sector and emission by fuel type. Considering the different sector, this study found out that energy supply sector has been experiencing decreasing trend, and thee it should be maintained. However, critical attention need to accord to the transport sector. The reduction of emission in the transport sector need to be stagnating. There is need for adoption of environmental friendly means of transport such as hybrid vehicles, and electric trains and vehicles as a means of reducing CO2 emission from transport sector. Other sectors that need attention is the business and residential sectors, which emission has been reducing at a lower rate compared to the energy supply sector. The emission was also compared in terms of the fuel type. The study identified two fuel types that need to be addressed, as far as achievement of net-zero emission target is to be achieved. These fuel types include the gaseous fuels and petroleum. An effort needs to be made to reduce the emission from these sources, as the account more than 60% of the total carbon dioxide emission in UK.