Research Article | | Peer-Reviewed

Enhancing Students’ Graphing and Data Analysis Skills in Physics Laboratory Courses Through Guided Practice

Received: 15 December 2025     Accepted: 13 January 2026     Published: 28 May 2026
Views:       Downloads:
Abstract

Graphing and data analysis are essential skills in physics laboratories, yet many first-year students face challenges in accurately representing and interpreting experimental data. This study aimed to investigate the effectiveness of a guided practice intervention in improving these skills among 23 undergraduate physics students at Raya University. A classroom-based action research design with a quasi-experimental pre-test/post-test approach was implemented over four weeks, embedding scaffold, step-by-step guidance into regular laboratory sessions. Quantitative data from assessments and qualitative data from student reflections, surveys, and observations were collected to evaluate the intervention. Pre-intervention assessment revealed notable weaknesses in graph construction, use of computational tools, and data interpretation. Following the guided practice, students’ average scores improved from 10 to 18 out of 20, with the largest gains observed in graphing, MATLAB application, and result analysis. Post-assessment of the experiment “Measuring Local Acceleration Due to Gravity” yielded an average value of 8.72 m/s², within 11.11% of the standard, demonstrating the accuracy and effectiveness of the intervention. Qualitative findings indicated increased confidence, improved conceptual understanding, and enhanced scientific reasoning. These results suggest that scaffold guided practice significantly enhances procedural and conceptual competencies in experimental physics. The study provides a replicable instructional model for strengthening STEM laboratory learning, particularly for students who require additional support in foundational physics skills.

Published in International Journal of Theoretical and Applied Mathematics (Volume 12, Issue 2)
DOI 10.11648/j.ijtam.20261202.12
Page(s) 46-56
Creative Commons

This is an Open Access article, distributed under the terms of the Creative Commons Attribution 4.0 International License (http://creativecommons.org/licenses/by/4.0/), which permits unrestricted use, distribution and reproduction in any medium or format, provided the original work is properly cited.

Copyright

Copyright © The Author(s), 2026. Published by Science Publishing Group

Keywords

Physics Education, Graphing Skills, Data Analysis Skills

1. Introduction
Laboratory sessions are a foundation of physics education, bridging the gap between theoretical concepts and real-world applications. Central to laboratory work is the ability to graph experimental data accurately and analyze resulting trends. These skills enable students to interpret physical phenomena, draw evidence-based conclusions, and develop scientific reasoning and critical thinking abilities . However, numerous studies indicate that many students struggle with basic graphing and data analysis tasks, such as selecting appropriate axes, labeling units, drawing lines of best fit and interpreting patterns . These challenges impede students’ understanding of experimental results and limit the effectiveness of laboratory instruction. Guided practice has emerged as a promising pedagogical strategy to address these challenges. Guided practice is grounded in constructivist learning theory, where knowledge is actively constructed through experience, and learning occurs in social contexts . By providing structured support, modeling, scaffolding, and timely feedback, instructors help students operate within their zone of proximal development (ZPD) specifically the space between what learners can do independently and what they can achieve with guidance. This approach aligns with the principles of cognitive apprenticeship, where learners acquire both procedural and conceptual knowledge through guided, authentic practice . In physics laboratories, guided practice involves step-by-step instruction on graph construction and analysis, allowing students to build competence gradually before transitioning to independent application. This study investigates the impact of guided practice on students’ graphing and data analysis skills in introductory university physics laboratories. Beyond local implications, the research contributes to broader efforts in improving science education globally, highlighting methods that can enhance students’ scientific reasoning, inquiry, and data literacy across diverse educational contexts.
1.1. Background of the Study
Physics laboratories provide students with opportunities to engage in hands-on experimentation, applying scientific inquiry to observe, measure, and evaluate empirical evidence. Graphing and data analysis are central to this process, translating raw measurements into meaningful relationships that communicate scientific findings . Graphs serve multiple functions: they reveal trends, clarify relationships, illustrate experimental uncertainty, and identify anomalies or systematic errors. Data analysis complements graphing by helping students interpret trends, calculate slopes or areas, and compare results with theoretical predictions. Together, these skills foster deep conceptual understanding, critical thinking, and scientific reasoning . Despite their importance, students often demonstrate persistent difficulties in graphing and data analysis. Common errors include mislabeling axes, inconsistent scaling, misidentifying variables, and misinterpreting slopes or intercepts . Left unaddressed, these deficiencies undermine students’ ability to conduct meaningful inquiry and limit learning outcomes in physics laboratories. Guided practice offers a scaffolder solution, combining demonstration, feedback, and structured repetition to support learners’ progression from novice to proficient performance. In the context of physics labs, guided practice allows students to develop procedural fluency and conceptual understanding simultaneously, strengthening their ability to engage in authentic scientific inquiry . Moreover, this instructional approach has transferable pedagogical value, offering a model that can be adapted across disciplines and educational settings to enhance data literacy and analytical reasoning skills.
1.2. Statement of the Problem
Many undergraduate physics students struggle with creating accurate graphs and interpreting data, which limits their understanding of experimental results. This research explores whether a structured guided-practice approach can significantly enhance these skills.
1.3. Research Questions
1) What are the most common difficulties students face when graphing and analyzing data in physics laboratories?
2) How does guided practice affect students’ accuracy and confidence in graphing experimental data?
3) To what extent does guided practice improve students’ ability to analyze and interpret physics lab results?
4) How do students perceive the usefulness of guided practice in learning graphing and data analysis skills?
1.4. Significance of the Study
This study contributes to the improvement of physics education by addressing a fundamental yet often underdeveloped skill set: graphing and data analysis. By exploring a structured, research-based instructional strategy, the findings may offer practical teaching methods that enhance student performance in labs, help instructors identify and address specific learning difficulties, support in integrating guided practice techniques into lab manuals and instructional design and ultimately, foster deeper scientific reasoning and promote better experimental outcomes for students in STEM disciplines.
1.5. Objective of the Study
This study aims to examine the effectiveness of guided practice in improving physics students’ graphing and data analysis skills in laboratory courses. Specifically, it investigates how structured, hands-on guidance can enhance students’ ability to interpret, construct, and analyze graphs, as well as process and draw conclusions from experimental data. The study also explores how guided laboratory exercises support the development of scientific reasoning and analytical thinking, providing evidence-based strategies to improve learning outcomes in undergraduate physics education.
2. Literature Review
Graphing skills are a fundamental component of experimental physics, providing a visual framework to analyze relationships between variables and extract meaningful interpretations. Research consistently shows that students, particularly at the introductory level, struggle with tasks such as identifying independent and dependent variables, scaling axes appropriately, labeling units, and interpreting slopes and intercepts . These difficulties not only reduce the clarity and accuracy of student work but also reflect deeper conceptual misunderstandings of the underlying physical systems. For example, Test of Understanding Graphs in Kinematics (TUG-K) revealed that even after instruction, many students confuse the shape of a graph with the motion it represents. Similarly, found that students often interpret graphs as literal pictures rather than abstract representations of data, underscoring the need for explicit instruction in graph construction and interpretation . The persistent nature of these challenges suggests that the ability to construct and interpret graphs is not intuitive and must be scaffolder through structured instructional methods. Guided practice, rooted in constructivist theory, cognitive apprenticeship, and Vygotsky’s zone of proximal development (ZPD), provides such a scaffold. In this approach, instructors model tasks, provide step-by-step guidance with feedback, and gradually release responsibility to students . By operating within students’ ZPD, guided practice supports learners in moving from tasks they cannot yet perform independently to achieving competence through social interaction, modeling, and feedback . In STEM education, guided practice has been widely recognized as effective for teaching complex, skill-based tasks, including data analysis and experimental reasoning . In physics laboratories, guided practice has been shown to enhance graphing and data analysis skills by breaking down complex tasks into manageable steps and providing immediate feedback. For example, demonstrated that students who received guided instruction on graphing and analyzing motion data were better able to identify trends and articulate underlying physical principles. Similarly, found that scaffold instruction enabled students to move beyond surface-level graphing behaviors, such as merely plotting points, toward analytical approaches emphasizing trend identification and slope interpretation. These studies illustrate that guided practice not only develops procedural competence but also strengthens scientific reasoning and inquiry skills, which are central to physics education. Despite, this strong theoretical foundation and promising empirical results, gaps remain in the literature. Most studies focus narrowly on kinematics or mathematics education, with less attention given to other physics domains, such as optics, thermodynamics, or electromagnetism . While guided practice is well-established as a general instructional strategy, its targeted application to university-level physics labs particularly within action research contexts remains underexplored . Additionally, few studies investigate students’ perceptions of guided practice, an important factor for motivation, engagement, and long-term skill retention . Finally, much of the research relies solely on quantitative performance metrics, with limited integration of qualitative data such as student reflections or observational analyses, which constrains understanding of instructional effectiveness. This study addresses these gaps by implementing guided practice to enhance graphing and data analysis skills in university physics laboratories. Using a mixed-methods approach that combines pre- and post-assessments, observational data, and student reflections, the study aims to provide both a rigorous evaluation of learning outcomes and insights into students’ experiences. By connecting theory, practice, and reflection, this research contributes not only to local instructional improvement but also to broader efforts to strengthen scientific reasoning and data literacy in physics education worldwide.
3. Research Methodology
3.1. Research Design
A classroom-based action research approach was implemented to address students’ difficulties with graphing and data analysis in laboratory settings. This study was conducted in an introductory university-level physics course, Phys-1011 (General Physics). The goal was to improve these skills through the use of guided practice during regular physics lab sessions. The study employed a quasi-experimental design with a pre-test/post-test structure to measure the effectiveness of the instructional intervention. Over a period of four weeks, students participated in structured, guided activities aimed at developing their ability to interpret data and represent it graphically. These sessions were embedded within the standard lab curriculum. To gain a comprehensive understanding of the impact of the intervention, both quantitative and qualitative data were collected. Quantitative data included students’ scores on pre- and post-tests assessing graphing and data analysis skills, while qualitative data were gathered through student reflections, classroom observations, and open-ended survey responses. This mixed-methods approach allowed for both statistical measurement of improvement and deeper insight into students' learning experiences.
3.2. Participants
The participants in this study were 23 first-year undergraduate physics students enrolled in an introductory physics course at Raya University. A purposive sampling method was used, selecting students based on their enrollment in the experimental physics laboratory course associated with the study. Although students came from diverse academic backgrounds, they had comparable prior exposure to physics, ensuring a relatively consistent baseline of content knowledge. The participants were received traditional laboratory instruction in the pre-assessment, and post-assessment which received through guided practice aimed at improving graphing and data analysis skills during lab sessions.
3.3. Data Collecting Methods
3.3.1. Pre-Assessment
The pre-assessment phase was designed to evaluate the participants’ baseline skills in graphing and data analysis in relation to experimental physics. This evaluation was conducted using a pre-test aligned with the skill areas presented in Table 1. During the first week of the Phys-1011 (General Physics) laboratory course, students were introduced to the lab manual, which outlined laboratory procedures and expectations. They were then guided to perform Experiment-2, “Measuring the Local Acceleration Due to Gravity,” by following the manual instructions. At this stage, the goal was to assess students’ laboratory competencies without providing full step-by-step assistance. The pre-test measured several skill domains, including manipulative skills, data observation, variable identification, graph construction, and the use of computer tools such as MATLAB for plotting. As shown in Table 1, the pre-assessment served as a baseline diagnostic tool, helping to determine students’ initial graphing and data analysis skills before the guided practice intervention. By examining performance in areas such as variable identification, graphing, data interpretation, and computational tool use, the pre-test produced a clear snapshot of each student’s skill level prior to instruction. Importantly, the results of this assessment were not only evaluative but also foundational in determining the four-week guided practice intervention.
Table 1. Pre-Test assessment of graphing and data Analysis skills.

Skill Area

Description

Max. Points

Score Given

Number of Students

Manipulative Skills

Understand the theory and objectives of the experiment

1

0.5

2

Data Observation Skills

Accurately read instruments and measure physical quantities, considering least count

1

1.0

1

Reporting Skills

Present calculations and results using appropriate significant figures and accuracy

2

1.0

2

Identifying Variables

Correctly identify independent and dependent variables and assign them to the appropriate graph axes

1

0.5

3

Choosing Graph Type

Select the appropriate graph type (line, bar, scatter) for the data

1

1.0

2

Graph Construction

Accurately plot data, label axes, and choose appropriate scales

3

1.0

2

Use of Computer Tools

Utilize software such as MATLAB for data plotting and analysis

2

0.5

1

Best-Fit Line

Draw trend lines and correctly interpret the slope and intercept

1

1.0

1

Data Interpretation

Interpret graphs accurately by identifying trends, patterns, or relationships

2

0.5

3

Interpreting Physical Meaning

Relate experimental outcomes to theoretical concepts and identify any discrepancies

2

1.5

3

Uncertainty/Error Analysis

Recognize measurement uncertainty, apply error bars, and account for variability

1

0.5

2

Data Analysis & Presentation

Effectively present aim, apparatus, formulas, data tables, calculations, and conclusions

3

1.0

1

Total Possible Score

10

From Table 1, the pre-assessment provides a clear snapshot of students’ abilities in experimental physics, significant gaps in graph construction, data interpretation, computational tool usage, and comprehensive reporting. Conversely, stronger areas such as selecting appropriate graph types and interpreting basic conceptual relationships can serve as foundations to scaffold weaker skills. By aligning instruction with these insights, the intervention is strategically positioned to enhance both technical and analytical competencies, while the post-assessment sequence allows for precise measurement of improvement and direct comparison with baseline performance. The contrast between pre- and post-assessment outcomes therefore serves not only as evidence of skill development, but also as an indicator of the effectiveness of the guided practice approach.
3.3.2. Instructional Design
(i). Alignment of Assessment with Instructional Planning
The instructional design was informed directly by the pre-assessment results, which identified specific weak areas in students’ graphing and data analysis abilities. These weaknesses included limited proficiency in graph construction, difficulty interpreting data, and restricted use of computational tools such as MATLAB. Recognizing these gaps allowed the intervention to be purposefully structured around the skills students needed most. To guide this process, the pre-assessment was organized around well-defined skill domains, with standardized scoring rubrics ensuring consistency and accuracy in evaluating performance. These skill domains included manipulative and observational skills, graphing competencies, and analytical and interpretive skills. The detailed scoring results helped pinpoint where instructional support was required and where existing strengths could be leveraged for scaffolding. This assessment-instruction alignment also established a basis for evaluating growth. By designing the post-assessment to mirror the pre-assessment in format and rubric structure, the study created a valid means to compare performance before and after the intervention. This direct comparison is central to the quasi-experimental design, enabling clear measurement of improvement and providing evidence of instructional effectiveness.
(ii). Scaffolding-Based Instructional Model
The instructional intervention was built on research-supported pedagogy aimed at improving graphing and data analysis skills through a scaffolded and phased approach. This design drew from Principles of Instruction and the instructional scaffolding. The goal was to shift learners gradually from supported practice to independent mastery by following four sequenced stages:
1) Teaching Phase
Students first received direct instruction in the fundamentals of graphing and data interpretation. The instructor explained how to identify independent and dependent variables, select suitable graph types, scale axes, and interpret slopes and trends. The relevance of these skills in experimental physics was emphasized, supported by examples of real-world data and common student misconceptions.
2) Modeling Phase
Next, instructors demonstrated the full graphing and analysis process using a sample dataset. Step-by-step modeling included scale selection, axis labeling with units, best-fit application, and MATLAB visualization. This phase exposed students to the expert reasoning behind graphing decisions and highlighted how choices affect interpretation.
3) Guided Practice Phase
Students then conducted the experiment Measuring the Local Acceleration Due to Gravity while receiving real-time guidance. Scaffolding included checklists, example MATLAB scripts, and verbal prompts. Students worked collaboratively and received feedback as misconceptions appeared. This stage supported the internalization of graphing procedures and increased student confidence.
4) Independent Practice Phase
Finally, scaffolds were removed, and students applied the full skill set independently in advanced lab sessions. They constructed graphs, analyzed data with MATLAB, and interpreted results without direct support. This phase promoted autonomy, real-world inquiry skills, and skill transfer to new experiments. Together, these four phases formed a coherent instructional sequence moving students from introduction to mastery. Each stage built on the previous one, supporting long-term retention and transfer. This model reflects best practices in STEM education and offers a replicable framework for strengthening core experimental competencies in undergraduate physics.
3.3.3. Post-Assessment
Following the guided practice intervention, students completed a standardized post-assessment designed to evaluate the same core competencies outlined in Table 1. The assessment mirrored the structure of the pre-assessment to ensure reliable comparison of conceptual and procedural growth. The assessment was carried out during a 90–120 minute laboratory period within the scheduled weekly session, providing sufficient time for students to set up the apparatus, collect multiple trials of oscillation data, complete calculations, construct graphs, and articulate their interpretations in written form. The primary post-assessment task centered on the laboratory experiment “Measuring Local Acceleration Due to Gravity,” selected for its relevance to fundamental physics concepts and its integration of multiple laboratory skills, including measurement technique, data analysis, and application of kinematics principles. Students individually conducted Experiment 2 from the PHYS-1011 (General Physics) laboratory manual.
1) Experimental Setup and Apparatus
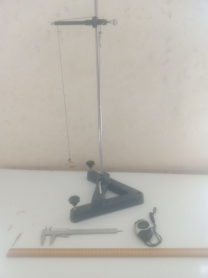
The experimental setup required students to suspend a small metal pendulum bob using a lightweight string of known length, gradually adjusting the pendulum to achieve minimal air resistance and stable oscillations (see Figure 1). Standard laboratory instruments were utilized, including a meter stick for measuring the pendulum length and a Vernier caliper for determining the vertical radius from the geometric center of the bob with high precision. A digital timer/stopwatch was employed to record oscillation periods accurately, while a retort stand with adjustable clamps was used to maintain stable alignment of the experimental setup throughout the measurement process. These instruments were emphasized due to their ability to minimize observational and measurement errors, thereby improving data reliability for subsequent analysis. During the assessment, students were instructed to record multiple trials to reduce random errors, compute the average time for a set number of oscillations, and calculate the experimental value of local gravitational acceleration. They were further tasked to present findings through data tables, graphs of period squared versus length, and comparative evaluation against the theoretical value of 9.81 m/s2. Assessment scoring was guided by a rubric that evaluated the accuracy of setup, precision and consistency of measurements, correctness of calculations, and clarity of interpretation. This format enabled a robust comparison with pre-intervention results and provided strong indicators of students’ conceptual and procedural improvement.
Figure 1. Experimental setup.
2) Experimental Task Description
a) Title of the Experiment: Measuring Local Acceleration due to Gravity
b) Objective: to calculate the Local Acceleration due to Gravity
c) Equations: g'=4π 2LT 2 Where, time period,
T = time taken for each oscillations Number of oscillations = tN
d) Record the Data Observations and Analysis Local acceleration due to gravity, g'quantitatively.
e) Analyze experimental data to calculate local gravity values.
f) Determine the percentage error compared to the standard value of g = 9.81m/s2
g) Discuss discrepancies, identify possible sources of error, and reflect on measurement reliability
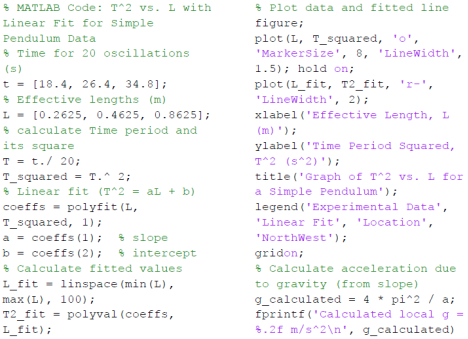
h) Generate and interpret plots using MATLAB Syntax:
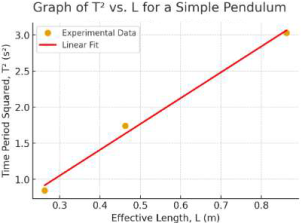
i) Plot T2 vs. L (to examine g′ is the slope between pendulum’s effective length and Period Square).
j) Remark: Effective length, L = radius of the bob + height of hook + length of the string
3) Post-Assessment and Performance Evaluation
The post-test assessment was administered after the instructional intervention to evaluate students’ conceptual understanding and procedural competency in graphing and data analysis, with a specific focus on the experiment "Measuring Local Acceleration Due to Gravity." The tasks in the post-assessment mirrored those of the pre-assessment in both structure and scoring criteria, ensuring consistency and enabling valid comparison of students’ progress. Tables 2, 3, and 4 collectively illustrate how students’ performance in this experiment aligns with the skill domains previously outlined in Table 1.
Table 2. Post-Assessment Tasks and Measured Outcomes.

Radius of the bob = 0.0253 (in m) and height of the hook = 0.0372 (in m) Number of oscillation/complete cycles = 20 Accepted value of acceleration due to gravity, g at the surface of the Earth = 9.81 (in m/s2)

No. of Trials

Length of the string, Lo (in m)

Effective Length, L (in m)

Time, t taken for each oscillation (in seconds)

Time Period, T for each oscillation (in second)

Measured local acceleration due to gravity, g’ (in m/s2)

1

0.20

0.2625

18.40

0.920

9.79

2

0.40

0.4625

26.40

1.320

8.83

3

0.80

0.8625

34.80

1.740

7.55

Average

---

---

---

---

8.72

Percentage Error

11.11%

Table 2 summarizes students’ post-assessment performance. Results indicate that students successfully calculated the local value of gravitational acceleration as 8.72 m/s2 using the time-period method of a simple pendulum based on the conservation of Energy. This value is reasonably close to the accepted standard 9.81 m/s2, falling within an experimental deviation of 11.11%. The experiment was conducted on the fourth floor of the laboratory building, and students correctly recognized that gravity decreases slightly with altitude, as increased distance from the Earth’s center reduces gravitational pull. This aligns with theoretical expectations and supports the validity of the measured result. Students also attempted to generate the required graphical representation using MATLAB and demonstrated increasing proficiency in coding, computation, and visualization as part of the analytical component of the task.
Figure 2. MATLAB Syntax.MATLAB Syntax.
4) Post-Task Performance Evaluation
Post-task performance was further evaluated using a structured rubric that translated observed behaviors into measurable scores across twelve laboratory skills. These skills included apparatus handling, measurement accuracy, data recording, graphing, computational tool usage, uncertainty evaluation, and conceptual interpretation. Each component was assessed in relation to metacognitive growth, how well students monitored, analyzed, and justified their experimental decisions. Individual scores were averaged, and group-level results were analyzed to highlight areas of strength and identify skills requiring further reinforcement. Table 3 presents the full rubric along with score distributions, providing transparent, evidence-based documentation of student performance following the intervention.
Table 3. Students’ Post-Task Performance assessment aligned with Targeted Skill Areas.

Skill Area

Evidence from Post-Task Activities (Table 2)

Metacognitive Skill Development

Manipulative Skills

Students calculated T from raw timing data and determined effective length accurately.

Errors in calculating T or length; results not usable

Mostly correct but some mistakes in units/significant figures

Fully accurate calculation of T and effective length

Data Observation Skills

Collected and recorded measurements with proper units and significant figures.

Measurements missing/inaccurate

Measurements mostly correct but inconsistent in units/figures

Complete, accurate measurements with correct units and significant figures

Reporting Skills

Reported calculated values of g′, and included observations and comparisons with accepted values.

Report incomplete, missing comparisons

Report includes results but limited analysis

Clear report with values, observations, and comparison to accepted g′

Identifying Variables

Plotted T2 (independent) vs. L (dependent), showing understanding of experimental variables.

Incorrect independent/dependent identification

Variables partly correct, some confusion

Correctly identifies T2 (independent) and L (dependent)

Choosing Graph Type

Used appropriate scatter plots for continuous variables.

Wrong graph type

Somewhat appropriate but not ideal

Correct scatter plot selected

Graph Construction

Constructed well-labeled graphs using MATLAB with proper scales and axis titles.

Missing labels/scales or unclear graph

Labeled but not scaled well

Well-labeled, clear scales, correct axis titles

Use of Computer Tools

Launched and used MATLAB for plotting and analysis and creating MATLAB syntax.

Unable to use MATLAB

Basic use with errors

Correct use, syntax applied effectively

Best-Fit Line

Applied linear regression to draw a line of best fit and calculated slope.

No line of best fit

Line applied but slope not fully correct

Correct linear regression and slope calculation

Data Interpretation

Interpreted linearity of T2 vs. L and extracted gravity value from the slope.

No meaningful conclusion

Some correct interpretation but incomplete

Correct extraction of g′ and sound interpretation

Interpreting Physical Meaning

Related slope to the constant g′ and discussed deviations from accepted value.

No link between slope and g′

Mentions g′ but lacks depth

Relates slope to g′ and explains deviations

Uncertainty /Error Analysis

Identified sources of error and discussed slight variations in g′ across trials.

No mention of error

Some sources of error identified

Complete error analysis with discussion of variations

Data Analysis & Presentation

Averaged data, calculated key values, and completed analysis with clear documentation.

Incomplete or inaccurate analysis; poor documentation

Analysis partially correct; some documentation issues

Correct analysis with clear, well-documented presentation

Table 4. Post-Test – Assessment of Graphing/Data Analysis Skills.

Skill Area

Description

Points

Scoring Rubric

Average Score

Manipulative Skills

Comprehend the theory and objectives of the experiment

1 pt

0.5-1

1

Data Observation Skills

Measure physical quantities with least count consideration

1 pt

0.5-1

1

Reporting Skills

Accurate results, significant figures, and proper presentation

2 pts

0.5-2

2

Identifying Variables

Identify independent and dependent variables; assign them to correct axes

1 pt

0.5-1

1

Choosing Graph Type

Select appropriate graph (e.g., scatter for continuous data)

1 pt

0.5-1

1

Graph Construction

Axes labeled, scale chosen correctly, accurate plotting

3 pts

1-3

3

Use of Computer

Use MATLAB for graphing and analysis

2 pts

0.5-2

1.5

Best-Fit Line

Draw line of best fit, calculate slope

1 pt

0.5-1

1

Data Interpretation

Explain graph trends and relationships

2 pts

0.5-2

1.5

Physical Meaning

Interpret slope and connect to known physics (e.g., gravity)

2 pts

0.5-2

1.5

Uncertainty/Error

Address experimental uncertainty, sources of error

1 pt

0.5-1

1

Data Analysis (Overall)

Organize and present entire lab (objective, methods, tables, results) clearly and logically

3 pts

1-3

2.5

Total Possible Score

20 pts

18

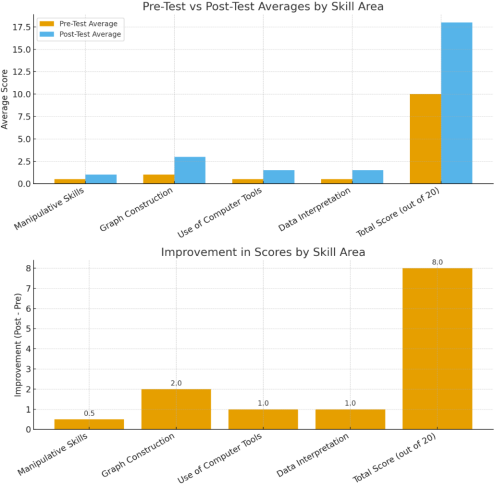
From the Table 4, presents the post-test assessment of students’ graphing and data analysis skills, showing substantial improvement across most areas compared to the pre-assessment Table 1. The total average score increased from a baseline of 10 points (pre-test) to 18 out of 20 points, indicating that the guided practice intervention was effective in enhancing students’ competencies as shown in Figure 4.
3.4. Result and Discussion
3.4.1. Results
The effectiveness of the guided practice intervention was evaluated using pre- and post-assessment scores across core skill domains (see Table 5). Students confirmed a substantial improvement, with the average total score increasing from 10 to 18 out of 20, representing an 80% improvement. The most significant gains were observed in Graph Construction (from average score of 1.0 to 3.0), Use of Computer Tools (from 0.5 to 1.5), Data Interpretation and Analysis (combined increase of 2.5 points), and Reporting and Presentation Skills (1.0 to 2.5) confirmed the statistical significance of the observed improvement across the cohort of 23 students. The paired t-test was used to evaluate the effectiveness of the guided practice intervention on students’ graphing and data analysis skills. Results indicated a significant improvement from pre-test (M = 10.0, SD = 0.8) to post-test (M = 18.0, SD = 1.2), t (22) = 38.46, p < 0.001, suggesting that the intervention had a statistically significant positive effect on students’ performance.
Figure 4. Comparison of Pre- and Post-Assessment Scores across Skill Areas.
Table 5. Comparison of Pre- and Post-Assessment Scores by basic Skill Area.

Skill Area

Pre-Test Average

Post-Test Average

Improvement

Manipulative Skills

0.5

1.0

+0.5

Graph Construction

1.0

3.0

+2.0

Use of Computer Tools

0.5

1.5

+1.0

Data Interpretation

0.5

1.5

+1.0

Total Score (out of 20)

10.0

18.0

+8.0

Learners reported increased confidence in using MATLAB for plotting and described clearer understanding of the relationships between physical quantities. Student reflections and instructor observations reinforced the quantitative findings. Sample student reflections included: “Before the guided practice, I could not decide which variable goes on which axis. Now I feel comfortable not just plotting, but explaining the graph.”- Student Reflection, Week 4. The post-assessment lab (Experiment: Measuring Local Acceleration Due to Gravity) confirmed these self-reports. Students accurately calculated average gravity as 8.72 m/s2, within an 11.11% error margin of the standard value. They correctly identified sources of systematic error, including height above sea level and timing inconsistencies. MATLAB-generated plots of T2 vs. L, showed well-labeled axes and appropriate use of best-fit lines. From the Table 2 shows Trial 1 being the most accurate measurement, the calculated local acceleration due to gravity is approximately 9.79 m/s2 slightly less than the standard value (9.81 m/s2), which could be due to experimental timing and length measurement uncertainties. Small inaccuracies in measuring the oscillation time became more significant at larger effective lengths, leading to larger percentage errors and less reliable results. These findings suggest that guided practice significantly enhances both procedural fluency and conceptual understanding in experimental physics contexts. This suggests that longer pendulum lengths introduced greater experimental uncertainty and timing errors. Students progressed from surface-level skills to meaningful analysis, supported by structured scaffolding and modeling. The observed gains align with literature that emphasizes cognitive apprenticeship and scaffold instruction .
3.4.2. Discussion
The results of this study strongly support the guided practice fetch a significantly enhances students’ graphing and data analysis skills in experimental physics settings. The structured intervention based on Principles of Instruction proved effective in addressing both procedural gaps (e.g., plotting and tool usage) and conceptual misunderstandings (e.g., interpreting slopes, identifying variables). These findings align with previous studies , reinforcing the idea that graphing is not an intuitive skill but one that benefits from explicit instruction, modeling, and scaffolder practice. The increase in scores across nearly every skill domain further validates the phased approach moving from instruction to independent application as an effective strategy for skill acquisition. The experiment “Measuring Local Acceleration Due to Gravity” was particularly suitable, as it integrated both theoretical physics and practical data processing. The measured average gravity value of 8.72 m/s2, although slightly lower than the standard 9.81 m/s2, is within an acceptable margin of error (11.11%) and reflects real-world variables like altitude. Moreover, the use of MATLAB facilitated deeper learning by requiring students to engage with real computational tools used in scientific practice, bridging classroom learning with industry-relevant applications. The improvement in MATLAB-based plotting underscores the importance of embedding computational literacy in lab instruction. Finally, students’ ability to discuss error sources, apply physical meaning to slopes, and justify their graphing decisions suggests not only skill acquisition but also the development of scientific reasoning an essential component of STEM education.
4. Conclusion
The guided practice intervention implemented in this study effectively enhanced first-year physics students’ graphing and data analysis skills in laboratory courses. The scaffolded, step-by-step instructional approach significantly improved procedural competencies, including graph construction, MATLAB usage, and data interpretation, as well as conceptual understanding of experimental results. Quantitative assessments showed an 80% overall improvement in core skills, while qualitative data indicated increased student confidence, analytical reasoning, and engagement in scientific inquiry. The post-assessment experiment, “Measuring Local Acceleration Due to Gravity,” yielded results within acceptable error margins, further validating the intervention’s effectiveness. These findings demonstrate that guided practice with structured support not only strengthens technical skills but also promotes deeper scientific reasoning, providing a replicable model for enhancing STEM laboratory instruction. Integrating such instructional strategies in undergraduate physics labs can foster both skill acquisition and independent problem-solving, preparing students for successful engagement in real-world scientific contexts.
Abbreviations

ADI

Argument Driven Inquiry

MATLAB

Matrix Laboratory

NRC

National Research Council

STEM

Science, Technology, Engineering, and Mathematics

ZPD

Zone of Proximal Development

Acknowledgments
I sincerely thank Almighty God! I am also deeply grateful to the first-year undergraduate physics students whose constructive feedback and participation provided high-quality data essential for this research. Their engagement contributed significantly to developing effective strategies for improving understanding of abstract physics concepts, problem-solving skills, and academic achievement.
Author Contributions
Berhanu Girmay Abay is the sole author. The author read and approved the final manuscript.
Conflicts of Interest
The authors declare that they have no conflict of interest.
References
[1] Beichner, R. J. (1994). Testing student interpretation of kinematics graphs.
[2] Lunsford, E., & Melear, C. T. (2004). Using scoring rubrics to evaluate inquiry: Three easy steps. Journal of College Science Teaching, 34(1), 34–38.
[3] McDermott, L. C., Shaffer, P. S., & Constantinou, C. P. (2000). Preparing teachers to teach physics and physical science by inquiry. Physics Education, 35(6), 411–416.
[4] Mokros, J. R., & Tinker, R. F. (1987). The impact of microcomputer-based labs on children’s ability to interpret graphs. Journal of Research in Science Teaching, 24(4), 369–383.
[5] Rosenshine, B. (2012). Principles of instruction: Research-based strategies that all teachers should know. American Educator, 36(1), 12–19.
[6] Roth, W. M., & Bowen, G. M. (2001). Professionals read graphs: A semiotic analysis. Journal of Research in Science Teaching, 38(2), 159–194.
[7] Tekkaya, C. (2003). Misconceptions as barriers to understanding science. Science Education International, 14(4), 354–365.
[8] Vygotsky, L. S. (1978). Mind in society: The development of higher psychological processes. Harvard University Press.
[9] Wood, D., Bruner, J. S., & Ross, G. (1976). The role of tutoring in problem solving. Journal of Child Psychology and Psychiatry, 17(2), 89–100.
[10] Zimmerman, B. J. (2002). Becoming a self-regulated learner: An overview. Theory into Practice, 41(2), 64–70.
[11] Hake, R. R. (1998). Interactive-engagement versus traditional methods: A six-thousand-student survey of mechanics test data for introductory physics courses. American Journal of Physics, 66(1), 64–74.
[12] Kohl, P. B., Rosengrant, D., & Finkelstein, N. D. (2007). Strongly and weakly directed approaches to teaching multiple representation use in physics. Physical Review Special Topics – Physics Education Research, 3(1), 010108.
[13] Kuhn, D. (2010). Teaching and learning science as argument. Science Education, 94(5), 810–824.
[14] Meltzer, D. E., & Thornton, R. K. (2012). Resource letter ALIP–1: Active-learning instruction in physics. American Journal of Physics, 80(6), 478–496.
[15] National Research Council. (2000). Inquiry and the national science education standards. National Academy Press.
[16] Redish, E. F. (2003). Teaching physics with the physics suite. John Wiley & Sons.
[17] Wieman, C., & Holmes, N. G. (2015). Measuring the impact of an instructional laboratory on the learning of introductory physics. American Journal of Physics, 83(11), 972–978.
[18] Freeman, S., Eddy, S. L., McDonough, M., Smith, M. K., Okoroafor, N., Jordt, H., & Wenderoth, M. P. (2014). Active learning increases student performance in science, engineering, and mathematics. Proceedings of the National Academy of Sciences, 111(23), 8410–8415.
[19] Holmes, N. G., Olsen, J., Thomas, J. L., & Wieman, C. E. (2017). Value added or misattributed? A multi-institution study on the educational benefit of labs for reinforcing physics content. Physical Review Physics Education Research, 13(1), 010129.
[20] Sokoloff, D. R., Thornton, R. K., & Laws, P. W. (1999). Active learning for introductory physics: A guide to the physics suite. Physics Education, 34(4), 242–247.
Cite This Article
  • APA Style

    Abay, B. G. (2026). Enhancing Students’ Graphing and Data Analysis Skills in Physics Laboratory Courses Through Guided Practice. International Journal of Theoretical and Applied Mathematics, 12(2), 46-56. https://doi.org/10.11648/j.ijtam.20261202.12

    Copy | Download

    ACS Style

    Abay, B. G. Enhancing Students’ Graphing and Data Analysis Skills in Physics Laboratory Courses Through Guided Practice. Int. J. Theor. Appl. Math. 2026, 12(2), 46-56. doi: 10.11648/j.ijtam.20261202.12

    Copy | Download

    AMA Style

    Abay BG. Enhancing Students’ Graphing and Data Analysis Skills in Physics Laboratory Courses Through Guided Practice. Int J Theor Appl Math. 2026;12(2):46-56. doi: 10.11648/j.ijtam.20261202.12

    Copy | Download

  • @article{10.11648/j.ijtam.20261202.12,
      author = {Berhanu Girmay Abay},
      title = {Enhancing Students’ Graphing and Data Analysis Skills in Physics Laboratory Courses Through Guided Practice},
      journal = {International Journal of Theoretical and Applied Mathematics},
      volume = {12},
      number = {2},
      pages = {46-56},
      doi = {10.11648/j.ijtam.20261202.12},
      url = {https://doi.org/10.11648/j.ijtam.20261202.12},
      eprint = {https://article.sciencepublishinggroup.com/pdf/10.11648.j.ijtam.20261202.12},
      abstract = {Graphing and data analysis are essential skills in physics laboratories, yet many first-year students face challenges in accurately representing and interpreting experimental data. This study aimed to investigate the effectiveness of a guided practice intervention in improving these skills among 23 undergraduate physics students at Raya University. A classroom-based action research design with a quasi-experimental pre-test/post-test approach was implemented over four weeks, embedding scaffold, step-by-step guidance into regular laboratory sessions. Quantitative data from assessments and qualitative data from student reflections, surveys, and observations were collected to evaluate the intervention. Pre-intervention assessment revealed notable weaknesses in graph construction, use of computational tools, and data interpretation. Following the guided practice, students’ average scores improved from 10 to 18 out of 20, with the largest gains observed in graphing, MATLAB application, and result analysis. Post-assessment of the experiment “Measuring Local Acceleration Due to Gravity” yielded an average value of 8.72 m/s², within 11.11% of the standard, demonstrating the accuracy and effectiveness of the intervention. Qualitative findings indicated increased confidence, improved conceptual understanding, and enhanced scientific reasoning. These results suggest that scaffold guided practice significantly enhances procedural and conceptual competencies in experimental physics. The study provides a replicable instructional model for strengthening STEM laboratory learning, particularly for students who require additional support in foundational physics skills.},
     year = {2026}
    }
    

    Copy | Download

  • TY  - JOUR
    T1  - Enhancing Students’ Graphing and Data Analysis Skills in Physics Laboratory Courses Through Guided Practice
    AU  - Berhanu Girmay Abay
    Y1  - 2026/05/28
    PY  - 2026
    N1  - https://doi.org/10.11648/j.ijtam.20261202.12
    DO  - 10.11648/j.ijtam.20261202.12
    T2  - International Journal of Theoretical and Applied Mathematics
    JF  - International Journal of Theoretical and Applied Mathematics
    JO  - International Journal of Theoretical and Applied Mathematics
    SP  - 46
    EP  - 56
    PB  - Science Publishing Group
    SN  - 2575-5080
    UR  - https://doi.org/10.11648/j.ijtam.20261202.12
    AB  - Graphing and data analysis are essential skills in physics laboratories, yet many first-year students face challenges in accurately representing and interpreting experimental data. This study aimed to investigate the effectiveness of a guided practice intervention in improving these skills among 23 undergraduate physics students at Raya University. A classroom-based action research design with a quasi-experimental pre-test/post-test approach was implemented over four weeks, embedding scaffold, step-by-step guidance into regular laboratory sessions. Quantitative data from assessments and qualitative data from student reflections, surveys, and observations were collected to evaluate the intervention. Pre-intervention assessment revealed notable weaknesses in graph construction, use of computational tools, and data interpretation. Following the guided practice, students’ average scores improved from 10 to 18 out of 20, with the largest gains observed in graphing, MATLAB application, and result analysis. Post-assessment of the experiment “Measuring Local Acceleration Due to Gravity” yielded an average value of 8.72 m/s², within 11.11% of the standard, demonstrating the accuracy and effectiveness of the intervention. Qualitative findings indicated increased confidence, improved conceptual understanding, and enhanced scientific reasoning. These results suggest that scaffold guided practice significantly enhances procedural and conceptual competencies in experimental physics. The study provides a replicable instructional model for strengthening STEM laboratory learning, particularly for students who require additional support in foundational physics skills.
    VL  - 12
    IS  - 2
    ER  - 

    Copy | Download

Author Information