This article examines the reliability of Japanese candlestick patterns in signaling trend reversals across distinct market regimes. The dataset consists of 500 daily observations collected from publicly available financial market data. Focusing on key patterns such as the Hammer, Bullish Engulfing, Shooting Star, Bearish Engulfing, and Doji, the analysis combines automated pattern detection in Python with standard technical indicators, including moving averages, the Relative Strength Index, the Moving Average Convergence Divergence, and Bollinger Bands. Confirmation rates are compared between stable periods and crisis episodes, using logistic models and statistical tests to assess differences in predictive performance. The results show that candlestick patterns display moderate reliability in stable markets but lose a substantial part of their signaling power during crisis periods, when volatility and price discontinuities increase. This deterioration is consistent with insights from behavioral finance, where heightened uncertainty amplifies cognitive biases and weakens the informational content of technical signals. The findings support the use of candlestick patterns only within a broader framework that combines trend, momentum, and volatility filters, rather than as standalone decision tools, particularly when market conditions are unstable.
| Published in | Innovation Management (Volume 1, Issue 1) |
| DOI | 10.11648/j.im.20260101.16 |
| Page(s) | 44-54 |
| Creative Commons |
This is an Open Access article, distributed under the terms of the Creative Commons Attribution 4.0 International License (http://creativecommons.org/licenses/by/4.0/), which permits unrestricted use, distribution and reproduction in any medium or format, provided the original work is properly cited. |
| Copyright |
Copyright © The Author(s), 2026. Published by Science Publishing Group |
Japanese Candlestick Patterns, Market Regimes, Volatility, Behavioral Finance, Technical Analysis, Signal Reliability
Candlestick Pattern | Buy Success Rate (%) | Sell Success Rate (%) |
|---|---|---|
Hammer | 50.68 | – |
Bullish Engulfing | 51.35 | – |
Shooting Star | – | 48.54 |
Bearish Engulfing | – | 53.23 |
Doji | 40.00 | 57.78 |
Combination | Success Rate (%) |
|---|---|
Hammer + RSI Buy Signal | 47.82 |
Bearish Engulfing + RSI Sell Signal | 40.00 |
Major_Event | Candlestick_Pattern | RSI_14 | Stochastic_%K | MACD | Volatility |
|---|---|---|---|---|---|
Covid-19 | Bearish Engulfing | 55,78473226 | 62,57709426 | -0,614996234 | 0,084139315 |
Covid-19 | Bullish Engulfing | 58,23230957 | 52,66565557 | 0,471080215 | 0,215380372 |
Covid-19 | Doji | 63,68583701 | 67,8832189 | 0,819795694 | 0,273706731 |
Covid-19 | Hammer | 63,84161495 | 66,28157269 | 0,043710779 | 0,398276325 |
Covid-19 | Shooting Star | 61,08378646 | 58,29534213 | -0,345600841 | 0,067282707 |
No Event | Bearish Engulfing | 42,83858941 | 42,11906153 | -1,0533802 | -0,546760106 |
No Event | Bullish Engulfing | 43,74701478 | 38,25456403 | -1,365942002 | 0,279966017 |
No Event | Doji | 43,35924598 | 39,86168056 | -0,852327344 | -0,163358293 |
No Event | Hammer | 44,2875017 | 40,8288992 | -0,514293792 | -0,222761378 |
No Event | Shooting Star | 46,33464587 | 43,13249732 | -0,342702799 | 0,025174734 |
Metric | With Combined Signals | Without Combined Signals |
|---|---|---|
Average Return | 1.50% | –0.28% |
Standard Deviation | 0.047 | 0.053 |
Gain/Loss Ratio | 1.27 | 0.97 |
Pattern | Period | Confirmation Rate (%) |
|---|---|---|
Hammer | Stable | 67.3% |
Hammer | Crisis | 44.4% |
Bullish Engulfing | Stable | 70.5% |
Bullish Engulfing | Crisis | 47.6% |
Pattern | Z-Test Statistic | p-value |
|---|---|---|
Hammer | 2.20 | 0.028 |
Bullish Engulfing | 2.12 | 0.034 |
RSI | Relative Strength Index |
MACD | Moving Average Convergence Divergence |
EMA | Exponential Moving Average |
SMA | Simple Moving Average |
BB | Bollinger Bands |
OHLC | Open, High, Low, Close |
COVID-19 | Coronavirus Disease 2019 |
%K | Stochastic Oscillator %k |
%D | Stochastic Oscillator %d |
Z-TEST | Z Statistical Test |
MA | Moving Average |
SD | Standard Deviation |
| [1] | Barberis, N., Huang, M., & Santos, T. (2001). Prospect theory and asset prices. The Quarterly Journal of Economics, 116(1), 1–53. |
| [2] | Barberis, N., & Thaler, R. (2003). A survey of behavioral finance. In G. M. Constantinides, M. Harris, & R. M. Stulz (Eds.), Handbook of the economics of finance (Vol. 1, pp. 1053–1128). Elsevier. |
| [3] | Bollen, N. P. B., & Busse, J. A. (2001). On the timing ability of mutual fund managers. The Journal of Finance, 56(3), 1075–1094. |
| [4] | Brock, W., Lakonishok, J., & LeBaron, B. (1992). Simple technical trading rules and the stochastic properties of stock returns. The Journal of Finance, 47(5), 1731–1764. |
| [5] | Chan, L. K. C., Jegadeesh, N., & Lakonishok, J. (1996). Momentum strategies. The Journal of Finance, 51(5), 1681–1713. |
| [6] | De Bondt, W. F. M., & Thaler, R. H. (1985). Does the stock market overreact? The Journal of Finance, 40(3), 793–805. |
| [7] | Dow, C. H. (1900). Dow theory: Interpretations and applications. Reprinted in Hamilton, W. P. (1922). The stock market barometer (pp. 5–22). Harper & Brothers. |
| [8] | Elliott, R. N. (1938). The wave principle (pp. 10–38). Financial Publications. |
| [9] | Fama, E. F. (1970). Efficient capital markets: A review of theory and empirical work. The Journal of Finance, 25(2), 383–417. |
| [10] | Fama, E. F., & French, K. R. (1992). The cross-section of expected stock returns. The Journal of Finance, 47(2), 427–465. |
| [11] | Glaser, M., Langer, T., & Weber, M. (2005). Overconfidence of professionals and lay men: Individual differences within and between tasks? University of Mannheim Working Paper, 1–35. |
| [12] | Jegadeesh, N., & Titman, S. (1993). Returns to buying winners and selling losers: Implications for stock market efficiency. The Journal of Finance, 48(1), 65–91. |
| [13] | Kahneman, D., & Tversky, A. (1979). Prospect theory: An analysis of decision under risk. Econometrica, 47(2), 263–291. |
| [14] | Kim, K. A., & Nofsinger, J. R. (2007). Corporate governance (pp. 89–112). Pearson Prentice Hall. |
| [15] | Lo, A. W., Mamaysky, H., & Wang, J. (2000). Foundations of technical analysis: Computational algorithms, statistical inference, and empirical implementation. The Journal of Finance, 55(4), 1705–1765. |
| [16] | Lux, T. (1995). Herd behaviour, bubbles and crashes. The Economic Journal, 105(431), 881–896. |
| [17] | Murphy, J. J. (1999). Technical analysis of the financial markets: A comprehensive guide to trading methods and applications (pp. 145–198). New York Institute of Finance. |
| [18] | Neely, C. J., Rapach, D. E., Tu, J., & Zhou, G. (2014). Forecasting the equity risk premium: The role of technical indicators. Management Science, 60(7), 1772–1791. |
| [19] | Nison, S. (2001). Japanese candlestick charting techniques (2nd ed., pp. 75–110). New York Institute of Finance. |
| [20] | Odean, T. (1998). Are investors reluctant to realize their losses? The Journal of Finance, 53(5), 1775–1798. |
| [21] | Park, C.-H., & Irwin, S. H. (2007). What do we know about the profitability of technical analysis? Journal of Economic Surveys, 21(4), 786–826. |
| [22] | Shefrin, H. (2000). Beyond greed and fear: Understanding behavioral finance and the psychology of investing (pp. 55–102). Harvard Business School Press. |
| [23] | Shiller, R. J. (2000). Irrational exuberance (pp. 1–45). Princeton University Press. |
| [24] | Tetlock, P. C. (2007). Giving content to investor sentiment: The role of media in the stock market. The Journal of Finance, 62(3), 1139–1168. |
| [25] | Thaler, R. H. (1999). The end of behavioral finance. Financial Analysts Journal, 55(6), 12–17. |
| [26] | Yadav, P., & Giri, J. N. (2025). Technical Analysis Vs Fundamental Analysis: A Comparative Study of Bollinger Bands, RSI and MACD Against Fundamental Factors in Commodity Trading. Journal of Marketing & Social Research, 2(2), 323-329. |
APA Style
Loubaris, R. (2026). Assessing the Reliability of Japanese Candlestick Patterns Across Market Regimes. Innovation Management, 1(1), 44-54. https://doi.org/10.11648/j.im.20260101.16
ACS Style
Loubaris, R. Assessing the Reliability of Japanese Candlestick Patterns Across Market Regimes. Innov. Manag. 2026, 1(1), 44-54. doi: 10.11648/j.im.20260101.16
@article{10.11648/j.im.20260101.16,
  author = {Rania Loubaris},
  title = {Assessing the Reliability of Japanese Candlestick Patterns Across Market Regimes},
  journal = {Innovation Management},
  volume = {1},
  number = {1},
  pages = {44-54},
  doi = {10.11648/j.im.20260101.16},
  url = {https://doi.org/10.11648/j.im.20260101.16},
  eprint = {https://article.sciencepublishinggroup.com/pdf/10.11648.j.im.20260101.16},
  abstract = {This article examines the reliability of Japanese candlestick patterns in signaling trend reversals across distinct market regimes. The dataset consists of 500 daily observations collected from publicly available financial market data. Focusing on key patterns such as the Hammer, Bullish Engulfing, Shooting Star, Bearish Engulfing, and Doji, the analysis combines automated pattern detection in Python with standard technical indicators, including moving averages, the Relative Strength Index, the Moving Average Convergence Divergence, and Bollinger Bands. Confirmation rates are compared between stable periods and crisis episodes, using logistic models and statistical tests to assess differences in predictive performance. The results show that candlestick patterns display moderate reliability in stable markets but lose a substantial part of their signaling power during crisis periods, when volatility and price discontinuities increase. This deterioration is consistent with insights from behavioral finance, where heightened uncertainty amplifies cognitive biases and weakens the informational content of technical signals. The findings support the use of candlestick patterns only within a broader framework that combines trend, momentum, and volatility filters, rather than as standalone decision tools, particularly when market conditions are unstable.},
 year = {2026}
}
TY  - JOUR
T1  - Assessing the Reliability of Japanese Candlestick Patterns Across Market Regimes
AU  - Rania Loubaris
Y1  - 2026/02/14
PY  - 2026
N1  - https://doi.org/10.11648/j.im.20260101.16
DO  - 10.11648/j.im.20260101.16
T2  - Innovation Management
JF  - Innovation Management
JO  - Innovation Management
SP  - 44
EP  - 54
PB  - Science Publishing Group
UR  - https://doi.org/10.11648/j.im.20260101.16
AB  - This article examines the reliability of Japanese candlestick patterns in signaling trend reversals across distinct market regimes. The dataset consists of 500 daily observations collected from publicly available financial market data. Focusing on key patterns such as the Hammer, Bullish Engulfing, Shooting Star, Bearish Engulfing, and Doji, the analysis combines automated pattern detection in Python with standard technical indicators, including moving averages, the Relative Strength Index, the Moving Average Convergence Divergence, and Bollinger Bands. Confirmation rates are compared between stable periods and crisis episodes, using logistic models and statistical tests to assess differences in predictive performance. The results show that candlestick patterns display moderate reliability in stable markets but lose a substantial part of their signaling power during crisis periods, when volatility and price discontinuities increase. This deterioration is consistent with insights from behavioral finance, where heightened uncertainty amplifies cognitive biases and weakens the informational content of technical signals. The findings support the use of candlestick patterns only within a broader framework that combines trend, momentum, and volatility filters, rather than as standalone decision tools, particularly when market conditions are unstable.
VL  - 1
IS  - 1
ER  -
ESLSCA Business School, ESLSCA Paris Campus Rabat, Rabat, Morocco
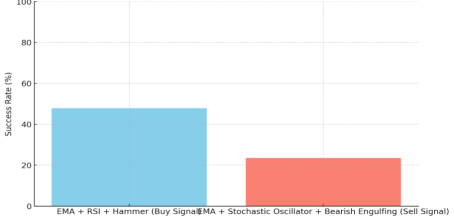
Figure 1. Success rates of optimal combinations of technical indicators and Japanese candlestick patterns.
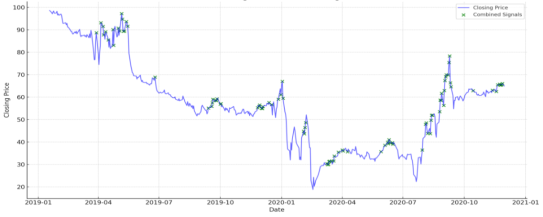
Figure 2. Indicator combinations and price change.
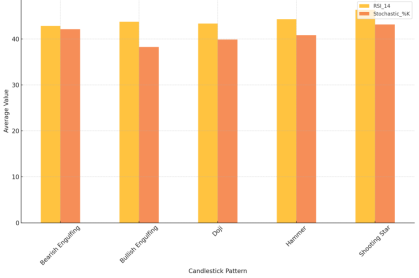
Figure 3. Mean RSI and Stochastic Oscillator values by Candlestick pattern in stable periods.
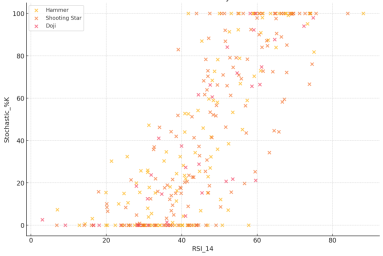
Figure 4. RSI vs. Stochastic Oscillator by Candlestick pattern.
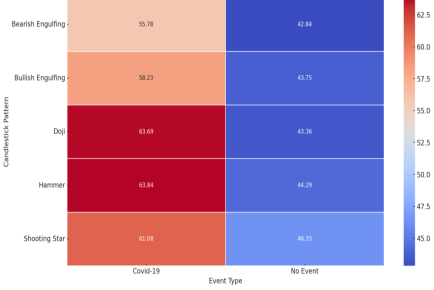
Figure 5. Comparative RSI heatmap during major events vs. stable periods by Candlestick pattern.
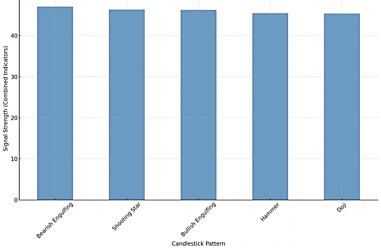
Figure 6. Signal strength by Japanese Candlestick pattern.
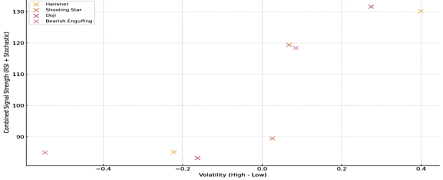
Figure 7. Volatility vs. combined signal strength by Candlestick pattern.
Information

